. 2015 Feb 8:12:10.
doi: 10.1186/s12950-015-0055-6. eCollection 2015.

Antioxidant polyphenol-rich extracts from the medicinal plants Antirhea borbonica, Doratoxylon apetalum and Gouania mauritiana protect 3T3-L1 preadipocytes against H2O2, TNFα and LPS inflammatory mediators by regulating the expression of superoxide dismutase and NF-κB genes

Affiliations

Antioxidant polyphenol-rich extracts from the medicinal plants Antirhea borbonica, Doratoxylon apetalum and Gouania mauritiana protect 3T3-L1 preadipocytes against H2O2, TNFα and LPS inflammatory mediators by regulating the expression of superoxide dismutase and NF-κB genes

Méry Marimoutou et al. J Inflamm (Lond). .

Abstract

Background: Adipose cells responsible for fat storage are the targets of reactive oxygen species (ROS) like H2O2 and pro-inflammatory agents including TNFα and LPS. Such mediators contribute to oxidative stress and alter inflammatory processes in adipose tissue, leading to insulin resistance during obesity. Thus, the identification of natural compounds such as plant polyphenols able to increase the antioxidant and anti-inflammatory capacity of the body is of high interest. We aimed to evaluate the biological properties of polyphenol-rich extracts from the medicinal plants A. borbonica, D. apetalum and G. mauritiana on preadipocytes exposed to H2O2, TNFα or LPS mediators.

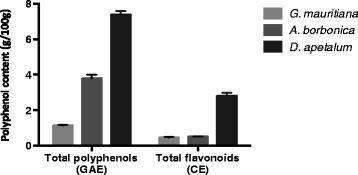
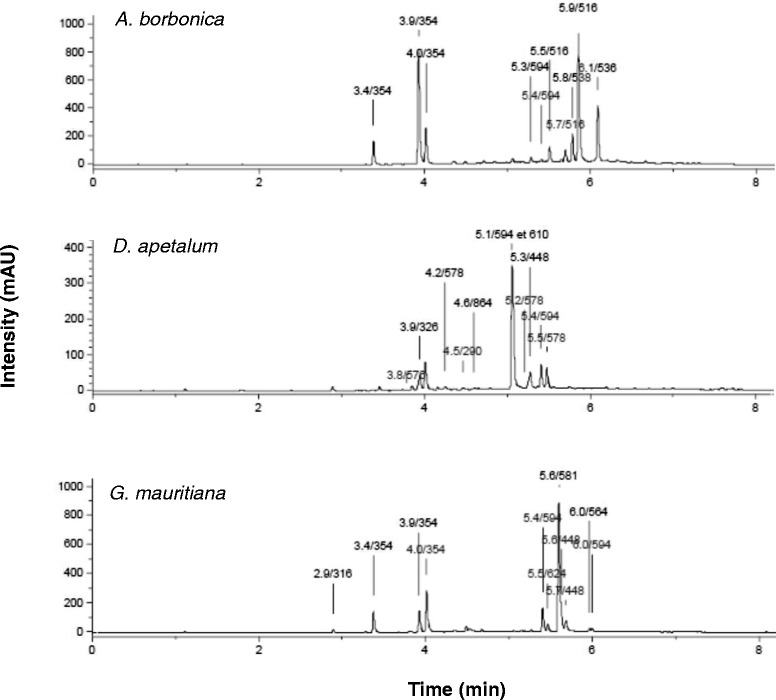
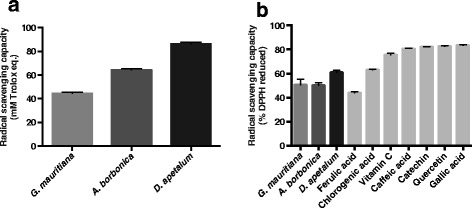
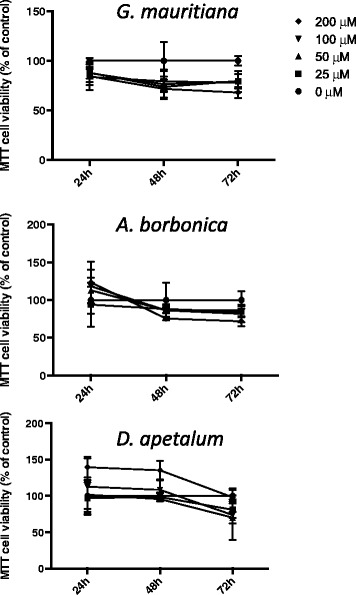
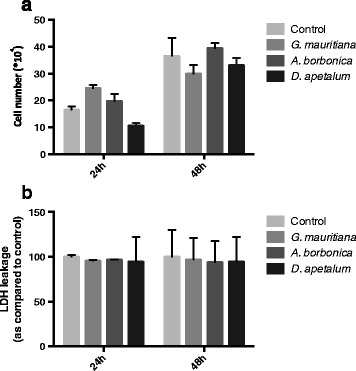
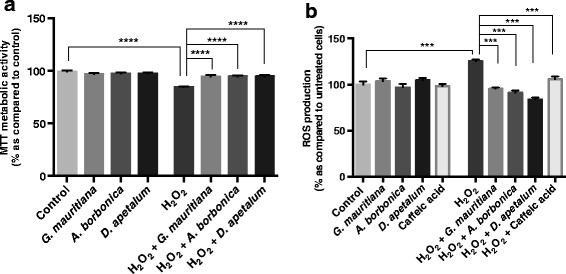
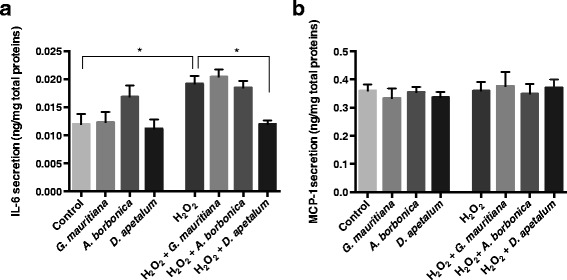
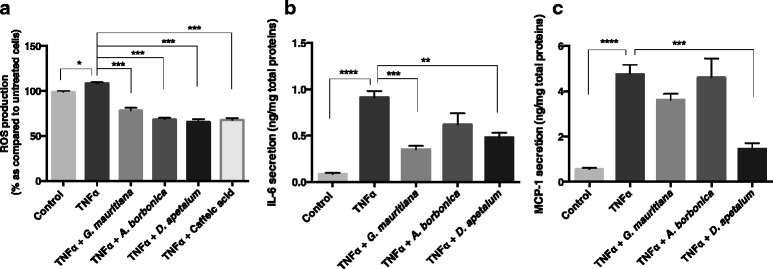
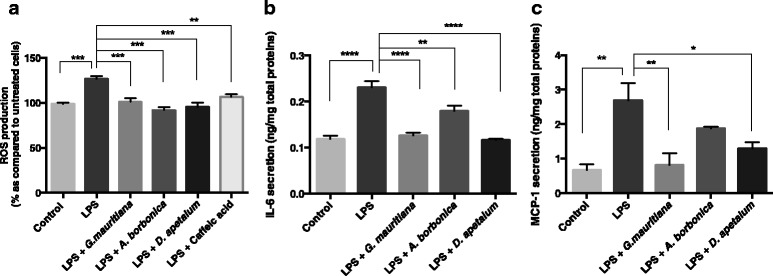
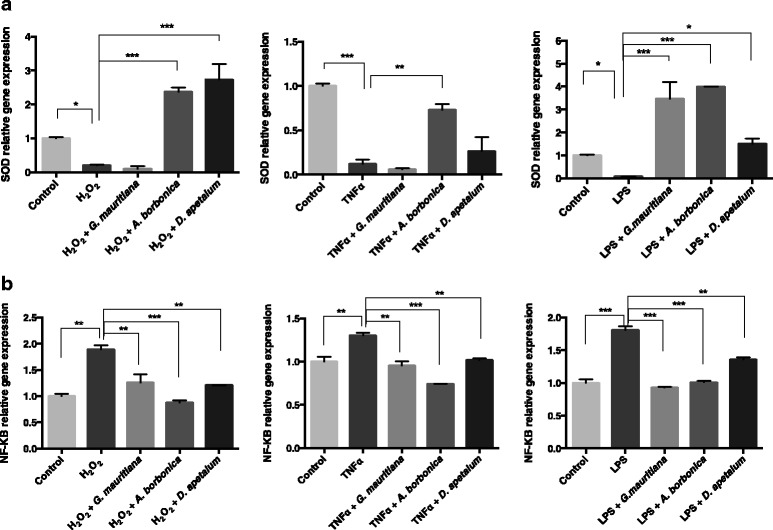
Methods: Medicinal plant extracts were analysed for their polyphenol contents by Folin-Ciocalteu and UPLC-ESI-MS methods as well as for their free radical-scavenging activities by DPPH and ORAC assays. To assess the ability of polyphenol-rich extracts to protect 3T3-L1 preadipocytes against H2O2, TNFα or LPS mediators, several parameters including cell viability (MTT and LDH assays), ROS production (DCFH-DA test), IL-6 and MCP-1 secretion (ELISA) were evaluated. Moreover, the expression of superoxide dismutase, catalase and NF-κB genes was explored (RT-QPCR).

Results: All medicinal plants exhibited high levels of polyphenols with free radical-scavenging capacities. Flavonoids such as quercetin, kaempferol, epicatechin and procyanidins, and phenolic acids derived from caffeic acid including chlorogenic acid, were detected. Polyphenol-rich plant extracts did not exert a cytotoxic effect on preadipocytes but protected them against H2O2 anti-proliferative action. Importantly, they down-regulated ROS production and the secretion of IL-6 and MCP-1 pro-inflammatory markers induced by H2O2, TNFα and LPS mediators. Such a protective action was associated with an increase in superoxide dismutase antioxidant enzyme gene expression and a decrease in mRNA levels of NF-κB pro-inflammatory transcription factor.

Conclusion: This study highlights that antioxidant strategies based on polyphenols derived from medicinal plants tested could contribute to regulate adipose tissue redox status and immune process, and thus participate to the improvement of obesity-related oxidative stress and inflammation.

Keywords: Antioxidant strategies; Inflammation; Obesity; Oxidative stress; Plant polyphenols.


Figures

Figure 1
Figure 1
Total polyphenol contents of A. borbonica, D. apetalum and G. mauritiana plant extracts. Polyphenols and flavonoids levels were determined by using colorimetric assays and respectively expressed as g gallic acid equivalent (GAE) / 100 g plant powder or g catechin equivalent (CE) / 100 g plant powder. Data are means ± SEM of three independent experiments.
Figure 2
Figure 2
Identification of polyphenols from A. borbonica, D. apetalum and G. mauritiana plant extracts. Polyphenol-rich plant extracts were analysed by UPLC-ESI-MS method (320 nm). Compounds were identified according to their retention time (min)/molecular weight (Da). Polyphenols detected from A. borbonica plant extract were chlorogenic acids (3.4/354; 3.9/354; 4.0/354), kaempferol-O-hexoside-O-rhamnoside (5.3/594; 5.4/594) and dicaffeoylquinic acid (5.5/516; 5.7/516, 5.9/516). Polyphenols detected from D. apetalum plant extract were procyanidins including dimer type A (3.8/576), dimer type B (4.2/578; 5.2/578) and trimer type A (4.6/864), coumaric acid-O-hexoside (3.9/326), epicatechin (4.5/290), kaempferol-O-hexoside-O-rhamnoside (5.1/594; 5.4/594), quercetin-O-rutinoside (5.1/610) and kaempferol 3-O-hexoside (5.3/448). Polyphenols detected from G. mauritiana plant extract were protocatechuic acid-O-hexoside (2.9/316), chlorogenic acids (3.4/354; 3.9/354; 4.0/354), kaempferol-O-hexoside-O-rhamnoside (5.4/594), isorhamnetin-O-hexoside-O-rhamnoside (5.5/624), quercetin-O-xyloside-O-rhamnoside (5.6/581), kaempferol-O-hexoside (5.6/448), quercetin-O-rhamnoside (5.7/448), kaempferol-O-rhamnoside-O-xyloside (6.0/564) and isorhamnetin-O-rhamnoside-O-xyloside (6.0/594).
Figure 3
Figure 3
Antioxidant activities of polyphenol-rich plant extracts. (a) Free radical-scavenging capacity of plant extracts was assessed by ORAC assay and expressed as mM Trolox equivalent. (b) Free radical-scavenging activities of plant extracts and standard polyphenols and vitamin C (100 μM) were measured through DPPH method and expressed as % DPPH reduced. Data are means ± SEM of three independent experiments.
Figure 4
Figure 4
Effect of polyphenol-rich plant extracts on preadipocyte mitochondrial metabolic activity. Cells were exposed to each plant extract (0–200 μM GAE) for 24, 48 and 72 h. Then, the mitochondrial metabolic activity of cells was measured by MTT assay. Data are means ± SEM of three independent experiments.
Figure 5
Figure 5
Effect of polyphenol-rich plant extracts on preadipocyte viability. Cells were exposed to each plant extract (25 μM GAE) for 24 and 48 h. (a) In order to assess cell growth, cells were counted manually by using Trypan blue reagent. (b) To evaluate cell death, LDH activity in the cell culture medium was determined by using an enzymatic kit. Data are means ± SEM of three independent experiments.
Figure 6
Figure 6
Effect of polyphenol-rich plant extracts on the viability and ROS production of preadipocytes exposed to H 2 O 2 . (a) Cells were exposed to each plant extract (25 μM GAE) or treated with H2O2 (200 μM) in the presence or not of each plant extract (25 μM GAE) for 24 h. Then, the mitochondrial metabolic activity of cells was measured by MTT assay. (b) Cells were exposed to 10 μM of DCFH-DA for 45 min at 37°C and then were treated with each plant extract (25 μM GAE) or caffeic acid as a positive control (25 μM), or treated with H2O2 (200 μM) in the presence or not of each plant extract (25 μM GAE) or caffeic acid (25 μM) for 1 h. Data are means ± SEM of three independent experiments. ***: p < 0.001, ****: p < 0.0001 as compared to H2O2.
Figure 7
Figure 7
Effect of polyphenol-rich plant extracts on IL-6 and MCP-1 secretion from preadipocytes exposed to H 2 O 2 . Cells were exposed to each plant extract (25 μM GAE) or treated with H2O2 (200 μM) in the presence or not of each plant extract (25 μM GAE) for 24 h. Then, levels of IL-6 (a) and MCP-1 (b) were measured by ELISA kits. Data are means ± SEM of three independent experiments. *: p < 0.05 as compared to H2O2.
Figure 8
Figure 8
Effect of polyphenol-rich plant extracts on ROS, IL-6 and MCP-1 production from preadipocytes exposed to TNFα. (a) Cells were exposed to 10 μM of DCFH-DA for 45 min at 37°C and then were treated with TNFα (5 ng/mL) in the presence or not of each plant extract (25 μM GAE) or caffeic acid (25 μM) for 1 h. (b) Cells were treated with TNFα (5 ng/mL) in the presence or not of each plant extract (25 μM GAE) for 24 h. Then, levels of IL-6 were measured by ELISA kit. (c) According to the experimental condition used for IL-6 detection, levels of MCP-1 were measured by ELISA kit. Data are means ± SEM of three independent experiments. *: p < 0.05, **: p < 0.01, ***: p < 0.001, ****: p < 0.0001 as compared to TNFα.
Figure 9
Figure 9
Effect of polyphenol-rich plant extracts on ROS, IL-6 and MCP-1 production from preadipocytes exposed to LPS. (a) Cells were exposed to 10 μM of DCFH-DA for 45 min at 37°C and then were treated with E. coli LPS (1 μg/mL) in the presence or not of each plant extract (25 μM GAE) or caffeic acid (25 μM) for 1 h. (b) Cells were treated with E. coli LPS (1 μg/mL) in the presence or not of each plant extract (25 μM GAE) for 24 h. Then, levels of IL-6 were measured by ELISA kit. (c) According to the experimental condition used for IL-6 detection, levels of MCP-1 were measured by ELISA kit. Data are means ± SEM of three independent experiments. *: p < 0.05, **: p < 0.01, ***: p < 0.001, ****: p < 0.0001 as compared to LPS.
Figure 10
Figure 10
Effect of polyphenol-rich plant extracts on the expression of SOD and NF-κB genes from preadipocytes exposed to H 2 O 2, TNFα or LPS. Cells were treated with H2O2 (200 μM), TNFα (5 ng/mL) or E. coli LPS (1 μg/mL) in the presence or not of each plant extract (25 μM GAE) for 24 h. Then, the relative expression of SOD (a) and NF-κB (b) genes was measured by RT-QPCR and normalized against the expression level of GAPDH gene. Data are means ± SEM of three independent experiments. *: p < 0.05, **: p < 0.01, ***: p < 0.001 as compared to H2O2, TNFα or LPS.

Similar articles

Cited by

References

    1. Houstis N, Rosen E, Lander E. Reactive oxygen species have a causal role in multiple forms of insulin resistance. Nature (Lond) 2006;440:944–8. doi: 10.1038/nature04634. - DOI - PubMed
    1. Furukawa S, Fujita T, Shimabukuro M, Iwaki M, Yamada Y, Nakajima Y. Increased oxidative stress in obesity and its impact on metabolic syndrome. J Clin Investig. 2004;114:1752–61. doi: 10.1172/JCI21625. - DOI - PMC - PubMed
    1. Lin Y, Berg A, Iyengar P, Lam T, Giacca A, Combs T. The hyperglycemia- induced inflammatory response in adipocytes: the role of reactive oxygen species. J Biol Chem. 2005;280:4617–26. doi: 10.1074/jbc.M411863200. - DOI - PubMed
    1. Rigoulet M, Yoboue E, Devin A. Mitochondrial ROS generation and its regulation: mechanisms involved in H (2) O (2) signaling. Antioxid Redox Signal. 2011;14:459–68. doi: 10.1089/ars.2010.3363. - DOI - PubMed
    1. de Ferranti S, Mozaffarian D. The Perfect Storm: Obesity, Adipocyte Dysfunction, and Metabolic Consequences. Clin Chem. 2008;54:1–12. doi: 10.1373/clinchem.2007.100156. - DOI - PubMed

LinkOut - more resources