. 2015:2015:437127.
doi: 10.1155/2015/437127. Epub 2015 Jan 15.

The synergistic effects of heat shock protein 70 and ginsenoside Rg1 against tert-butyl hydroperoxide damage model in vitro

Affiliations

The synergistic effects of heat shock protein 70 and ginsenoside Rg1 against tert-butyl hydroperoxide damage model in vitro

Dan Lu et al. Oxid Med Cell Longev. 2015.

Abstract

Neural stem cells (NSCs) transplanted is one of the hottest research to treat Alzheimer's disease (AD), but cholinergic neurons from stem cells were also susceptible to cell death which Heat shock protein 70 (HSP70) was affirmed to reverse. Related to cognitive impairment, cholinergic nervous cells should be investigated and ginsenoside Rg1 (G-Rg1) was considered to increase them. We chose tert-butyl hydroperoxide (t-BHP) damage model to study in vitro. Functional properties of our recombination plasmid pEGFP-C2-HSP70 were affirmed by SH-SY5Y cells. To opposite the transitory appearance of HSP70, NSCs used as the vectors of HSP70 gene overexpressed HSP70 for at least 7 days in vitro. After transfection for 3 days, G-Rg1 pretreatment for 4 hours, and coculture for 3 days, the expression of acetylcholinesterase (ChAT), synaptophysin, and the ratio of NeuN and GFAP were assessed by western blot; Morphological properties were detected by 3D reconstruction and immunofluorescence. ChAT was markedly improved in the groups contained G-Rg1. In coculture system, the ratio of neurons/astrocytes and the filaments of neurons were increased; apoptosis cells were decreased, compared to monotherapy (P < 0.05). In conclusion, we demonstrated that, as a safe cotreatment affirmed in vitro, overexpression of HSP70 in NSCs plus G-Rg1 promoted nervous cells regeneration from chronic oxidative damage.


Figures

Figure 1
Figure 1
Effects of pEGFP-HSP70, t-BHP, and G-Rg1 on SH-SY5Y cell viability. (a) The expression of HSP70 secreted by SH-SY5Y was captured by light microscope in C (media control), pEGFP (transfected with pEGFP in media), and pEGFP-HSP70 (transfected with pEGFP-HSP70 in media) groups. (b) Cells were subjected to the MTT assay to detect whether our recombination plasmid pEGFP-C2-HSP70 affected cell viability in pEGFP-HSP70 compared to C. Statistical comparisons were carried out with Student's t-test. Values were presented as mean ± SEM. n = 3. (c) HSP70 protein was detected by Western Blot analysis. Statistical comparisons were carried out with Student's t-test. Values were presented as mean ± SEM. * P < 0.05; experimental group versus medium control. n = 3. (d) Compared to media control group, cells after being transfected were used to the MTT assay for viability analysis, respectively. Statistical comparisons were carried out with Student's t-test. Values were presented as mean ± SEM. n = 3. The two groups which were transfected with pEGFP and pEGFP-HSP70 versus medium control. (e) SH-SY5Y cells were treated with t-BHP at various concentrations (0, 125, 250, 500, 750, 1000, and 1500 μmol/L) for 1 hour. (f) G-Rg1 at various concentrations for 24 hours. Cells were subjected to the MTT assay for viability analysis, respectively. Statistical comparisons were carried out with one ANOVA. Values were presented as mean ± SEM. * P < 0.05 versus medium group. n = 3.
Figure 2
Figure 2
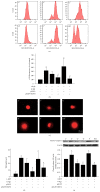
Functional properties of HSP70 and G-Rg1 on t-BHP-induced SHSY5Y cell injury. (a) ROS production in SHSY-5Y was determined using BD FACS. (b) ROS production was shown by DCF fluorescence in C′ (media control), T′ (10 μmol/L t-BHP), G′ (10 μmol/L G-Rg1 and 10 μmol/L t-BHP), H′ (SHSY-5Y cultured in 10 μmol/L t-BHP after being transfected with pEGFP-HSP70), P′ (SHSY-5Y cultured in 10 μmol/L t-BHP after being transfected with pEGFP), and HG′ (SH-SY5Y cultured in 10 μmol/L G-Rg1 and 10 μmol/L t-BHP after being transfected with pEGFP-HSP70), respectively. Statistical comparisons were carried out with Student's t-test. Values were presented as mean ± SEM. n = 3. T′, G′, H′, P′, and HG′ versus C′; # P < 0.05 versus T′. (c) DNA fragment in SH-SY5Y cells was determined using fluorescence microscope. (d) DNA fragment was described by tail lengths which were assessed by CAMP software in C′, T′, G′, H′, P′, and HG′, respectively. Statistical comparisons were carried out with Student's t-test. Values were presented as mean ± SEM. n = 3. T′, G′, H′, P′, and HG′ versus C′; # P < 0.05 versus T′. (e) SH-SY5Y cells were then subjected to apoptosis analysis. Apoptosis of neurons was determined by Western blot analysis of cleaved Caspase-3 levels. Statistical comparisons were carried out with Student's t-test. Values were presented as mean ± SEM. * P < 0.05 versus C′; # P < 0.05 versus T′. n = 3.
Figure 3
Figure 3
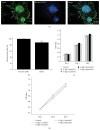
G-Rg1 stimulated NSCs proliferation. (a) Immunofluorescence analysis of hippocampal NSCs cultures treated with media in 3rd day, stained with antibodies against the NSC-specific Nestin (green), and nuclei were counterstained with Hoechst 33342 (blue). (b) The nestin positive cells were counted by Image J software; statistical comparisons were carried out with Independent t-test. Values were represented as mean ± SEM. Nestin positive cells versus Hoechst-stained cells. n = 9. (c) The MTT assay indirectly showed the OD value of NSCs proliferation for 7 days after being treated with different concentration of G-Rg1. Statistical comparisons of repeated multiple comparisons were carried out with Univariate Analysis; Statistical comparisons of multiple comparisons in the group of each time point were, respectively, carried out with Student's t-test. Values were represented as mean ± SEM. n = 3. (d) The MTT assay was described by Profile Plots.
Figure 4
Figure 4
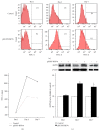
Efficiency of transfection of NSCs used pEGFP-C2-HSP70 vector. (a) Efficiency of transfection was confirmed by visualizing EGFP expression after transfection in 1, 3, and 7 days. Flow cytometry was performed to detect the fluorescence intensity of EGFP in Day 1, Day 3, and Day 7. (b) Fluorescence intensity of EGFP assessed by flow cytometry was described by Profile Plots. (c) Western Blot was performed to detect HSP70 protein after transfection in Day 1, Day 3, and Day 7. Statistical comparisons were carried out with Independent t-test. Values were presented as mean ± SEM. * P < 0.05 versus control in Day 3; * P < 0.05 versus control in Day 7.
Figure 5
Figure 5
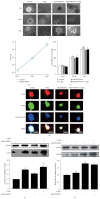
Properties of NSCs after being transfected with pEGFP-HSP70 or/and treated with G-Rg1. (a) Representative images were shown at 100x magnification to show some morphological changes of NSCs after being transfected with pEGFP-HSP70 or/and treated with G-Rg1 in Day 1, Day 3, and Day 7, such as neurospheres and branches. (b) The MTT assay showing the OD value of NSCs after being transfected with p EGFP-HSP70 in Day 1, Day 3, and Day 7. Cell viability was not significantly different between control and pEGFP-HSP70 groups at P > 0.05. Statistical comparisons were carried out with Independent t-test. Values were represented as mean ± SEM. n = 3. (c) The MTT assay showed the viability value of NSCs in Day 1, Day 3, and Day 7 after being transfected with p EGFP-HSP70 or/and treated with G-Rg1. * P < 0.05 versus media control in Day 3. ∗′ P < 0.05 versus G-Rg1 in Day 3. # P < 0.05 versus media control in Day 7. #′ P < 0.05 versus control in Day 7. Statistical comparisons of repeated multiple comparisons were carried out with Student's t-test. Mean ± SEM. n = 3. (d) Immunostaining with antibodies against the cholinergic neuron-specific ChAT (red), nuclei was counterstained with Hoechst 33342 (blue) and EGFP fluorescence was green. (e) And (f) Western Blot was, respectively, performed to detect HSP70 and ChAT expression in control, G-Rg1, pEGFP-HSP70 or/and treated with G-Rg1 groups in Day 1, Day 3, and Day 7. Statistical comparisons were carried out with Student's t-test. Values were presented as mean ± SEM. * P < 0.05 versus C. n = 3.
Figure 6
Figure 6
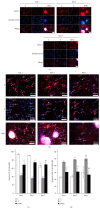
Neuronal cell count and cell apoptosis. (a) Representative images of immunofluorescence were shown at 200x magnification to demonstrate the MAP-2 positive neurons in cotreatment on t-BHP-induced injury. TRITC (red)-labeled MAP-2 immunoreactions were shown in the cytoplasm; Nuclei was stained with Hoechst 33342 (blue) which as a specific marker of apoptosis was applied to determine chromatin condensation. Cells with intensely stained, condensed, or fragmented nuclei were scored as apoptotic. The arrowheads indicate remarkable apoptotic cells. C: media control; T: 10 μmol/L t-BHP; NHG: cocultured with NSCs which were transfected with pEGFP-HSP70 and G-Rg1 which dissolved in 10 μmol/L t-BHP. (b) The merged images of (a) pictures were magnified which were convenient for observation. (c), (d) Neuronal cell count and the percentage of apoptotic neurons were scored in Day 1, Day 3, and Day 7 for ascertaining the time points of study. Statistical comparisons of repeated multiple comparisons were carried out with Student's t-test; statistical comparisons of multiple comparisons in the group of each time point were, respectively, carried out with Student's t-test. Mean ± SEM. * P < 0.05 versus C in Day 1, # P < 0.05 versus C in Day 3, & P < 0.05 versus C in Day 7, ∗′ P < 0.05 versus T in Day 1, #′ P < 0.05 versus T in Day 3, and &′ P < 0.05 versus T in Day 7. n = 9.
Figure 7
Figure 7
Effects of cotreatment on the damage cortex neurons. Neurons were grouped as C: media control; T: 10 μmol/L t-BHP; G: treated with G-Rg1 which dissolved into 10 μmol/L t-BHP; N: cocultured with NSCs in 10 μmol/L t-BHP; NG: cocultured with NSCs and treated with G-Rg1 which dissolved into 10 μmol/L t-BHP; NH: cocultured with overexpression of HSP70 NSCs in 10 μmol/L t-BHP NHG: cocultured with overexpression of HSP70 NSCs and G-Rg1 which dissolved in 10 μmol/L t-BHP. (a) Morphological changes of neurons, such as spines, filaments, and synapsis were pictured under SEM in C, T, G, N, NG, NH, and NHG at Day 3. (b) Western blot was performed to detect cleaved-Caspase-3 expression. Statistical comparisons were carried out with Student's t-test. Mean ± SEM. * P < 0.05 versus C group, # P < 0.05 versus T group, and & P < 0.05 versus monotherapy group. n = 3. (c) Representative images of immunofluorescence were shown at 200x magnification to demonstrate the MAP-2 positive cells; neurite lengths and number of neurites of each neuron were measured by Imaris software. (d), (e) The value of neurite lengths and number of neuritis were expressed as the mean ± SEM. Statistical comparisons were carried out with Student's t-test. * P < 0.05 versus C group, # P < 0.05 versus C group, and & P < 0.05 versus monotherapy group. n = 25. (f) Western blot was performed to detect NeuN and GFAP expression. (g), (h) The ratios of NeuN/β-actin and GFAP/β-actin were compared with C which had been standardized to 1. Statistical comparisons were carried out with Student's t-test. Values were presented as mean ± SEM. * P < 0.05 versus C group, # P < 0.05 versus T group, and & P < 0.05 versus monotherapy group (T, G, N, NG, and NH). n = 3. (i) Representative images of immunofluorescence were shown at 400x magnification to demonstrate the synaptic connection which were marked with antibody synaptophysin. (j), (k), and (l) Western blot was performed to detect HSP70, synaptophysin, and ChAT expression. Statistical comparisons were carried out with Student's t-test. Mean ± SEM. * P < 0.05 versus C group, # P < 0.05 versus T group, and & P < 0.05 versus monotherapy group. n = 3.

References

    1. Jönsson L., Wimo A. The cost of dementia in Europe: a review of the evidence, and methodological considerations. PharmacoEconomics. 2009;27(5):391–403. doi: 10.2165/00019053-200927050-00004. - DOI - PubMed
    1. López Ó. L., DeKosky S. T. Neuropathology of Alzheimer's disease and mild cognitive impairment. Revista de Neurologia. 2003;37(2):155–163. - PubMed
    1. Wright A. F. Neurogenetics II: complex disorders. Journal of Neurology, Neurosurgery and Psychiatry. 2005;76(5):623–631. doi: 10.1136/jnnp.2004.047704. - DOI - PMC - PubMed
    1. Zhang W., Wang P.-J., Sha H.-Y., Ni J., Li M.-H., Gu G.-J. Neural stem cell transplants improve cognitive function without altering amyloid pathology in an APP/PS1 double transgenic model of Alzheimer's disease. Molecular Neurobiology. 2014;50(2):423–437. doi: 10.1007/s12035-014-8640-x. - DOI - PubMed
    1. Blurton-Jones M., Kitazawa M., Martinez-Coria H., et al. Neural stem cells improve cognition via BDNF in a transgenic model of Alzheimer disease. Proceedings of the National Academy of Sciences of the United States of America. 2009;106(32):13594–13599. doi: 10.1073/pnas.0901402106. - DOI - PMC - PubMed

Publication types

LinkOut - more resources