. 2014 Dec 18:6:ecurrents.outbreaks.98d2f8f3382d84f390736cd5f5fe133c.
doi: 10.1371/currents.outbreaks.98d2f8f3382d84f390736cd5f5fe133c.

Estimation of MERS-Coronavirus Reproductive Number and Case Fatality Rate for the Spring 2014 Saudi Arabia Outbreak: Insights from Publicly Available Data

Affiliations

Estimation of MERS-Coronavirus Reproductive Number and Case Fatality Rate for the Spring 2014 Saudi Arabia Outbreak: Insights from Publicly Available Data

Maimuna S Majumder et al. PLoS Curr. .

Abstract

Background: The Middle East Respiratory Syndrome Coronavirus (MERS-CoV) was initially recognized as a source of severe respiratory illness and renal failure in 2012. Prior to 2014, MERS-CoV was mostly associated with sporadic cases of human illness, of presumed zoonotic origin, though chains of person-to-person transmission in the healthcare setting were reported. In spring 2014, large healthcare-associated outbreaks of MERS-CoV infection occurred in Jeddah and Riyadh, Kingdom of Saudi Arabia. To date the epidemiological information published by public health investigators in affected jurisdictions has been relatively limited. However, it is important that the global public health community have access to information on the basic epidemiological features of the outbreak to date, including the basic reproduction number (R0) and best estimates of case-fatality rates (CFR). We sought to address these gaps using a publicly available line listing of MERS-CoV cases.

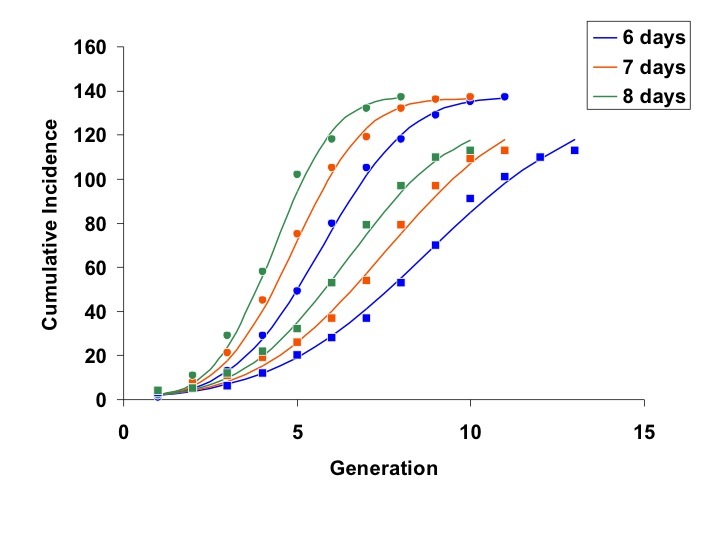
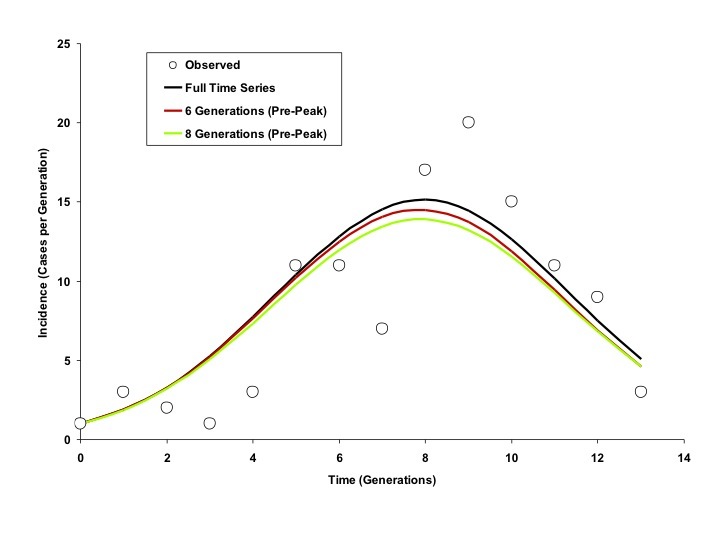
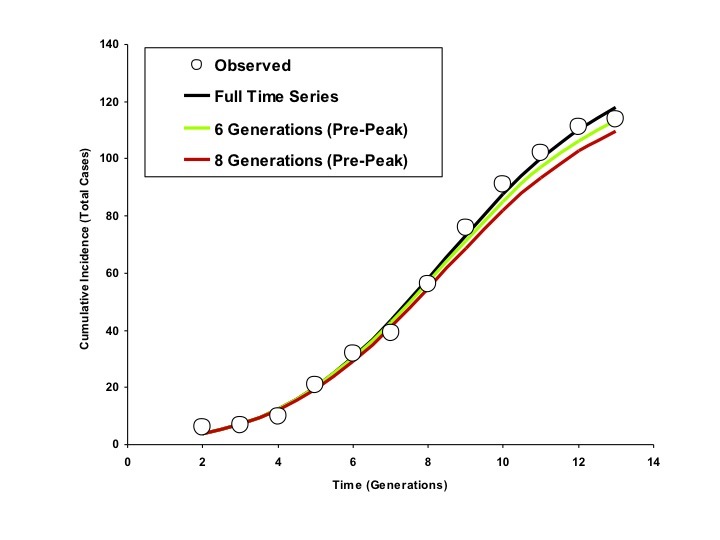
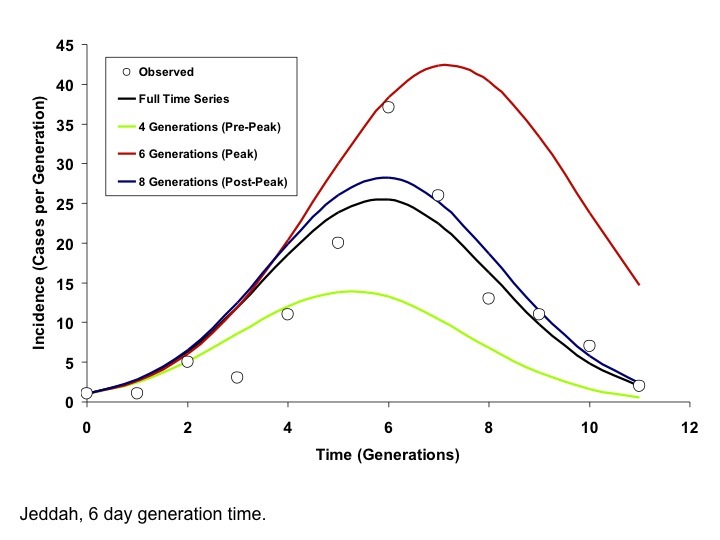
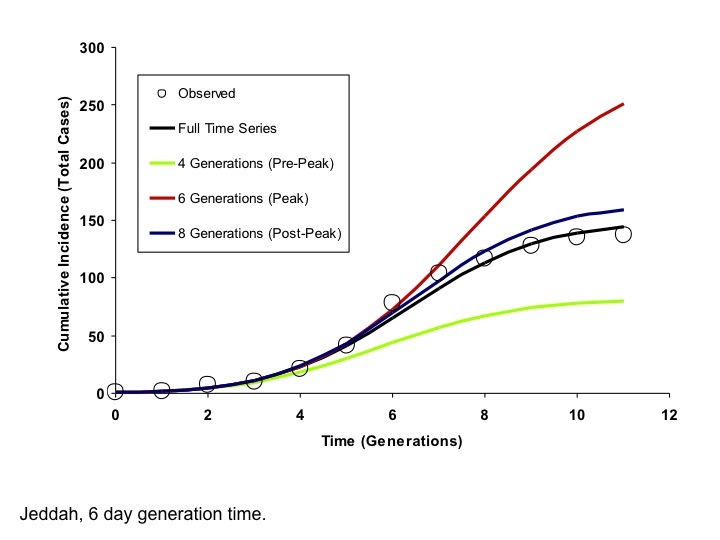
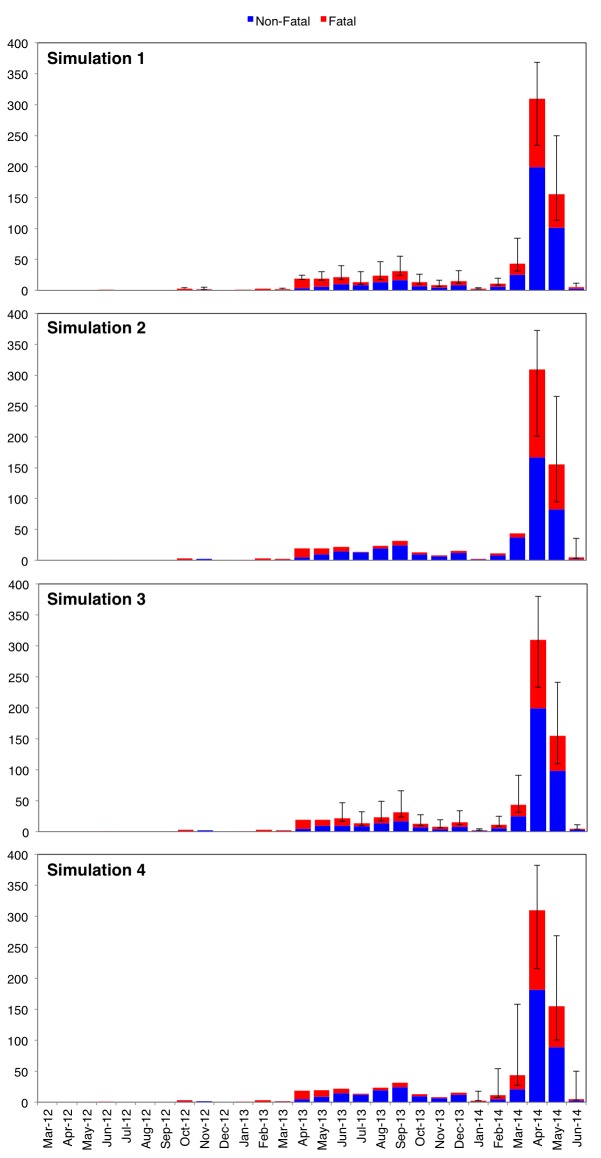
Methods: R0 was estimated using the incidence decay with exponential adjustment ("IDEA") method, while period-specific case fatality rates that incorporated non-attributed death data were estimated using Monte Carlo simulation.

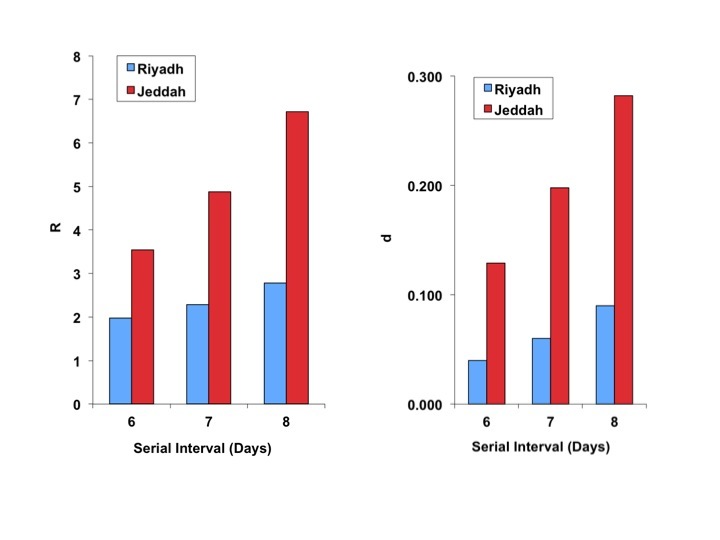
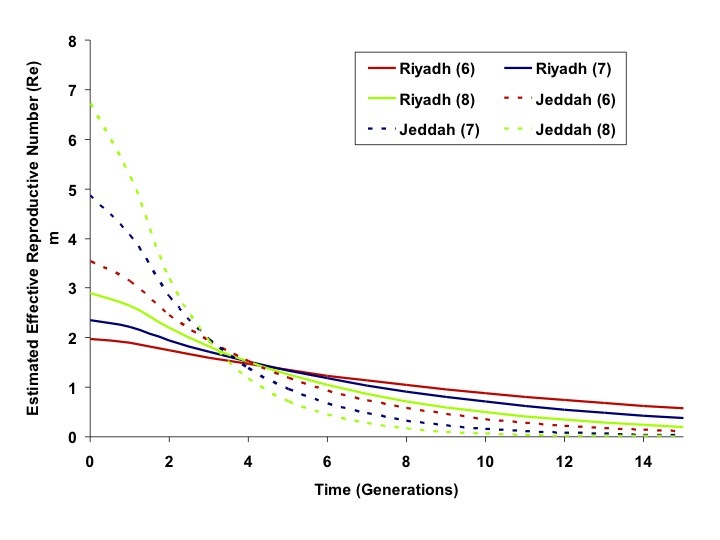
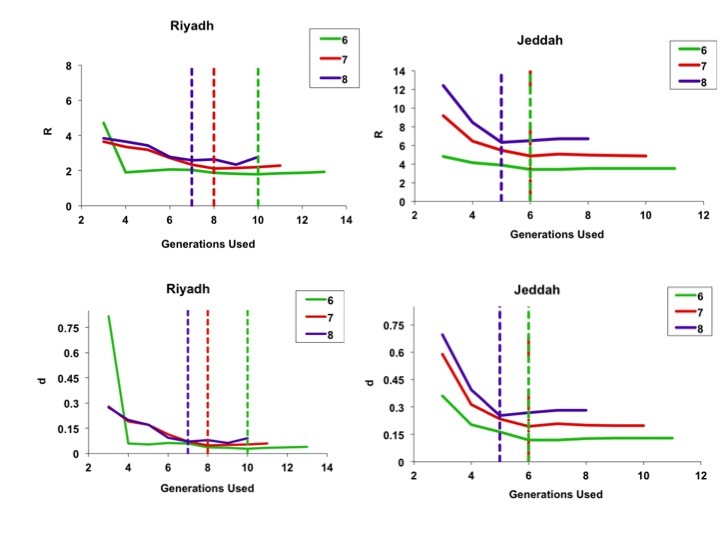
Results: 707 cases were available for evaluation. 52% of cases were identified as primary, with the rest being secondary. IDEA model fits suggested a higher R0 in Jeddah (3.5-6.7) than in Riyadh (2.0-2.8); control parameters suggested more rapid reduction in transmission in the former city than the latter. The model accurately projected final size and end date of the Riyadh outbreak based on information available prior to the outbreak peak; for Jeddah, these projections were possible once the outbreak peaked. Overall case-fatality was 40%; depending on the timing of 171 deaths unlinked to case data, outbreak CFR could be higher, lower, or equivalent to pre-outbreak CFR.

Conclusions: Notwithstanding imperfect data, inferences about MERS-CoV epidemiology important for public health preparedness are possible using publicly available data sources. The R0 estimated in Riyadh appears similar to that seen for SARS-CoV, but CFR appears higher, and indirect evidence suggests control activities ended these outbreaks. These data suggest this disease should be regarded with equal or greater concern than the related SARS-CoV.


Figures

Concordance between model fits (curves) and cumulative incidence data for Jeddah (circles) and Riyadh (squares).
Generations can be converted to calendar dates as follows: the final day of each generation may be estimated as ((outbreak start date – 1) + generation x serial interval). Start date is March 5, 2014 for Riyadh and March 16, 2014 for Jeddah, such that (for example) the final day of generation 2 for Riyadh, using a 6-day serial interval, is (March 4, 2014 + 2 x 6 = March 16, 2014).
Best fit estimates of reproductive number ((<i>R</i>), left-side panel), and the model “discount factor” ((<i>d</i>), right-sided panel), for Riyadh (blue bars) and Jeddah (red bars).
Best fit estimates of reproductive number ((R), left-side panel), and the model “discount factor” ((d), right-sided panel), for Riyadh (blue bars) and Jeddah (red bars).
As expected, R estimates increase with increasing serial interval for both cities, though the increase is more marked for Jeddah. Both R and d are higher for Jeddah, denoting a more explosive, but more aggressively controlled, outbreak.
Effective Reproductive Numbers Over Time, Riyadh and Jeddah Outbreaks
Estimated effective reproductive numbers (Re) for outbreaks in Riyadh (solid curves) and Jeddah (dashed curves) based on 6, 7 or 8 day generation times (red, blue, and green, respectively). Re is initially higher in Jeddah but decreases more rapidly than in Riyadh.
Best-fit estimates for model parameters R (top figures) and d (bottom figures), using sequentially increasing numbers of outbreak generations for both Riyadh (left-side panels) and Jeddah (right-side panels).
Color coding denotes 6-, 7-, or 8-day serial intervals as identified in figure legends. For the less explosive Riyadh outbreak, parameter estimates appear to stabilize rapidly when fits used only a few initial outbreak generations, whereas the more explosive Jeddah outbreak parameters appeared to stabilize once data up to and including the outbreak peak were included. Dashed lines denote the timing (by generation) of the outbreak peaks.
Modelled Incidence Curves based on Models Fit to Varying Numbers of Generations, Riyadh (6 Day Generation Time)
Circles represent observed per-generation incidence. The dark blue curve is generated using an IDEA model fit to the entire time series. The red and green curves represent IDEA models fit using only 6 or 8 outbreak generations; in other words, these are outbreak projections based on case counts prior to the outbreak peak. Curves generated using pre-peak data are minimally different from those generated using the full time series.
Modelled Cumulative Incidence Curves based on Models Fit to Varying Numbers of Generations, Riyadh (6 Day Generation Time)
Circles represent observed cumulative incidence by generation. The dark blue curve is generated using an IDEA model fit to the entire time series. The red and green curves represent IDEA models fit using only 6 or 8 outbreak generations (cumulative incidence prior to the outbreak peak). Curves generated using pre-peak data are minimally different from those generated using the full time series.
Modelled Incidence Curves based on Models Fit to Varying Numbers of Generations, Jeddah (6 Day Generation Time)
Circles represent observed per-generation incidence. The dark blue curve is generated using an IDEA model fit to the entire time series. The red and green curves represent IDEA models fit using only 4 or 6 outbreak generations; prior to or at the outbreak peak, respectively. The black curve is generated by fitting the model to 9 generations of data, encompassing the outbreak peak and initial decline. The post-peak curve and full time series curve are almost identical, but the full contour of the outbreak is difficult to project based on earlier data.
Modelled Cumulative Incidence Curves based on Models Fit to Varying Numbers of Generations, Jeddah (6 Day Generation Time)
Circles represent observed cumulative incidence by generation. The dark blue curve is generated using an IDEA model fit to the entire time series. The red and green curves represent IDEA models fit using only 4 or 6 outbreak generations, prior to or at the outbreak peak, respectively. The black curve is generated by fitting the model to 9 generations of data, encompassing the outbreak peak and initial decline. The post-peak curve and full time series curve are almost identical, but the full contour of the outbreak is difficult to project based on earlier data.
Stacked epicurves of non-fatal and fatal cases for Simulations 1 – 4.
Each simulation was run N = 1000 times. Colored bars represent mean values for fatal (red) and non-fatal (blue) cases by month over 1000 runs. Error bars indicate minimum and maximum values for fatal cases by month over 1000 runs. In all 4 simulations, 171 non-attributable deaths were randomly distributed across different periods of time: all months (March 2012 – June 2014) for Simulation 1; only outbreak months (April 2014 – June 2014); only months from the year preceding the outbreak (June 2013 – June 2014); and only months in 2014 (January 2014 – June 2014).

Similar articles

Cited by

References

    1. ProMED Mail, PRO/EDR> Novel coronavirus - Saudi Arabia: human isolate. ProMED-mail 2012; Sept 20: 20120920.1302733. http://www.promedmail.org. Accessed June 12, 2013.
    1. Zaki AM, van Boheemen S, Bestebroer TM, Osterhaus AD, Fouchier RA. Isolation of a novel coronavirus from a man with pneumonia in Saudi Arabia. N Engl J Med. 2012 Nov 8;367(19):1814-20. PubMed PMID:23075143. - PubMed
    1. ProMED Mail, PRO/EDR> Novel coronavirus - Saudi Arabia (02): additional cases, RFI. ProMED-mail 2012; Sept 23: 20120923.1305931. http://www.promedmail.org. Bermingham A, Chand M, Brown C, et al. Severe respiratory illness caused by a novel coronavirus, in a patient transferred to the United Kingdom from the Middle East, Euro Surveill, 2012. 17(40): p. 20290. - PubMed
    1. Breban R, Riou J, Fontanet A. Interhuman transmissibility of Middle East respiratory syndrome coronavirus: estimation of pandemic risk. Lancet. 2013 Aug 24;382(9893):694-9. PubMed PMID:23831141. - PMC - PubMed
    1. Fisman DN, Leung GM, Lipsitch M. Nuanced risk assessment for emerging infectious diseases. Lancet. 2014 Jan 18;383(9913):189-90. PubMed PMID:24439726. - PMC - PubMed

LinkOut - more resources