. 2015 Jan 21:7:ecurrents.outbreaks.8b55f4bad99ac5c5db3663e916803261.
doi: 10.1371/currents.outbreaks.8b55f4bad99ac5c5db3663e916803261.

The Western Africa ebola virus disease epidemic exhibits both global exponential and local polynomial growth rates

Affiliations

The Western Africa ebola virus disease epidemic exhibits both global exponential and local polynomial growth rates

Gerardo Chowell et al. PLoS Curr. .

Abstract

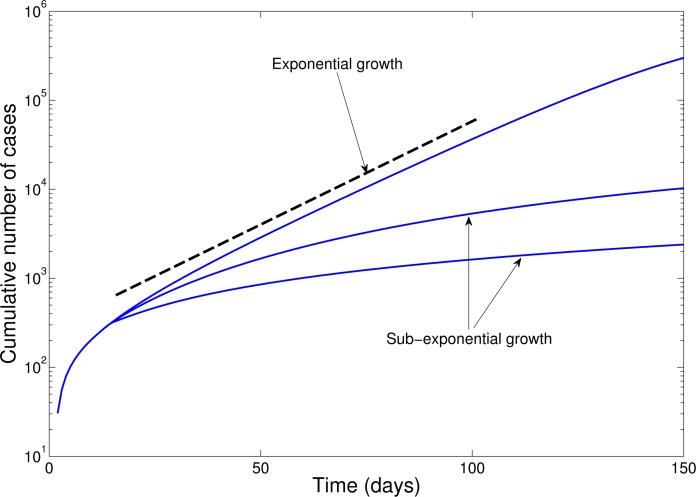
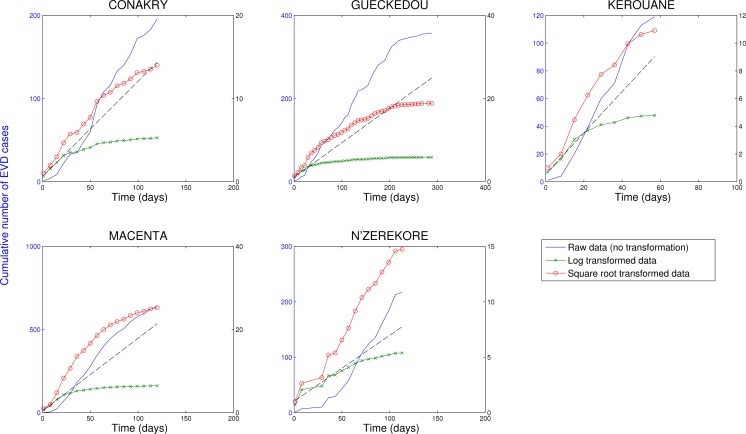
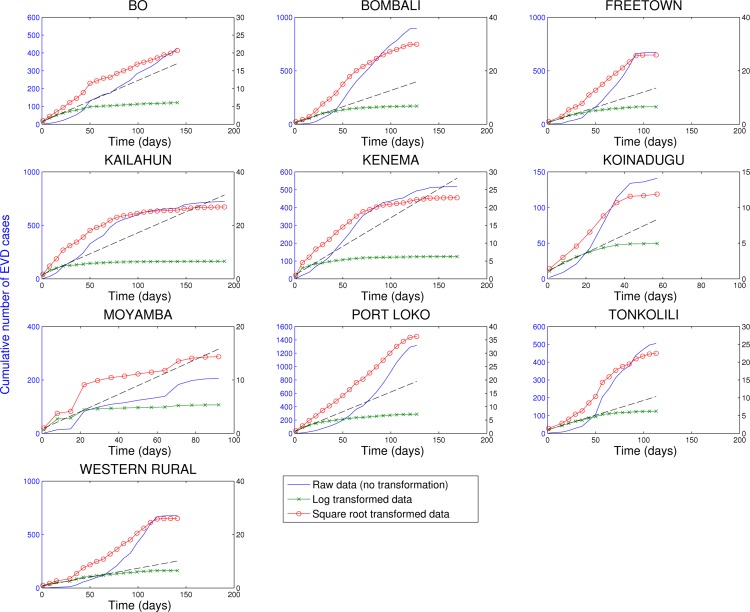
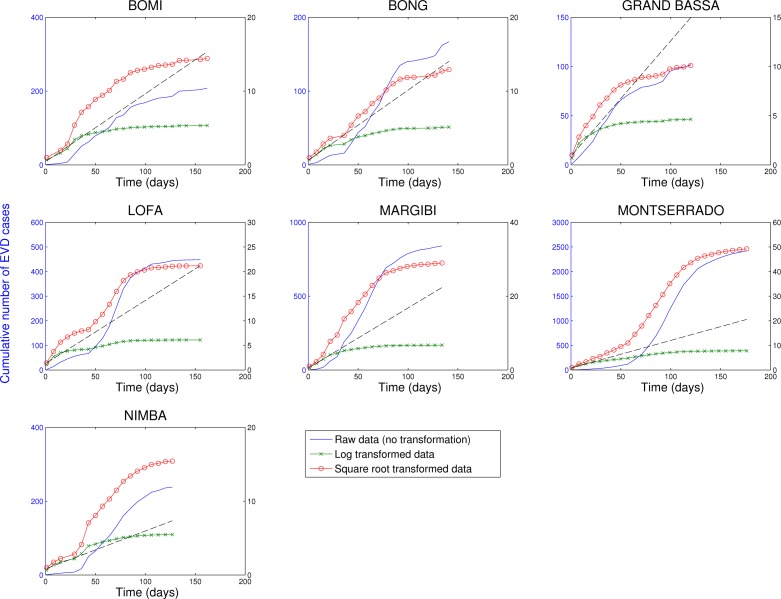
Background: While many infectious disease epidemics are initially characterized by an exponential growth in time, we show that district-level Ebola virus disease (EVD) outbreaks in West Africa follow slower polynomial-based growth kinetics over several generations of the disease.

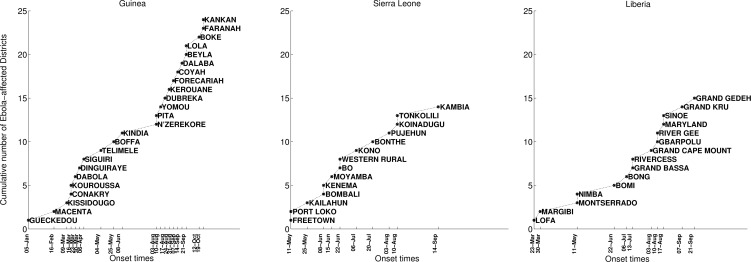
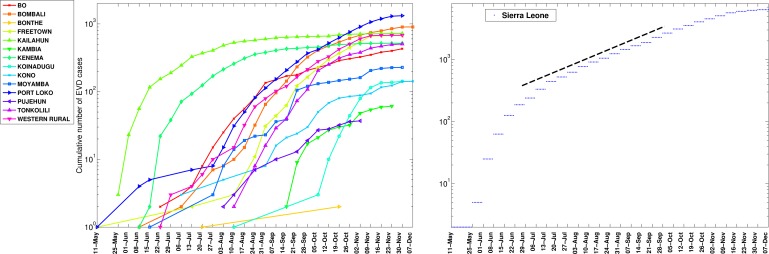
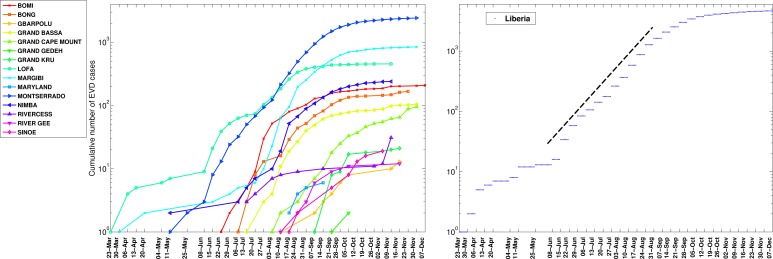
Methods: We analyzed epidemic growth patterns at three different spatial scales (regional, national, and subnational) of the Ebola virus disease epidemic in Guinea, Sierra Leone and Liberia by compiling publicly available weekly time series of reported EVD case numbers from the patient database available from the World Health Organization website for the period 05-Jan to 17-Dec 2014.

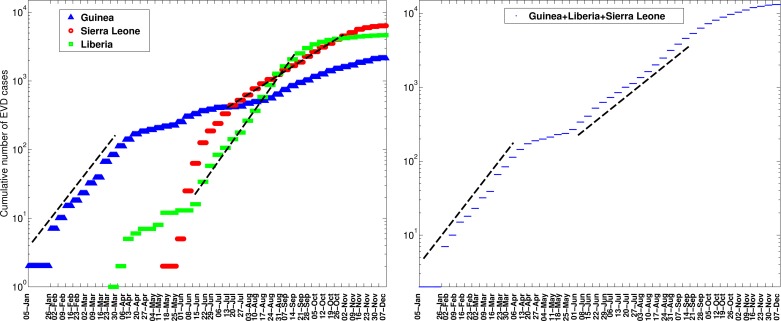
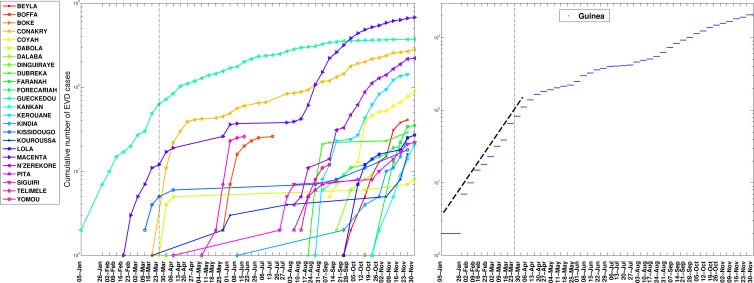
Results: We found significant differences in the growth patterns of EVD cases at the scale of the country, district, and other subnational administrative divisions. The national cumulative curves of EVD cases in Guinea, Sierra Leone, and Liberia show periods of approximate exponential growth. In contrast, local epidemics are asynchronous and exhibit slow growth patterns during 3 or more EVD generations, which can be better approximated by a polynomial than an exponential function.

Conclusions: The slower than expected growth pattern of local EVD outbreaks could result from a variety of factors, including behavior changes, success of control interventions, or intrinsic features of the disease such as a high level of clustering. Quantifying the contribution of each of these factors could help refine estimates of final epidemic size and the relative impact of different mitigation efforts in current and future EVD outbreaks.

Keywords: ebola.


Figures

Epidemic curves in semi-logarithmic scale illustrate the exponential growth and sub-exponential growth patterns.
In semi-logarithmic scale, exponential growth is evident if a straight line fits well several consecutive disease generations of the epidemic curve whereas a strong curvature in the epidemic curve would be indicative of sub-exponential growth.
Timing of EVD outbreak onset across districts of Guinea, Sierra Leone, and Liberia.
On average a new district was EVD-infected every ~ 13days (SD=14.05) in Guinea, ~10.2 days (SD=11.3) in Sierra Leone, and 13 days in Liberia (SD=15.5).
The cumulative number of EVD cases (in log scale) in Guinea, Sierra Leone, and Liberia and the aggregate curve for all of West Africa.
The cumulative number of EVD cases initially grew exponentially based on aggregate data for West Africa as a whole, a pattern that was driven by exponential growth dynamics in Guinea where the epidemic began in December 2013. The aggregate data for West Africa from early June to about mid-September 2014 can also be characterized by a second exponential growth phase, albeit with a lower intrinsic growth rate than the first. At the national level, Liberia experienced a small wave of infections during late March to early June 2014, a pattern that was followed by exponential growth until about mid-September 2014. For the aggregate data for Sierra Leone, exponential growth describes well the epidemic data from mid-July to late October 2014.
The cumulative number of EVD cases on a semi-logarithmic plot by district and in all of Guinea.
The aggregated epidemic curve for Guinea initially followed an exponential growth pattern as indicated by the initial linear trend in the log-transformed epidemic curve and highlighted by the black solid line. The district level curves are largely characterized by sub-exponential growth, shown by the strong curvature in the curves, which can be well fitted using a polynomial curve. The vertical dashed lines indicate the timing of notification of the outbreak to the World Health Organization.
The cumulative number of EVD cases on a semi-logarithmic plot by district and in all of Sierra Leone.
The district level curves are largely characterized by sub-exponential growth, shown by the strong curvature in the curves, which can be well fitted using a polynomial curve.
The cumulative number of EVD cases on a semi-logarithmic plot by district and in all of Liberia.
The district level curves are largely characterized by sub-exponential growth, shown by the strong curvature in the curves, which can be well fitted using a polynomial curve.
Cumulative number of EVD cases in districts of Guinea reporting over 100 cases.
Three different transformations of the epidemic data are shown: 1) raw data (no transformation, left y-scale), 2) log-transformation (right y-scale), and 3) square-root transformation (right y-scale). Epidemic curves show slower, sub-exponential, growth patterns, as semi-logarithmic plots display a strong curvature during 3 or more EVD generations that can be better fitted by linear or quadratic growth. Local epidemic curves quickly depart from the expected linear trend in log-transformed data. The dashed line, shown as a reference, was fitted to the first 4 weeks of the log-transformed data.
Cumulative number of EVD cases in districts of Sierra Leone reporting over 100 cases.
Three different transformations of the epidemic data are shown: 1) raw data (no transformation, left y-scale), 2) log-transformation (right y-scale), and 3) square-root transformation (right y-scale). Epidemic curves show slower, sub-exponential, growth patterns, as semi-logarithmic plots display a strong curvature during 3 or more EVD generations that can be better fitted by linear or quadratic growth. Local epidemic curves quickly depart from the expected linear trend in log-transformed data. The dashed line, shown as a reference, was fitted to the first 4 weeks of the log-transformed data.
Cumulative number of EVD cases in districts of Liberia reporting over 100 cases.
Three different transformations of the epidemic data are shown: 1) raw data (no transformation, left y-scale), 2) log-transformation (right y-scale), and 3) square-root transformation (right y-scale). Epidemic curves show slower, sub-exponential, growth patterns, as semi-logarithmic plots display a strong curvature during 3 or more EVD generations that can be better fitted by linear or quadratic growth. Local epidemic curves quickly depart from the expected linear trend in log-transformed data. The dashed line, shown as a reference, was fitted to the first 4 weeks of the log-transformed data.

References

    1. (2014) Ebola virus disease update - West Africa, 21 November 2014.
    1. Gire SK, Goba A, Andersen KG, Sealfon RS, Park DJ, Kanneh L, Jalloh S, Momoh M, Fullah M, Dudas G, Wohl S, Moses LM, Yozwiak NL, Winnicki S, Matranga CB, Malboeuf CM, Qu J, Gladden AD, Schaffner SF, Yang X, Jiang PP, Nekoui M, Colubri A, Coomber MR, Fonnie M, Moigboi A, Gbakie M, Kamara FK, Tucker V, Konuwa E, Saffa S, Sellu J, Jalloh AA, Kovoma A, Koninga J, Mustapha I, Kargbo K, Foday M, Yillah M, Kanneh F, Robert W, Massally JL, Chapman SB, Bochicchio J, Murphy C, Nusbaum C, Young S, Birren BW, Grant DS, Scheiffelin JS, Lander ES, Happi C, Gevao SM, Gnirke A, Rambaut A, Garry RF, Khan SH, Sabeti PC. Genomic surveillance elucidates Ebola virus origin and transmission during the 2014 outbreak. Science. 2014 Sep 12;345(6202):1369-72. PubMed PMID:25214632. - PMC - PubMed
    1. Del Rio C, Mehta AK, Lyon GM 3rd, Guarner J. Ebola hemorrhagic Fever in 2014: the tale of an evolving epidemic. Ann Intern Med. 2014 Nov 18;161(10):746-8. PubMed PMID:25133433. - PubMed
    1. Althaus CL. Estimating the Reproduction Number of Ebola Virus (EBOV) During the 2014 Outbreak in West Africa. PLOS Currents Outbreaks. 2014 Sep 2. Edition 1. doi: 10.1371/currents.outbreaks.91afb5e0f279e7f29e7056095255b288. - PMC - PubMed
    1. Fisman D, Khoo E, Tuite A. Early Epidemic Dynamics of the West African 2014 Ebola Outbreak: Estimates Derived with a Simple Two-Parameter Model. PLOS Currents Outbreaks. 2014 Sep 8. Edition 1. doi: 10.1371/currents.outbreaks.89c0d3783f36958d96ebbae97348d571. - PMC - PubMed