. 2014 Dec 18;4(2):118-31.
doi: 10.1016/j.molmet.2014.12.008. eCollection 2015 Feb.

SIRT1 enhances glucose tolerance by potentiating brown adipose tissue function

Affiliations

SIRT1 enhances glucose tolerance by potentiating brown adipose tissue function

Marie Boutant et al. Mol Metab. .

Abstract

Objective: SIRT1 has been proposed to be a key signaling node linking changes in energy metabolism to transcriptional adaptations. Although SIRT1 overexpression is protective against diverse metabolic complications, especially in response to high-fat diets, studies aiming to understand the etiology of such benefits are scarce. Here, we aimed to identify the key tissues and mechanisms implicated in the beneficial effects of SIRT1 on glucose homeostasis.

Methods: We have used a mouse model of moderate SIRT1 overexpression, under the control of its natural promoter, to evaluate glucose homeostasis and thoroughly characterize how different tissues could influence insulin sensitivity.

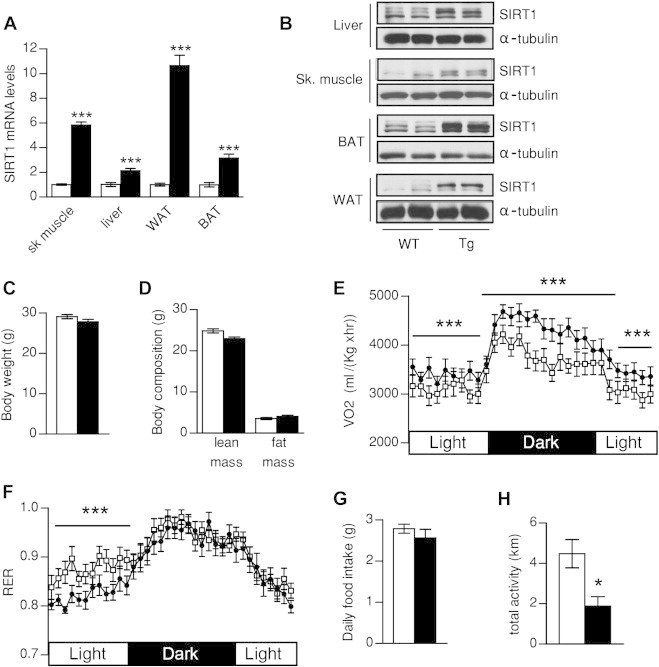
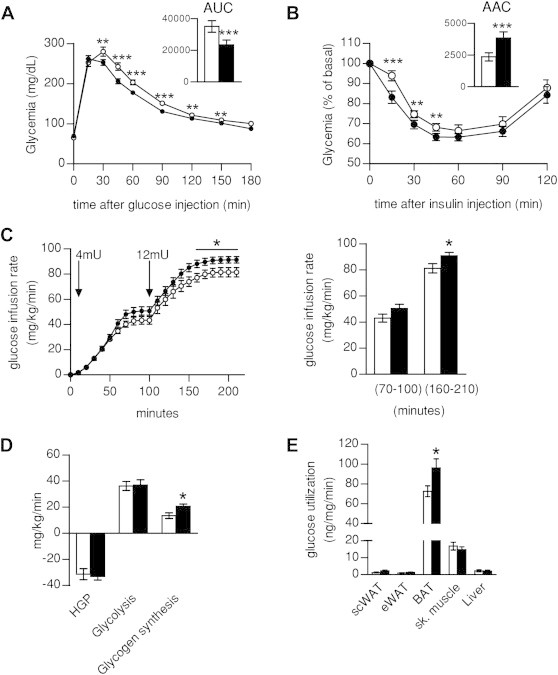
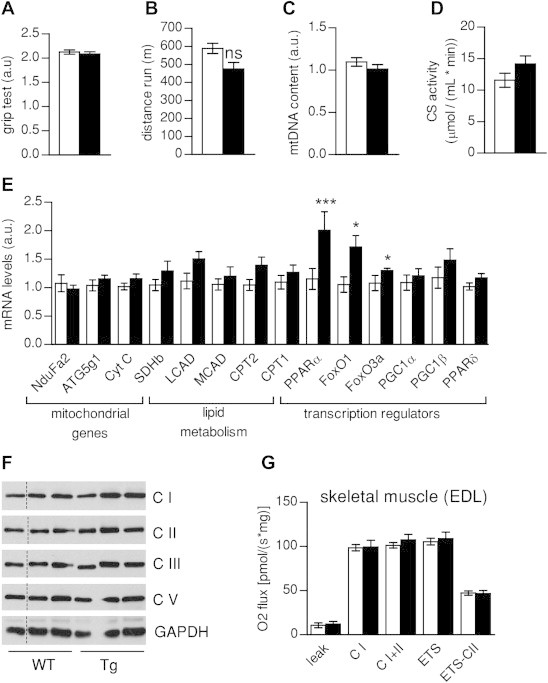
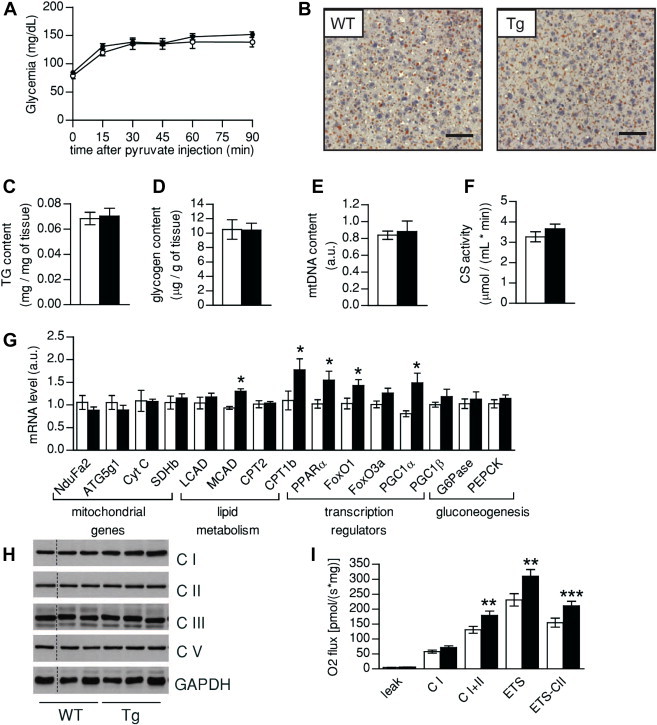
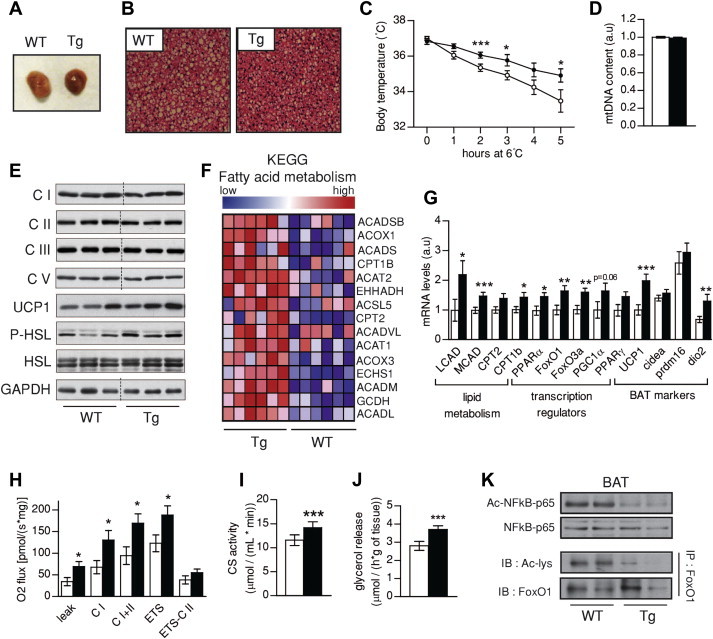
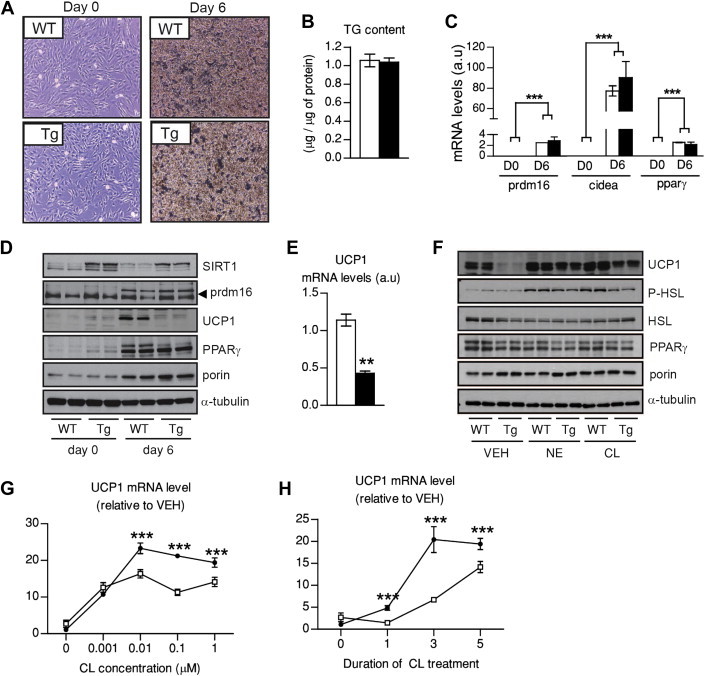
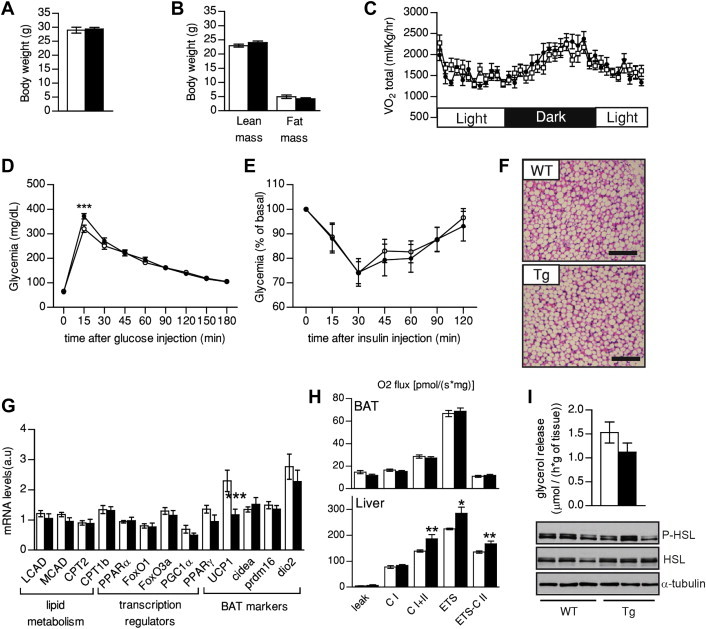
Results: Mice with moderate overexpression of SIRT1 exhibit better glucose tolerance and insulin sensitivity even on a low fat diet. Euglycemic-hyperinsulinemic clamps and in-depth tissue analyses revealed that enhanced insulin sensitivity was achieved through a higher brown adipose tissue activity and was fully reversed by housing the mice at thermoneutrality. SIRT1 did not influence brown adipocyte differentiation, but dramatically enhanced the metabolic transcriptional responses to β3-adrenergic stimuli in differentiated adipocytes.

Conclusions: Our work demonstrates that SIRT1 improves glucose homeostasis by enhancing BAT function. This is not consequent to an alteration in the brown adipocyte differentiation process, but as a result of potentiating the response to β3-adrenergic stimuli.

Keywords: Brown adipose tissue; Energy homeostasis; Insulin resistance; SIRT1.


Figures

Figure 1
Figure 1
Evaluation of energy homeostasis in SIRT1Tg/Tg mice. (A, B) 20 week-old wild-type (WT) and SIRT1Tg/Tg (Tg) mice were sacrificed to measure (A) the mRNA and (B) protein levels of SIRT1 in the indicated tissues. (C, D) Three months old WT and Tg mice were fed ad libitum with a low fat diet and (C) body weight and (D) body composition were measured through EchoMRI. (E) Oxygen consumption (VO2) and (F) Respiratory exchange ratio (RER) were measured by indirect calorimetry using a comprehensive laboratory animal monitoring system (CLAMS). (G) Food intake a measured during the indirect calorimetry tests. (H) Voluntary wheel running activity was measured in 20-week-old WT and Tg mice. All values are presented as mean ± SEM of n = 10–14 mice for each genotype. *indicates statistical significant difference between WT (white bars and circles) and Tg mice (black bars and circles) at P < 0.05.
Figure 2
Figure 2
SIRT1 overexpression improves insulin sensitivity through higher BAT glucose uptake. (A) An intraperitoneal glucose tolerance test and (B) an introperitoneal insulin tolerance test were performed on 4-month-old WT and Tg mice. Area under the curve (AUC) or area above the curve (AAC) calculations are present on the top right of each glucose excursion. (C–E) Hyperinsulinemic-euglycemic clamp was performed on WT and SIRT1Tg/Tg mice fed on low fat diet. Glucose Infusion Rate (GIR) measured at two different levels of insulin infusion (4 and 12 mU/kg/min) (C), glucose fluxes (D) and Glucose uptake in different tissues (inguinal sub-cutaneous and epididymal WAT, BAT, vastus lateralis skeletal muscle and liver) (E) are represented. All values are presented as mean ± SEM of n = 12–14 mice for each genotype. * indicates statistical significant difference between WT (white bars and circles) and Tg mice (black bars and circles) at P < 0.05.
Figure 3
Figure 3
Muscle function is not affected by SIRT1 transgenesis. (A) Muscle force was evaluated in wild type (WT) and SIRT1Tg/Tg (Tg) mice through a grip test. (B) Running distance was evaluated by submitting mice to an endurance treadmill test. (C) Mitochondrial DNA content in gastrocnemius muscle was measured and normalized to nuclear DNA copy number. (D) Citrate synthase activity was measured in quadriceps muscle. (E) Total mRNA was extracted from gastrocnemius muscles and used for qPCR analysis of the markers indicated. (F) Protein analysis of mitochondrial markers in total homogenates of quadriceps muscle (thin black lines on gels are used for lanes that were run on the same gel but were non-contiguous). (G) Oxidative phosphorylation and electron transfer system capacity in permeabilitzed EDL muscle fibers of WT and Tg mice. All values are presented as mean ± SEM of n = 8–10 mice for each genotype. * indicates statistical significant difference between WT (white bars and circles) and Tg mice (black bars and circles) at P < 0.05.
Figure 4
Figure 4
Hepatic function is not critically affected by SIRT1 transgenesis. (A) Blood glucose curves after a pyruvate (2 g/kg) challenge. (B) Oil Red'O staining in WT and Tg livers after an overnight fast (bar = 600 μm) (C, D) Hepatic triglyceride (C) and glycogen (D) content was measured after an overnight fast. (E) Mitochondrial DNA content was measured and normalized to nuclear DNA copy number. (F) Citrate synthase activity in liver. (G) Total liver mRNA was extracted and used for qPCR analysis of the markers indicated. (H) Protein analysis of mitochondrial markers in total liver homogenates (thin black lines on gels are used for lanes that were run on the same gel but were non-contiguous). (I) Oxidative phosphorylation and electron transfer system capacity in liver homogenates of WT and Tg mice. All values are presented as mean ± SEM of n = 8–10 mice for each genotype. * indicates statistical significant difference between WT (white bars and circles) and Tg mice (black bars and circles) at P < 0.05.
Figure 5
Figure 5
Brown adipose function is improved in SIRT1 transgenic mice. (A) Pictures of brown adipose tissue (BAT) from WT and Tg mice. (B) Hematoxylin and eosin stainings on the BAT of wild type (WT) and SIRT1Tg/Tg (Tg) mice (bar = 600 μm) (C) Brown adipose thermogenic function was evaluated by placing WT and Tg mice at 6 °C for 5 h. (D) Mitochondrial DNA content in BAT from WT and Tg mice, normalized to nuclear DNA copy number. (E) Western Blots were performed to evaluate the protein levels of proteins in BAT from WT and Tg mice (thin black lines on gels are used for lanes that were run on the same gel but were non-contiguous). (F) Gene set enrichment analyses of gene expression profiles of BAT from WT and Tg mice. (G) Total mRNA was extracted from BAT and used for qPCR analysis. (H) Oxidative phosphorylation and electron transfer system capacity in BAT. (I) Citrate synthase activity in BAT from WT and Tg mice. (J) Lipolysis was evaluated by measuring glycerol release in isolated BAT. (K) SIRT1 activity was tested in WT and Tg BAT using the acetylation status of RelA(p65) and FOXO1 as readout. All values are presented as mean ± SEM of n = 8–10 mice for each genotype. * indicates statistical significant difference between WT (white bars and circles) and Tg mice (black bars and circles) at P < 0.05.
Figure 6
Figure 6
SIRT1 transgenic adipocytes display an exhacerbated response to β3-adrenergic stimulation. Brown pre-adipocytes from wild-type (WT) and SIRT1 transgenic (Tg) mice were isolated and immortalized. (A) The morphology of immortalized brown adipocytes was evaluated before (day 0) and after (day 6) differentiation. (B) Total triglyceride content in differentiated brown adipocytes was evaluated. (C) Total mRNA levels were extracted from pre-adipocytes and differentiated adipocytes and used for qPCR analysis. (D) Total protein extracts were used to evaluate diverse differentiation markers in differentiated and undifferentiated adipocytes. (E) Ucp1 expression was measured in total mRNA extracts of differentiated brown adipocytes. (F) Differentiated WT and Tg adipocytes were stimulated with 1 μM of norepinephrine (NE) or 1 μM of CL316,243 (CL) during 5 h at 37 °C. Then, total proteins were extracted and used for western blot analysis. (G) WT and Tg brown adipocytes were treated with CL in a dose–response fashion for 5 h at 37 °C and then total mRNA was extracted to measure Ucp1 expression. (H) WT and Tg brown adipocytes were treated with 1 μM CL and incubated at 37 °C. Then, total mRNA was extracted at the times indicated to measure Ucp1 expression. All values are presented as mean ± SEM of at least n = 4 independent experiments, each of them run in triplicate. * indicates statistical significant difference between WT (white bars and circles) and Tg mice (black bars and circles) at P < 0.05.
Figure 7
Figure 7
Thermoneutrality blunts the insulin-sensitizing effect of SIRT1 transgenesis. Three months old WT and Tg mice were fed ad libitum with low fat diet and placed at thermoneutrality (30 °C) for one month before phenotyping. Then, (A) Body weight and (B) body composition were measured using Echo-MRI. (C) O2 consumption was evaluated using a comprehensive animal laboratory monitoring system; (D) An intraperitoneal glucose tolerance test and (E) an insulin tolerance test were performed on 4 months old mice. (F) Hematoxylin and eosin stainings of BAT from WT and Tg mice (bar = 600 μm). (G) Total mRNA was extracted from BAT and used for qPCR analysis. (H) Oxidative phosphorylation and electron transfer system capacity in BAT (top) and liver (bottom) of WT and Tg mice. (I) Lipolysis rates were evaluated by measuring glycerol release from BAT. At the bottom HSL and p-HSL levels were evaluated in total BAT protein extracts. All values are presented as mean ± SEM of n = 12 mice for each genotype. * indicates statistical significant difference between WT (white bars and circles) and Tg mice (black bars and circles) at P < 0.05.

References

    1. Canto C., Auwerx J. Targeting sirtuin 1 to improve metabolism: all you need is NAD(+)? Pharmacological Reviews. 2012;64(1):166–187. - PMC - PubMed
    1. Baur J.A., Ungvari Z., Minor R.K., Le Couteur D.G., de Cabo R. Are sirtuins viable targets for improving healthspan and lifespan? Nature Review Drug Discovery. 2012;11(6):443–461. - PMC - PubMed
    1. Pacholec M., Bleasdale J.E., Chrunyk B., Cunningham D., Flynn D., Garofalo R.S. SRT1720, SRT2183, SRT1460, and resveratrol are not direct activators of SIRT1. Journal of Biological Chemistry. 2010;285(11):8340–8351. - PMC - PubMed
    1. Pfluger P.T., Herranz D., Velasco-Miguel S., Serrano M., Tschop M.H. Sirt1 protects against high-fat diet-induced metabolic damage. Proceedings of the National Academy of Sciences of the United States of America. 2008;105(28):9793–9798. - PMC - PubMed
    1. Banks A.S., Kon N., Knight C., Matsumoto M., Gutierrez-Juarez R., Rossetti L. SirT1 gain of function increases energy efficiency and prevents diabetes in mice. Cell Metabolism. 2008;8(4):333–341. - PMC - PubMed