. 2014 Nov 29;4(2):132-43.
doi: 10.1016/j.molmet.2014.11.005. eCollection 2015 Feb.

Cardiomyocyte glucagon receptor signaling modulates outcomes in mice with experimental myocardial infarction

Affiliations

Cardiomyocyte glucagon receptor signaling modulates outcomes in mice with experimental myocardial infarction

Safina Ali et al. Mol Metab. .

Abstract

Objective: Glucagon is a hormone with metabolic actions that maintains normoglycemia during the fasting state. Strategies enabling either inhibition or activation of glucagon receptor (Gcgr) signaling are being explored for the treatment of diabetes or obesity. However, the cardiovascular consequences of manipulating glucagon action are poorly understood.

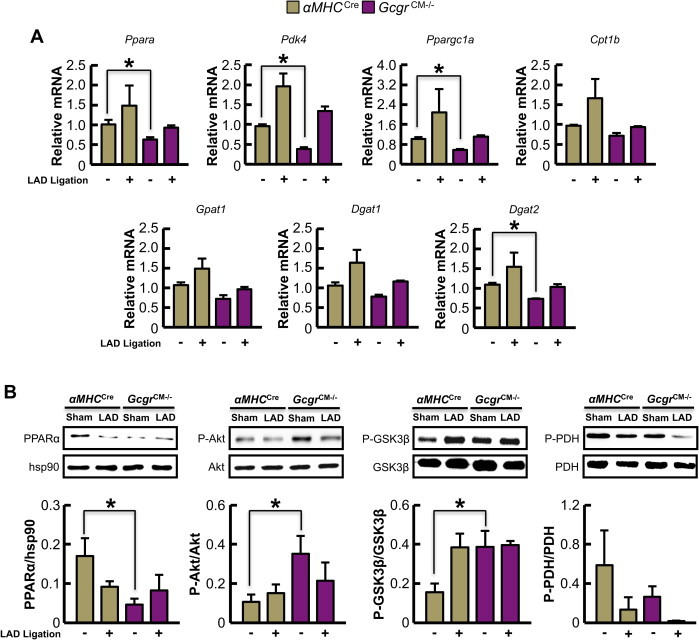
Methods: We assessed infarct size and the following outcomes following left anterior descending (LAD) coronary artery ligation; cardiac gene and protein expression, acylcarnitine profiles, and cardiomyocyte survival in normoglycemic non-obese wildtype mice, and in newly generated mice with selective inactivation of the cardiomyocyte Gcgr. Complementary experiments analyzed Gcgr signaling and cell survival in cardiomyocyte cultures and cell lines, in the presence or absence of exogenous glucagon.

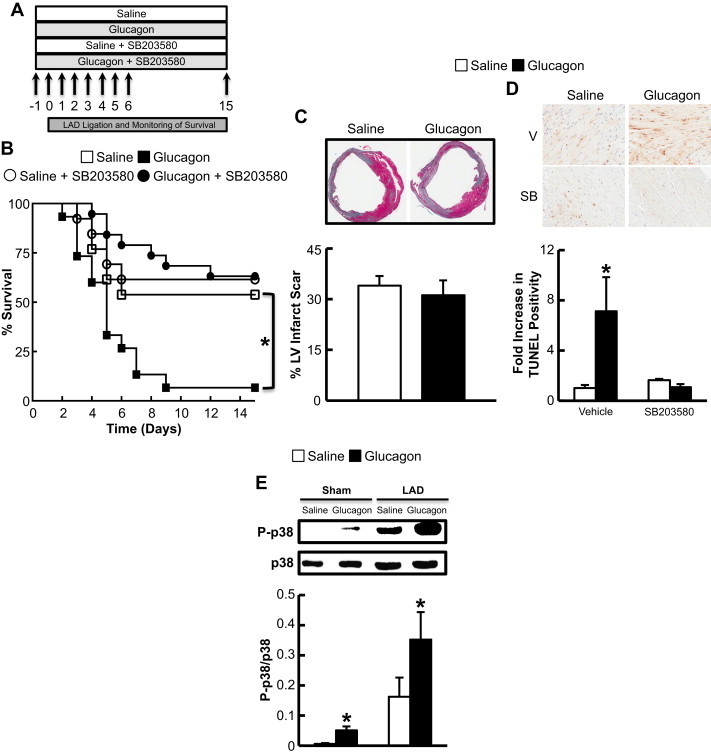
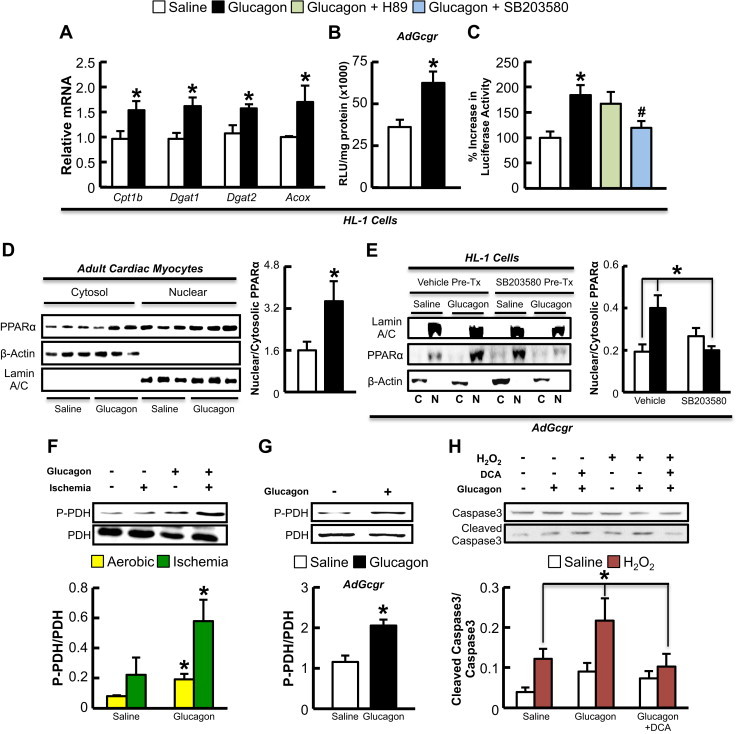
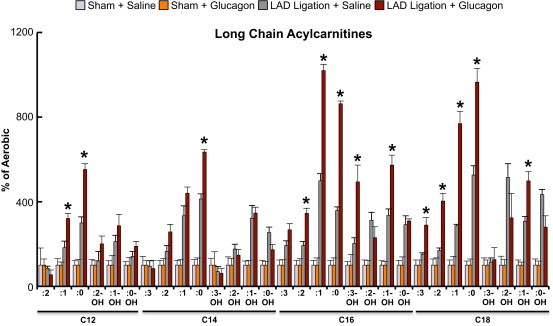
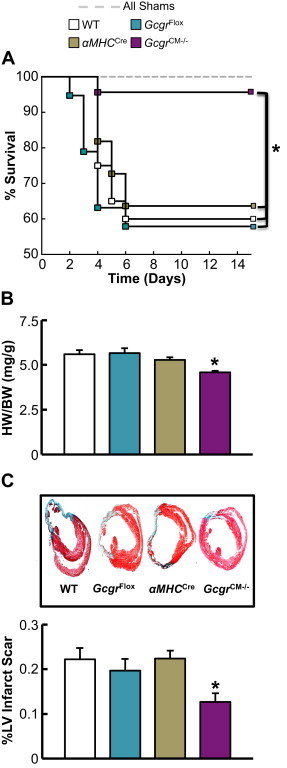
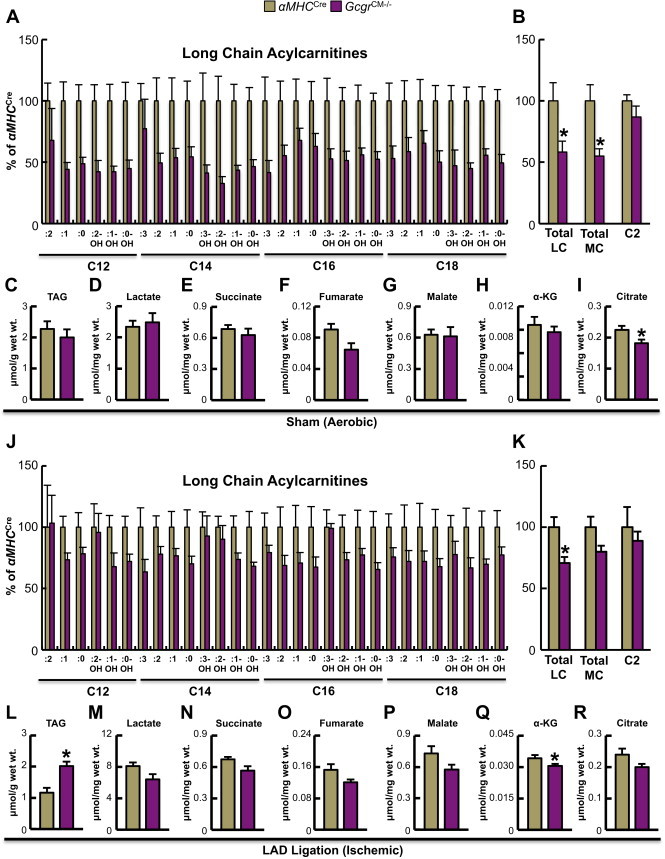
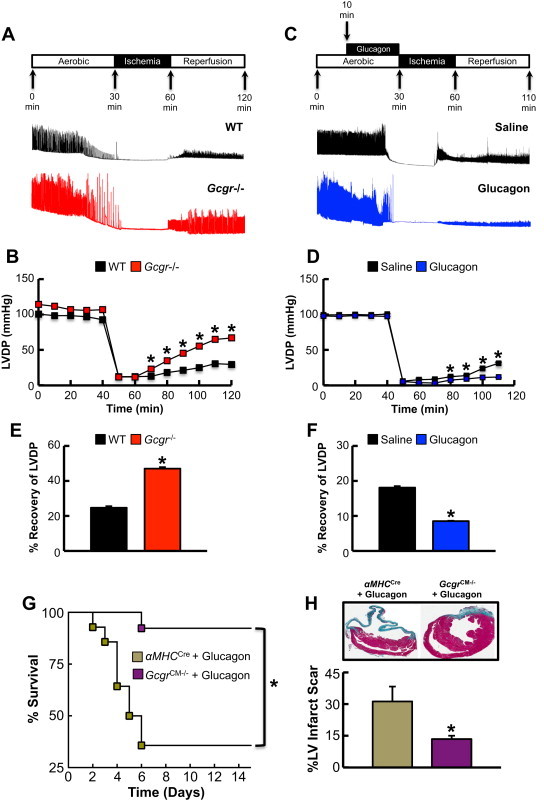
Results: Exogenous glucagon administration directly impaired recovery of ventricular pressure in ischemic mouse hearts ex vivo, and increased mortality from myocardial infarction after LAD coronary artery ligation in mice in a p38 MAPK-dependent manner. In contrast, cardiomyocyte-specific reduction of glucagon action in adult Gcgr (CM-/-) mice significantly improved survival, and reduced hypertrophy and infarct size following myocardial infarction. Metabolic profiling of hearts from Gcgr (CM-/-) mice revealed a marked reduction in long chain acylcarnitines in both aerobic and ischemic hearts, and following high fat feeding, consistent with an essential role for Gcgr signaling in the control of cardiac fatty acid utilization.

Conclusions: Activation or reduction of cardiac Gcgr signaling in the ischemic heart produces substantial cardiac phenotypes, findings with implications for therapeutic strategies designed to augment or inhibit Gcgr signaling for the treatment of metabolic disorders.

Keywords: Cardiomyocytes; Diabetes; Fatty acid metabolism; Glucagon; Glucagon receptor; Heart; Myocardial infarction.


Figures

Figure 1
Figure 1
Glucagon impairs survival after MI in a p38 MAPK-dependent manner. (A) Schematic of overall study design. Mice were injected with vehicle/glucagon/SB203580 for 7 days starting 1 day prior to LAD coronary artery ligation and sacrificed 15 days later. (B) Survival following LAD coronary artery ligation in C57BL/6 mice treated with saline or glucagon (30 ng/g) with or without co-administration of the p38 MAPK inhibitor (SB203580 1 μmol/kg) for 1 week. *p < 0.05 saline vs. glucagon. Data are mean ± S.E.M (LAD n = 13–15 per treatment). (C) Infarct size assessed in mice described in (B) at day 15. Data are mean ± S.E.M (LAD n = 5–6 per treatment). (D) C57BL/6 mice treated with saline or glucagon (30 ng/g) with or without co-administration of the p38 MAPK inhibitor (SB203580 1 μmol/kg; SB) were subjected to LAD coronary artery ligation for 48 h to assess TUNEL positive cardiac myocytes. *p < 0.05 saline vs. glucagon. Data are mean ± S.E.M (LAD n = 7–8 mice per treatment). (E) p38 MAPK phosphorylation in C57BL/6 mice treated with saline or glucagon (30 ng/g) with or without SB203580 (1 μmol/kg) 48 h post-LAD coronary artery ligation or sham surgery. *p < 0.05 saline vs. glucagon group. Data are mean ± S.E.M (n = 3–5).
Figure 2
Figure 2
Glucagon increases PPARα-dependent gene expression, PPARα nuclear translocation, cleaved caspase 3 levels, and PDH phosphorylation. (A) HL-1 cells infected with adenovirus expressing the rat Gcgr cDNA were treated with saline or 20 nM glucagon for 3 h for assessment of Cpt1b, Dgat1, Dgat2, and Acox mRNA expression. (B,C) HL-1 cells were infected with Adβ-gal or AdGcgr for 24 h followed by transfection with a PPARα gene promoter-luciferase construct. Cells were treated with saline or 20 nM glucagon for 3 h, with or without the PKA inhibitor (H89) or p38 MAPK inhibitor (SB203580) and luciferase expression was quantified as Relative Light Units (RLU). (D) Primary cultures of murine atrial cardiac myocytes were treated with saline or 20 nM glucagon for 3 h and cells were harvested for Western blot analysis of cytoplasmic and nuclear protein expression. (E) HL-1 cell lines infected with AdGcgr were treated with saline or 20 nM glucagon with and without SB203580 and cells were harvested for nuclear (N) and cytoplasmic (C) protein analysis. (F) C57BL/6 mice were treated with exogenous glucagon (30 ng/g) every 8 h for 24 h to assess PDH phosphorylation in hearts in mice that underwent 30 min occlusion of the LAD coronary artery or sham surgery (n = 6 per treatment). (G) PDH phosphorylation in HL-1 cells infected with AdGcgr for 24 h followed by a 3 h treated with glucagon. (H) AdGcgr infected HL-1 cell lines were treated for 24 h with 100 μM H2O2 and/or 20 nM glucagon during the final 3 h of H2O2 treatment to detect cleaved caspase 3 levels. Separate groups of cells were treated with or without 1.5 mM DCA (PDH activator via inhibiting the PPARα target gene, PDK4) for 24 h concomitantly with H2O2. *p < 0.05, saline vs. glucagon. #p < 0.05, glucagon + SB203580 vs. glucagon alone. All cell culture experiments were repeated at least twice, n-4-6 per condition.
Figure 3
Figure 3
Glucagon increases long chain acylcarnitine levels in the ischemic heart. Glucagon (30 ng/g body weight) or saline injections were administered subcutaneously every 8 h over a 24 h period (4 total injections at 0, 8, 16, and 24 h) and hearts were harvested after a 5 h fast and subjected to metabolomics assessment to determine acylcarnitine content. Ischemic hearts were collected 30 min following LAD coronary artery ligation surgery (surgery took place 4 h into the 5 h fast). Data is expressed as percent of levels in aerobic mouse hearts for each respective group.*p < 0.05 saline vs. glucagon-treated LAD coronary artery ligation group. Data are mean ± S.E.M (n = 5 per group).
Figure 4
Figure 4
Loss of cardiac Gcgr signaling enhances survival following MI and attenuates adverse LV remodeling. (A) LAD coronary artery ligation was performed in 11–14-week-old GcgrCM−/− and littermate control mice and survival was monitored for 15 days following surgery. *p < 0.05 GcgrCM−/− vs. each control group. Data are mean ± S.E.M (SHAM; n = 10 per genotype and LAD; n = 11–23 per genotype). (B) Heart weight:body weight (HW:BW) ratio 15 days following LAD coronary artery ligation. *p < 0.05 GcgrCM−/− vs. GcgrFlox and wild-type (WT) mice. Data are mean ± S.E.M (n = 8–11 per genotype). (C) Masson's trichome staining of infarcted heart and quantification of % left ventricular (LV) infarct scar area 15 days following LAD coronary artery ligation. *p < 0.05 GcgrCM−/− vs. littermate control mice. Data are mean ± S.E.M (n = 9–11 per genotype).
Figure 5
Figure 5
Selective loss of Gcgr signaling in cardiomyocytes leads to reduced expression of genes and proteins regulating fatty acid metabolism. (A) Quantification of mRNA transcript levels from sham/aerobic and ischemic hearts (30 min post-LAD coronary artery ligation) from 12-week-old αMHCCre and GcgrCM−/− mice fasted for 5 h (n = 4). *p < 0.05 GcgrCM−/− vs. αMHCCre. Data are mean ± S.E.M. (B) Protein expression/phosphorylation in fasted (5 h) hearts from 12-week-old αMHCCre and GcgrCM−/− mice subjected to sham surgery or LAD coronary artery occlusion for 30 min *p < 0.05 for αMHCCre vs. GcgrCM−/− mice. Data are mean ± S.E.M (n = 4 mice in each group).
Figure 6
Figure 6
Targeted metabolomics reveals reduced fatty acid oxidation in GcgrCM−/− hearts. (A) Acylcarnitine levels in aerobic hearts harvested from fasted (5 h) αMHCCre and GcgrCM−/− mice (n = 5 per genotype). Values are expressed as percent of levels in hearts from αMHCCre mice. (B) Aerobic myocardial total long chain (LC), medium chain (MC) and acetyl (C2) acylcarnitines.*p < 0.05 αMHCCre vs. GcgrCM−/−. Levels of triacylglycerol (TAG) (C), lactate (D) and Krebs cycle intermediates (E–I) in 5 h fasted sham/aerobic hearts. *p < 0.05 αMHCCre vs. GcgrCM−/−. (J) Acylcarnitine levels in hearts harvested 30 min following cardiac ischemia from 5 h fasted αMHCCre and GcgrCM−/− mice (n = 5 per genotype). Values are expressed as percent of αMHCCre mice values. (K) Levels of total LC, MC and acetyl (C2) acylcarnitines in ischemic hearts.*p < 0.05 αMHCCre vs. GcgrCM−/−. TAG (L) and lactate (M) content in ischemic hearts. *p < 0.05 αMHCCre vs. GcgrCM−/−. (N–R) Levels of Krebs cycle intermediates in hearts harvested 30 min following cardiac ischemia from 5 h fasted αMHCCre and GcgrCM−/− mice. *p < 0.05 αMHCCre vs. GcgrCM/−.
Figure 7
Figure 7
Loss of Gcgr signaling protects whereas glucagon impairs recovery of LV developed pressure (LVDP) after I/R injury in the isolated heart ex vivo. (A–F) Schematic depiction of peptide infusions, ischemia and reperfusion times, and representative LVDP recordings and data from isolated perfused hearts. LVDP measurements in isolated perfused Gcgr−/− (B,E) and WT (D,F) hearts subjected to I/R injury with and without glucagon (1 μg/mL for 20 min) (D,F). For E&F, graph depicts the percentage recovery rate of LVDP following ischemia. Data shown are means ± S.E.M. (n = 3–6 per genotype). *p < 0.05 compared with the control group. (G,H) Glucagon impairs survival after myocardial infarction in a cardiac Gcgr-dependent manner. (G) Left anterior descending coronary artery ligation (LAD) surgeries were performed in 11–14-week-old αMHCCre and GcgrCM−/− mice treated with 30 ng/g body weight glucagon given by subcutaneous injection (every 8 h for 7 days). Survival was monitored for 15 days following surgery. (H) Infarct size was assessed 15 days following LAD coronary artery ligation. *p < 0.05 αMHCCre WT vs. GcgrCM−/− mice. Data are mean ± S.E.M (n = 12–13 per genotype).

Similar articles

Cited by

References

    1. Unger R.H., Cherrington A.D. Glucagonocentric restructuring of diabetes: a pathophysiologic and therapeutic makeover. Journal of Clinical Investigation. 2012;122(1):4–12. - PMC - PubMed
    1. Sinclair E.M., Yusta B., Streutker C., Baggio L.L., Koehler J., Charron M.J. Glucagon receptor signaling is essential for control of murine hepatocyte survival. Gastroenterology. 2008;135(6):2096–2106. - PubMed
    1. Dunphy J.L., Taylor R.G., Fuller P.J. Tissue distribution of rat glucagon receptor and GLP-1 receptor gene expression. Molecular and Cellular Endocrinology. 1998;141(1–2):179–186. - PubMed
    1. Campos R.V., Lee Y.C., Drucker D.J. Divergent tissue-specific and developmental expression of receptors for glucagon and glucagon-like peptide-1 in the mouse. Endocrinology. 1994;134:2156–2164. - PubMed
    1. Ali S., Drucker D.J. Benefits and limitations of reducing glucagon action for the treatment of type 2 diabetes. American Journal of Physiology. Endocrinology and Metabolism. 2009;296(3):E415–E421. - PubMed