Valsartan Attenuates Atherosclerosis via Upregulating the Th2 Immune Response in Prolonged Angiotensin II-Treated ApoE(-/-) Mice
- PMID: 25685964
- PMCID: PMC4461573
- DOI: 10.2119/molmed.2014.00195
Valsartan Attenuates Atherosclerosis via Upregulating the Th2 Immune Response in Prolonged Angiotensin II-Treated ApoE(-/-) Mice
Abstract
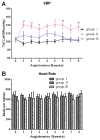
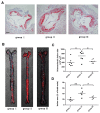
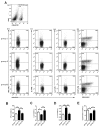
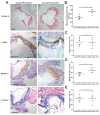
Valsartan has a protective effect against hypertension and atherosclerosis in humans and experimental animal models. This study aimed to determine the effect of prolonged treatment with angiotensin II (Ang II) on atherosclerosis and the effect of valsartan on the activity of CD4(+) T lymphocyte subsets. The results showed that prolonged treatment (8 wks) with exogenous Ang II resulted in an increased atherosclerotic plaque size and a switch of stable-to-unstable plaque via modulating on CD4(+) T lymphocyte activity, including an increase in the T helper cell type 1 (Th1) and Th17 cells and a decrease in Th2 and regulatory T (Treg) cells. In contrast, valsartan treatment efficiently reversed the imbalance in CD4(+) T lymphocyte activity, ameliorated atherosclerosis and elicited a stable plaque phenotype in addition to controlling blood pressure. In addition, treatment with anti-interleukin (IL)-5 monoclonal antibodies weakened the antiatherosclerotic effects of valsartan without affecting blood pressure.
Figures


Similar articles
-
Valsartan Promoting Atherosclerotic Plaque Stabilization by Upregulating Renalase: A Potential-Related Gene of Atherosclerosis.J Cardiovasc Pharmacol Ther. 2015 Sep;20(5):509-19. doi: 10.1177/1074248415575967. Epub 2015 Mar 27. J Cardiovasc Pharmacol Ther. 2015. PMID: 25818930
-
ATRQβ-001 vaccine prevents atherosclerosis in apolipoprotein E-null mice.J Hypertens. 2016 Mar;34(3):474-85; discussion 485. doi: 10.1097/HJH.0000000000000835. J Hypertens. 2016. PMID: 26771341
-
Deletion of the angiotensin II type 1a receptor prevents atherosclerotic plaque rupture in apolipoprotein E-/- mice.Arterioscler Thromb Vasc Biol. 2012 Jun;32(6):1453-9. doi: 10.1161/ATVBAHA.112.249516. Epub 2012 Mar 29. Arterioscler Thromb Vasc Biol. 2012. PMID: 22460554
-
New basic science initiatives with the angiotensin II receptor blocker valsartan.J Renin Angiotensin Aldosterone Syst. 2000 Jun;1(2 Suppl):S3-5. doi: 10.3317/jraas.2000.052. J Renin Angiotensin Aldosterone Syst. 2000. PMID: 17199210 Review.
-
T cell subsets and functions in atherosclerosis.Nat Rev Cardiol. 2020 Jul;17(7):387-401. doi: 10.1038/s41569-020-0352-5. Epub 2020 Mar 16. Nat Rev Cardiol. 2020. PMID: 32203286 Free PMC article. Review.
Cited by
-
Targeting regulatory T cells for cardiovascular diseases.Front Immunol. 2023 Feb 23;14:1126761. doi: 10.3389/fimmu.2023.1126761. eCollection 2023. Front Immunol. 2023. PMID: 36911741 Free PMC article. Review.
-
Unveiling Wide Spectrum Therapeutic Implications and Signaling Mechanisms of Valsartan in Diverse Disorders: A Comprehensive Review.Curr Drug Res Rev. 2024;16(3):268-288. doi: 10.2174/2589977515666230717120828. Curr Drug Res Rev. 2024. PMID: 37461345 Review.
-
Fimasartan reduces neointimal formation and inflammation after carotid arterial injury in apolipoprotein E knockout mice.Mol Med. 2019 Jul 15;25(1):33. doi: 10.1186/s10020-019-0095-0. Mol Med. 2019. PMID: 31307370 Free PMC article.
-
Circulating Th1, Th2, and Th17 Levels in Hypertensive Patients.Dis Markers. 2017;2017:7146290. doi: 10.1155/2017/7146290. Epub 2017 Jul 5. Dis Markers. 2017. PMID: 28757677 Free PMC article.
-
Protein Arginine Methyltransferase 2 Inhibits Angiotensin II-Induced Proliferation and Inflammation in Vascular Smooth Muscle Cells.Biomed Res Int. 2018 Aug 13;2018:1547452. doi: 10.1155/2018/1547452. eCollection 2018. Biomed Res Int. 2018. PMID: 30186848 Free PMC article.
References
-
- Robertson AK, Hansson GK. T cells in atherogenesis: for better or for worse? Arterioscler Thromb Vasc Biol. 2006;26:2421–32. - PubMed
-
- Frostegård J, et al. Cytokine expression in advanced human atherosclerotic plaques: dominance of pro-inflammatory (Th1) and macrophage-stimulating cytokines. Atherosclerosis. 1999;145:33–43. - PubMed
-
- Mazzolai L, et al. Endogenous angiotensin II induces atherosclerotic plaque vulnerability and elicits a Th1 response in ApoE−/− mice. Hypertension. 2004;44:277–82. - PubMed
Publication types
MeSH terms
Substances
LinkOut - more resources
Full Text Sources
Other Literature Sources
Medical
Research Materials
Miscellaneous

