Review
. 2015 Apr;95(4):432-52.
doi: 10.1038/labinvest.2014.154. Epub 2015 Feb 16.

Application of GFP imaging in cancer

Affiliations
Review

Application of GFP imaging in cancer

Robert M Hoffman. Lab Invest. 2015 Apr.

Abstract

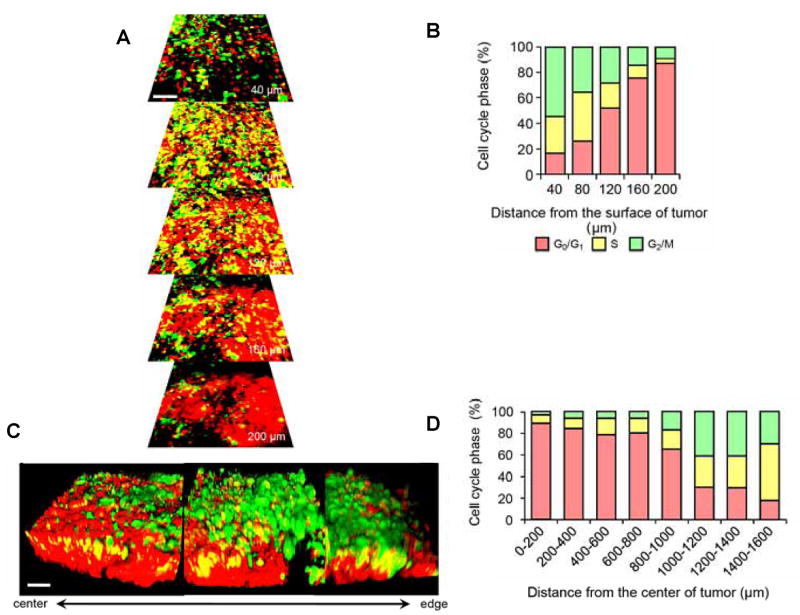
Multicolored proteins have allowed the color-coding of cancer cells growing in vivo and enabled the distinction of host from tumor with single-cell resolution. Non-invasive imaging with fluorescent proteins enabled the dynamics of metastatic cancer to be followed in real time in individual animals. Non-invasive imaging of cancer cells expressing fluorescent proteins has allowed the real-time determination of efficacy of candidate antitumor and antimetastatic agents in mouse models. The use of fluorescent proteins to differentially label cancer cells in the nucleus and cytoplasm can visualize the nuclear-cytoplasmic dynamics of cancer cells in vivo including: mitosis, apoptosis, cell-cycle position, and differential behavior of nucleus and cytoplasm that occurs during cancer-cell deformation and extravasation. Recent applications of the technology described here include linking fluorescent proteins with cell-cycle-specific proteins such that the cells change color from red to green as they transit from G1 to S phases. With the macro- and micro-imaging technologies described here, essentially any in vivo process can be imaged, giving rise to the new field of in vivo cell biology using fluorescent proteins.


Conflict of interest statement

Conflict of Interest: Robert M. Hoffman is an unsalaried affiliate of AntiCancer Inc.

Figures

Figure 1
Figure 1
an example of the earliest prototype for in vivo imaging with GFP is the Illumatool a simple instrument with a light sources that are properly filtered to avoid autofluorescence and an emission filter through which it is possible to image GFP fluorescence from unrestrained animals. An example of the best state of the art, OV100 small animal imaging system: The OV-100 Small Animal Imaging System (Olympus, Tokyo, Japan), containing an MT-20 light source (Olympus) and DP70 CCD camera (Olympus) was used. The optics of the OV-100 fluorescence imaging system have been specially developed for macroimaging as well as microimaging with high light-gathering capacity. The instrument incorporates a unique combination of high numerical aperture and long working distance. Five individually optimized objective lenses, parcentered and parfocal, provide a 105-fold magnification range for seamless imaging of the entire body down to the subcellular level without disturbing the animal. The OV-100 has the lenses mounted on an automated turret with a high magnification range of ×1.6 to ×16 and a field of view ranging from 6.9 to 0.69 mm. The optics and antireflective coatings ensure optimal imaging of multiplexed fluorescent reporters in small animals. High-resolution images were captured directly on a PC (Fujitsu Siemens, Munich, Germany). Images were processed for contrast and brightness and analyzed with the use of Paint Shop Pro 8 and CellR (Olympus Biosystems).
Figure 2
Figure 2. Real-time imaging of apoptotic cell death in the brain in live mice
(A) Seven days after dual-color Lewis lung carcinoma (LLC) cell inoculation via the internal carotid artery, the cells were irradiated for 60 s with UVC. (B) Three hours after irradiation, aggregation of chromatin at the nuclear membrane (arrow) and fragmented nuclei (arrow heads) were observed. (C) Six hours after irradiation, the nuclei appeared to form numerous additional fragments and destruction of RFP-expressing cytoplasm was observed (scale bars, a,b: 100 mm; c: 20 mm).
Figure 3
Figure 3
Time-course dynamic imaging of a dual-color Lewis lung carcinoma (LLC) cell undergoing mitosis in the brain visualized through the craniotomy window with the OV100 imaging system. Arrows point to the same cell undergoing mitosis.
Figure 4
Figure 4. Invasive cancer cells are predominantly in G0/G1
FUCCI-expressing cancer cells (5 × 10⁶) were placed on Gelfoam® (1 × 1 cm) in RPMI 1640 medium. (A) High-magnification real-time images of invading cancer cells cultured on Gelfoam® for 48 h. Arrows show the direction of invading cancer cells. (B) Histogram shows cell cycle phase of invading cancer cells.
Figure 5
Figure 5. Cell cycle phase distribution of cancer cells at the tumor surface and center
(A) FUCCI-expressing MKN45 cells were implanted directly in the liver of nude mice and imaged at 35 d. (B) Histogram shows the cell cycle distribution in the tumor at 35 d after implantation. (C) Representative 3D reconstruction images of a nascent tumor at 35 d after implantation. (D) Histogram shows the distribution of FUCCI-expressing cells at different distances from the center. The number of cells in each cell cycle phase were assessed by counting the number of cells of each color at the indicated time points and depth. The percentages of cells in the G2/M, S, and G0/G1 phases of the cell cycle are shown (D). Data are means (each group for n = 5). Scale bars represent 100 μm.
Figure 6
Figure 6. Visualization of angiogenesis in live tumor tissue 3 weeks after s.c. injection of B16F10-RFP melanoma cells in the transgenic GFP mouse
Well developed, host-derived GFP-expressing blood vessels are visualized in the RFP-expressing mouse melanoma.
Figure 7
Figure 7. Visualization of host macrophage–tumor cell interaction in fresh tumor tissue
Images show host macrophages expressing GFP interacting with human PC-3-RFP prostate cancer cells on day 35 after orthotopic implantation of PC-3-RFP cells in the transgenic GFP nude mouse. (A) Host GFP macrophage (arrowhead) contacting RFP cancer cell (arrow). (B) GFP macrophage (arrowhead) engulfing RFP cancer cell (arrow). (C) RFP cancer cell (arrow) engulfed by GFP macrophage (arrowhead). (D) RFP cancer cell (arrows) digested by GFP macrophage (arrowhead). (Scale bars, 20 μm.)
Figure 8
Figure 8. Visualization of host macrophage-cancer cell interaction in live mice
(A) Host GFP macrophages were visualized contacting HT-1080-GFP-RFP cells (arrow, broken arrow). Macrophage processes can be seen extending into the HT-1080-GFP-RFP cell (arrowhead). Another macrophage (broken arrow) contained cytoplasmic fragments after digesting an HT-1080-GFP-RFP cell. (B) A macrophage (arrow), engulfing the RFP-expressing cytoplasm of an HT-1080 cell shown in contact with additional HT-1080-GFP-RFP cells (broken arrows). Bar=20 μm.
Figure 9
Figure 9
Interactions (arrows) of host stromal GFP-expressing fibroblast cell (arrowhead) and Dunning RFP-expressing rodent prostate cancer cells in live tumor tissue. Scale bar, 20 μm.
Figure 10
Figure 10. Dual-color MMT cells with GFP in the cytoplasm and RFP in the nucleus, growing in the liver of a CFP nude mouse after splenic injection
Dual-color MMT cells formed tumors in the liver of a CFP mouse 28 days after splenic injection. Hepatocytes, non-parenchymal liver cells (yellow arrows) and dual-color MMT cancer cells (red arrows) were visualized simultaneously. The image was taken with an FV1000 confocal microscope. (Bar=50 μm).
Figure 11
Figure 11. Non-invasive imaging of fluorescent tumor from a patient with pancreatic cancer growing orthotopically in nude mice
(A) Whole-body non-invasive imaging of human pancreatic cancer orthotopic tumorgraft in non-transgenic nude mice. Mice were non-invasively imaged at day-21 (upper panel), day-30 (middle panel) and day-74 (lower panel). The tumors in the non-transgenic nude mice are in the F4 passage after F1, in NOD/SCID mice after patient surgery; F2, in transgenic green fluorescent protein (GFP)-expressing nude mice; and F3 in transgenic red fluorescent protein (RFP)-expressing nude mice. The tumor acquired GFP and RFP stroma in the F2 and F3 passages, respectively. Images were taken with the Olympus OV100 Small Animal Imaging System. (B) Image of human pancreatic cancer tumor tissue resected from the F4 passage with RFP and GFP stroma. Image was taken with an FV1000 confocal laser microscope. Yellow arrows indicate RFP-expressing cancer-associated fibroblast cells (CAFs). Blue arrows indicate GFP-expressing CAFs.
Figure 12
Figure 12. Fluorescence-guided surgical removal of peritoneal disseminated HCT-116 tumors after GFP labeling with OBP-401
Non-colored HCT-116 human colon cancer cells were injected into the abdominal space of nude mice. Ten days later, 1 × 10⁸ PFU of OBP-401 were i.p. injected. (A) Disseminated nodules were efficiently labeled and noninvasively visualized by GFP expression 5 days after virus administration. (B) Under general anesthesia, laparotomy was performed to remove intra-abdominal disease under GFP-guided navigation. (C) Disseminated nodules visualized by GFP-guided navigation were removed. (Scale bars: A–C, 10 mm.) (D) Frozen section of resected HCT-116 disseminated nodules with fluorescence detection. (Scale bar, 500 μm.) (E) H&E section of HCT-116 disseminated nodules shown in D. The box outlines a region of D and E analyzed in F. (Scale bar, 500 μm.) (F) Detail of the boxed region of D and E. (Scale bar, 50 μm.)
Figure 13
Figure 13. Transgenic RFP nude mouse
All of the major organs and tissues are red under fluorescence excitation with blue light. (A) Whole-body image of transgenic RFP nude mouse. Image was taken with a Hamamatsu C5810 tree-chip CCD camera. (B) Brain. (C) Heart and lungs. (D) Liver. (E) Circulatory system. (F) Uterus and ovary. (G) Pancreas. (H) Kidney and adrenal gland. (I) Spleen. (B-I) Images were taken with the Indec Biosystems FluorVivo imaging system.
Figure 14
Figure 14
Image rendering. Phase contrast fluorescence micrographs and rotating images of 143B human osteosarcoma cells expressing αv integrin fused to GFP on plastic plates (left panels), in MatrigelTM culture (middle panels), in Gelfoam® culture (right panels) using the Olympus FV1000. Z-stack in 1 μm steps. The depths of images are on plastic surface 20 μm; MatrigelTM 70 μm; Gelfoam®180 μm. These images are rotated around the Z axes from 0° to 80° in 5 sections, using the FV-10 ASW software system.

Similar articles

Cited by

References

    1. Hoffman RM. The multiple uses of fluorescent proteins to visualize cancer in vivo. Nature Reviews Cancer. 2005;5:796–806. - PubMed
    1. Shcherbo D, Merzlyak EM, Chepurnykh TV, et al. Bright far-red fluorescent protein for whole-body imaging. Nat Methods. 2007;4:741–746. - PubMed
    1. Yang M, Baranov E, Wang JW, et al. Direct external imaging of nascent cancer, tumor progression, angiogenesis, and metastasis on internal organs in the fluorescent orthotopic model. Proc Natl Acad Sci USA. 2002;99:3824–3829. - PMC - PubMed
    1. Yamamoto N, Yang M, Jiang P, et al. Real-time imaging of individual color-coded metastatic colonies in vivo. Clin Exp Metastasis. 2003;20:633–638. - PubMed
    1. Brown EB, Campbell RB, Tsuzuki Y, et al. In vivo measurement of gene expression, angiogenesis and physiological function in tumors using multiphoton laser scanning microscopy. Nature Med. 2001;7:864–868. - PubMed

Publication types

Substances