. 2015 Mar;21(3):231-8.
doi: 10.1038/nm.3799. Epub 2015 Feb 16.

Synthetic lethality by targeting EZH2 methyltransferase activity in ARID1A-mutated cancers

Affiliations

Synthetic lethality by targeting EZH2 methyltransferase activity in ARID1A-mutated cancers

Benjamin G Bitler et al. Nat Med. 2015 Mar.

Abstract

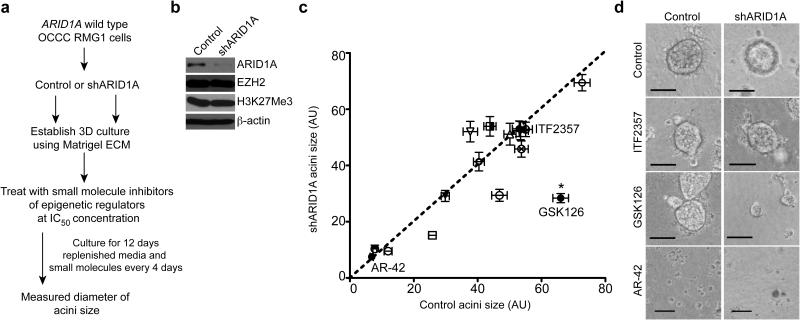
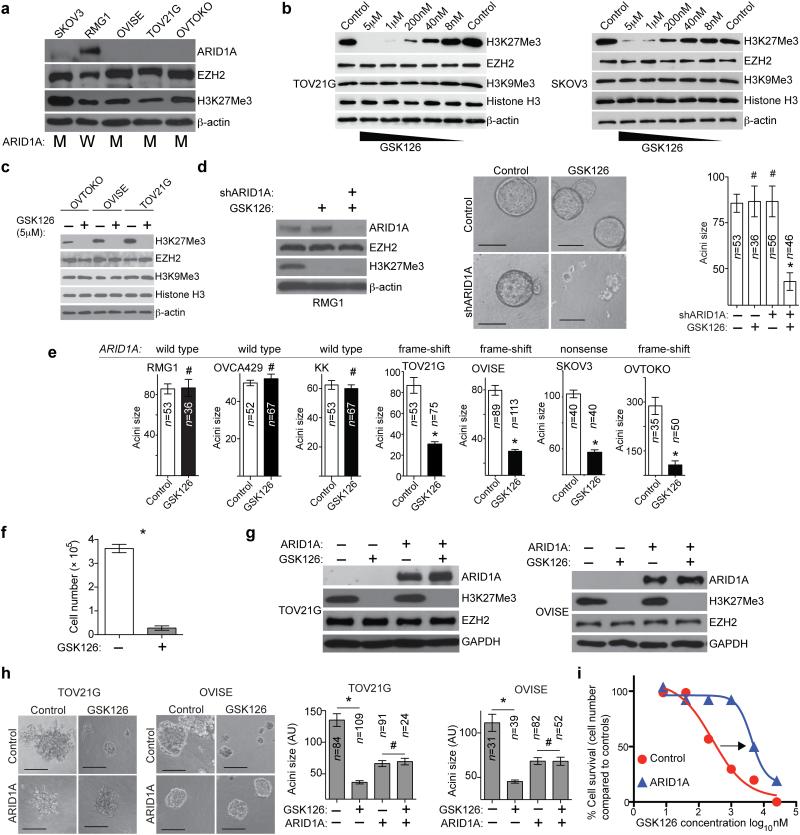
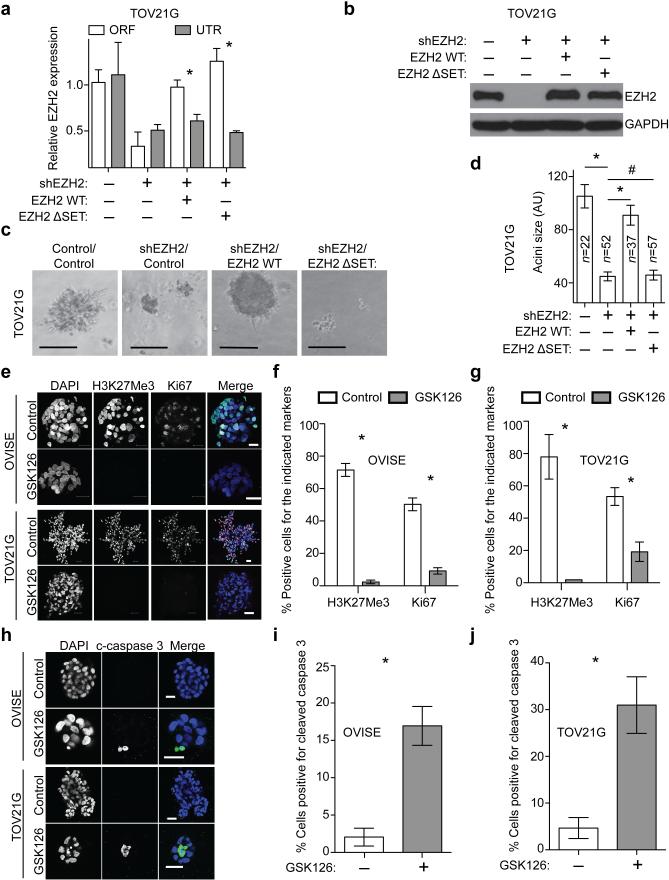
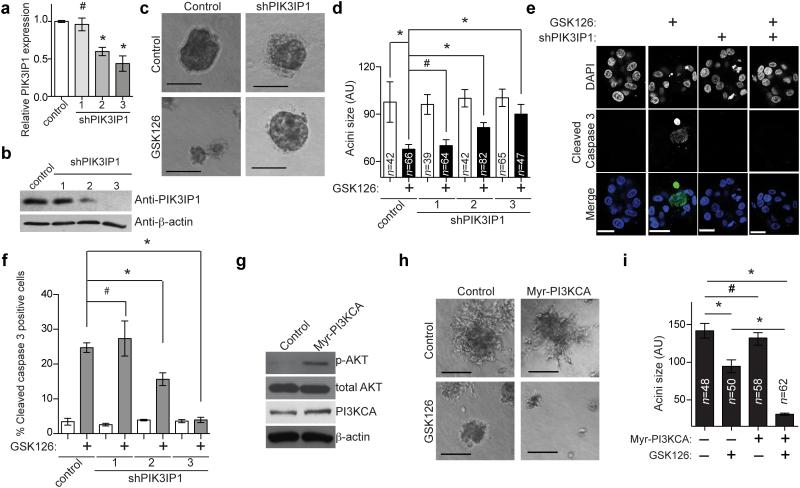
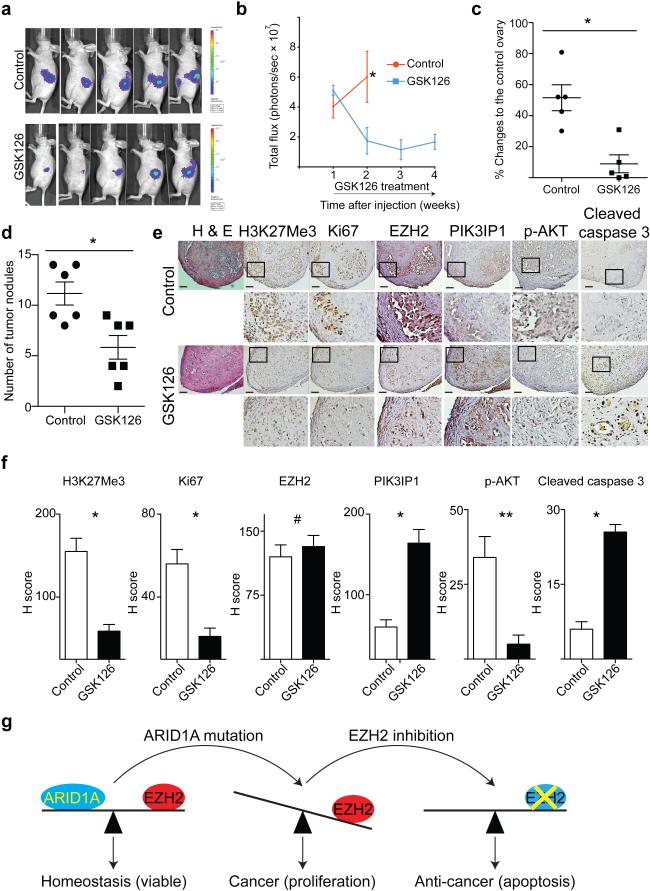
The gene encoding ARID1A, a chromatin remodeler, shows one of the highest mutation rates across many cancer types. Notably, ARID1A is mutated in over 50% of ovarian clear cell carcinomas, which currently have no effective therapy. To date, clinically applicable targeted cancer therapy based on ARID1A mutational status has not been described. Here we show that inhibition of the EZH2 methyltransferase acts in a synthetic lethal manner in ARID1A-mutated ovarian cancer cells and that ARID1A mutational status correlated with response to the EZH2 inhibitor. We identified PIK3IP1 as a direct target of ARID1A and EZH2 that is upregulated by EZH2 inhibition and contributed to the observed synthetic lethality by inhibiting PI3K-AKT signaling. Importantly, EZH2 inhibition caused regression of ARID1A-mutated ovarian tumors in vivo. To our knowledge, this is the first data set to demonstrate a synthetic lethality between ARID1A mutation and EZH2 inhibition. Our data indicate that pharmacological inhibition of EZH2 represents a novel treatment strategy for cancers involving ARID1A mutations.


Figures

Figure 1
Figure 1
GSK126, an EZH2 inhibitor, is selective against ARID1A knockdown cells compared with controls. (a) Flow-diagram of the evaluation for a panel of epigenetic inhibitors. ARID1A wild type OCCC RMG1 cells were transduced with lentivirus encoding a shARID1A or control. Following drug selection, cells were plated onto Matrigel and treated with 15 individual small molecules and vehicle control using IC50 concentrations as detailed in Supplementary Table 2. (b) Immunoblotting of ARID1A, EZH2, H3K27Me3 and loading control β-actin in the indicated cells. (c) Quantification of the average acini diameter (each symbol represents a small molecule) graphed as a scatter plot. The x-axis indicates the acini size formed by control ARID1A wild type treated cells, while the y-axis indicates the acini size formed by the same small molecule treated shARID1A-expressing RMG1 cells. * P <0.0001 calculated with two-tailed t test using GraphPad Prism 5 software. Number of acini (n) for each of the small molecules used for analysis is listed in Supplementary Table 1. Error bars represent s.e.m. (d) Representative images of acini from indicated small molecules. Scale Bars = 75 of measurable units (AU) using the NIH Image J software. GSK126 (100nM) represents screening hit that selectively inhibits the growth of ARID1A knockdown cells compared with controls. ITF2357 and AR-42 represent small molecule inhibitors that showed no significant effects in growth inhibition and significantly suppressed cell growth regardless of ARID1A status, respectively.
Figure 2
Figure 2
Response to the EZH2 inhibitor is dependent on ARID1A status. (a) Immunoblotting of ARID1A, EZH2, H3K27Me3 and loading control β-actin in the indicated cell lines. ARID1A mutation status is indicated as mutated (M) or wild type (W). (b-c) Immunoblotting of the indicated proteins following treatment with GSK126 for 72 hours. (d) Immunoblotting of the indicated proteins in RMG1 cells expressing shARID1A or control treated with or without 5 μM GSK126. Images of acini formed and the diameter of acini was measured. * P<0.0001. (e) Quantification of the diameter of acini formed by the indicated cells with or without 5 μM GSK126 treatment in 3D culture for 12 days. # P=0.914, * P<0.0001. ARID1A mutation status is indicated above the graph. (f) Quantification of cell numbers for the ARID1A mutated OVISE cells. n=6, * P<0.0001. (g) Immunoblotting of the indicated proteins in ARID1A mutated OVISE and TOV21G cells with or without wild type ARID1A restoration treated with or without 5 μM GSK126. (h) Acini formation was examined after 12 days in 3D culture and the diameter of acini was measured. # P>0.05, * P<0.0001. (i) Dose response curves of ARID1A mutated TOV21G cells with or without wild type ARID1A restoration treated with the indicated dose of GSK126 for 12 days in 3D cultures. Scale bars = 75 AU in NIH Image J software. Number of acini (n) is indicated on the graphs as the representative of three experimental repeats. Error bars represent s.e.m. P calculated with two-tailed t test.
Figure 3
Figure 3
EZH2 inhibitor triggers apoptosis of ARID1A mutated cells. (a) qRT-PCR analysis of EZH2 untranslated region (UTR) and open reading frame (ORF) in TOV21G cells expressing a UTR targeting shEZH2 together with a wild type EZH2 or a SET domain deleted EZH2 mutant (EZH2 ΔSET). n=3, * P<0.01. (b) Immunoblotting of EZH2 and GAPDH in the indicated cells. (c) Images of acini formed in 3D culture for 12 days. Scale bars = 75 AU in NIH image J software. (d) Quantification of (c), *P<0.01 and #P>0.05. (e) Immunofluorescence staining of Ki67 (red), H3K27Me3 (green) and DAPI (blue) for acini formed by ARID1A mutated OVISE and TOV21G cells cultured in 3D treated with 5 μM GSK126 or vehicle control for 12 days. Scale bars = 25μM. Note the different scale bars in different panels due to growth suppression by GSK126 treatment. (f-g) Quantification of (e). 200 cells from each of the indicated groups were examined for expression of Ki67 and H3K27Me3. n=3, 4, 5 and 4, *P <0.01. (h) Same as (e), but stained for cleaved caspase 3 (green) and DAPI (blue) after 8 days of GSK126 treatment. Scale bars = 25μM. (i-j) Quantification of (h). 200 cells from each of the indicated groups were examined for cleaved caspase 3 positivity. n=6 and 5,* P <0.01. Number of acini (n) is indicated on the graphs as the representative of three experimental repeats. Error bars represent s.e.m. P calculated with two-tailed t test.
Figure 4
Figure 4
PIK3IP1 is a novel ARID1A/EZH2 direct target gene. (a) Flow-diagram of the strategies used for identifying PIK3IP1 as a direct ARID1A/EZH2 target gene. (b) Spearman statistical analysis of PIK3IP1 and EZH2 expression. Scatter plot of relative expression of EZH2 (x-axis) and PIK3IP1 (y-axis) from laser-capture and microdissected normal ovarian epithelium (n=10; triangles) and OCCCs (n=10; circles). (Spearman correlation r=-0.8211 and P<0.0001). (c) Relative PIK3IP1 mRNA expression in ARID1A mutated (n=4) and wild type (n=5) OCCCs. * P=0.0207. (d) qRT-PCR analysis of PIK3IP1 (n=4; * P<0.01) and immunoblotting of PIK3IP1 and β-actin in the indicated ARID1A mutated OVISE cells. (e) ChIP analysis of OVISE cells treated with vehicle control or 5 μM GSK126 using antibodies against H3K27Me3 or EZH2 for the PIK3IP1 gene promoter. (n=3, * P<0.001, # P=0.9405). (f) ChIP analysis of ARID1A mutated OVISE cells with or without ARID1A restoration using the indicated antibodies or IgG control for the PIK3IP1 gene promoter (n=3; # P>0.05; *P<0.05). (g) Immunoblotting of the indicated proteins in ARID1A mutated TOV21G cells with or without ARID1A restoration treated with or without GSK126 (5μM) or expressing shEZH2. (h) ChIP analysis of ARID1A wild type RMG1 cells expressing control or shARID1A using the indicated antibodies or IgG control for the PIK3IP1 gene promoter (n=3; # P>0.05; *P<0.01). (i) Immunoblotting of the indicated proteins in ARID1A wild type RMG1 cells expressing control or shARID1A treated with or without 5μM GSK126. Error bars represent s.e.m. P calculated with two-tailed t test except a using Spearman’s test.
Figure 5
Figure 5
PIK3IP1 contributes to the observed synthetic lethality. (a) qRT-PCR analysis of PIK3IP1 mRNA in ARID1A mutated OVISE cells infected with lentivirus encoding the indicated shPIK3IP1s or controls. (n=3, # P=0.8149, *P<0.001). (b) Immunoblotting of PIK3IP1 and β-actin in the indicated OVISE cells. (c) Phase-contrast images of the indicated control or shPIK3IP1 (#3)-expressing OVISE cells treated with or without 5μM GSK126 for 12 days in 3D culture. (d) Quantification of (c). # P=0.628, *P<0.01. (e) Immunofluorescence staining for the apoptotic marker cleaved caspase 3 (green) in the acini formed by the indicated cells. Shown is shPIK3IP1 #3. Bars = 25 μm. (f) Quantification of (e). n=3, # P=0.642, * P<0.05. (g) Immunoblotting of phospho-AKT (p-AKT) and the indicated proteins in ARID1A mutated, PI3KCA wild type OVTOKO cells expressing a constitutively active myristoylated PI3KCA (I143V) mutant (Myr-PI3KCA) or controls. (h) Phase-contrast images of the indicated cells treated with or without 5μM GSK126 for 12 days in 3D culture. (i) Quantification of (h). # P>0.05 and * P<0.001. Number of acini (n) is indicated on the graphs as the representative of three experimental repeats. Error bars represent s.e.m. P calculated with two-tailed t test.
Figure 6
Figure 6
EZH2 inhibitor causes the regression and reduces the number of tumor nodules of ARID1A mutated OCCC tumors. (a) 1×10⁶ luciferase expressing ARID1A mutated OVISE cells were unilaterally injected into the bursa sac of the immuno-compromised female mice. The mice were randomized into two groups based on total luciferase flux for daily 50 mg/kg GSK126 or vehicle control treatments by intraperitoneal injection after 7 days. Mice were imaged every 7 days, and shown are images taken at day 14. (b) Quantification of tumor growth. n=5 and * P=0.0026. (c) At necropsy, the size of the dissected tumors was measured by subtracting control counter lateral ovary size from that of the size from the tumor cell injected one. n=5 and * P=0.003. (d) 3×10⁶ ARID1A mutated OVISE cells were injected into the intraperitoneal cavity of immuno-compromised female mice. Mice were randomly separated into two groups after 4 days for daily 50 mg/kg GSK126 or vehicle control treatments. On day 30, the number of tumor nodules in intraperitoneal cavity were assessed. n=6 and * P=0.008). (e) Immunohistochemical staining using the indicated antibodies for tumors dissected from GSK126 or control treated mice (magnification, 10X and 40X). Bars= 50 μm. (f) H-score quantification of (e). n=13 different fields from 5 different tumors. * P=0.0001; ** P=0.012 and # P=0.547. (g) A proposed model for the observed synthetic lethality between ARID1A mutation and inhibition of EZH2 methyltransferase activity. Error bars represent s.e.m. P calculated with two-tailed t test.

Comment in

Similar articles

Cited by

References

    1. Garraway LA, Lander ES. Lessons from the cancer genome. Cell. 2013;153:17–37. - PubMed
    1. Lawrence MS, et al. Discovery and saturation analysis of cancer genes across 21 tumour types. Nature. 2014;505:495–501. - PMC - PubMed
    1. Wilson BG, Roberts CW. SWI/SNF nucleosome remodellers and cancer. Nature reviews. Cancer. 2011;11:481–492. - PubMed
    1. Wiegand KC, et al. ARID1A mutations in endometriosis-associated ovarian carcinomas. N Engl J Med. 2010;363:1532–1543. - PMC - PubMed
    1. Jones S, et al. Frequent mutations of chromatin remodeling gene ARID1A in ovarian clear cell carcinoma. Science. 2010;330:228–231. - PMC - PubMed

Publication types

MeSH terms

Associated data