. 2015 Jun;275(3):746-54.
doi: 10.1148/radiol.14140251. Epub 2015 Feb 13.

Establishing the Lysine-rich Protein CEST Reporter Gene as a CEST MR Imaging Detector for Oncolytic Virotherapy

Affiliations

Establishing the Lysine-rich Protein CEST Reporter Gene as a CEST MR Imaging Detector for Oncolytic Virotherapy

Christian T Farrar et al. Radiology. 2015 Jun.

Abstract

Purpose: To (a) evaluate whether the lysine-rich protein (LRP) magnetic resonance (MR) imaging reporter gene can be engineered into G47Δ, a herpes simplex-derived oncolytic virus that is currently being tested in clinical trials, without disrupting its therapeutic effectiveness and (b) establish the ability of chemical exchange saturation transfer (CEST) MR imaging to demonstrate G47Δ-LRP.

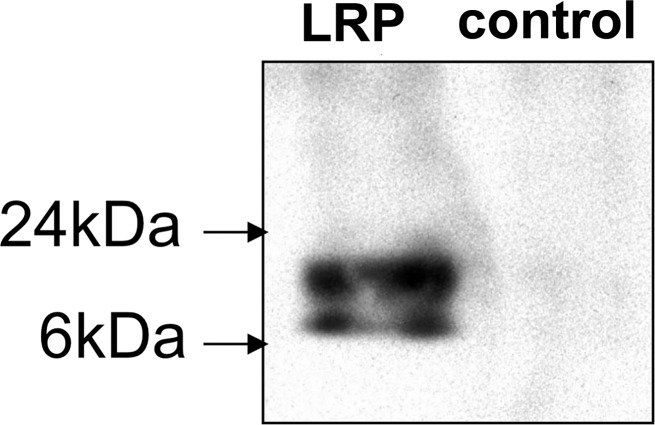
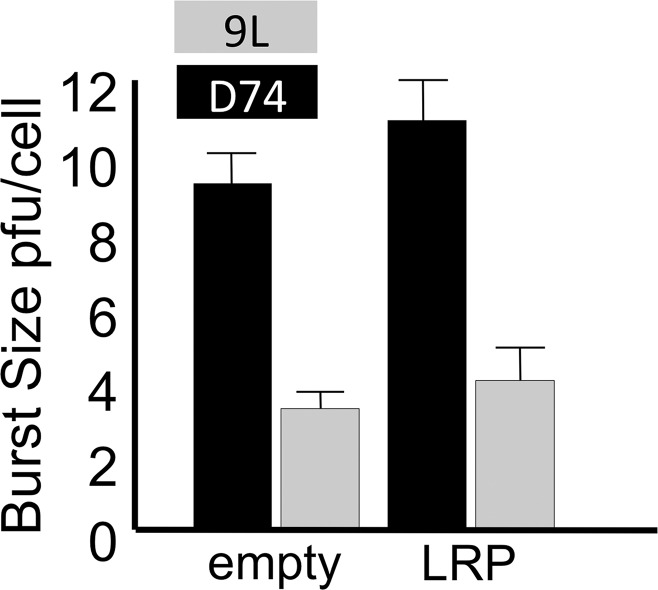
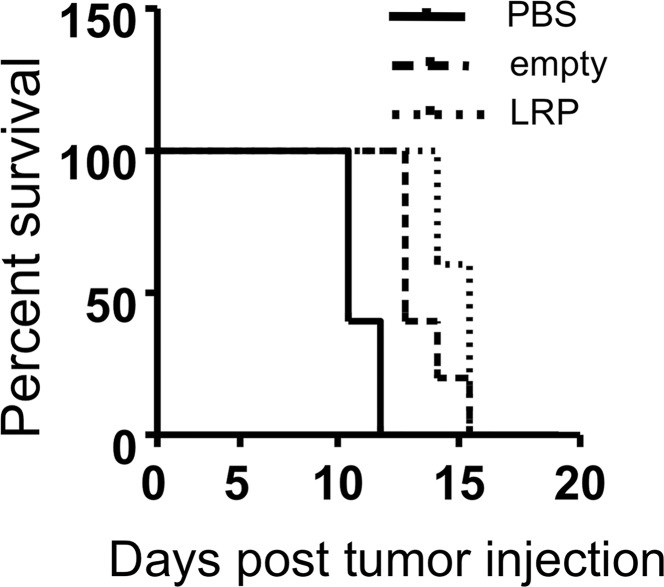
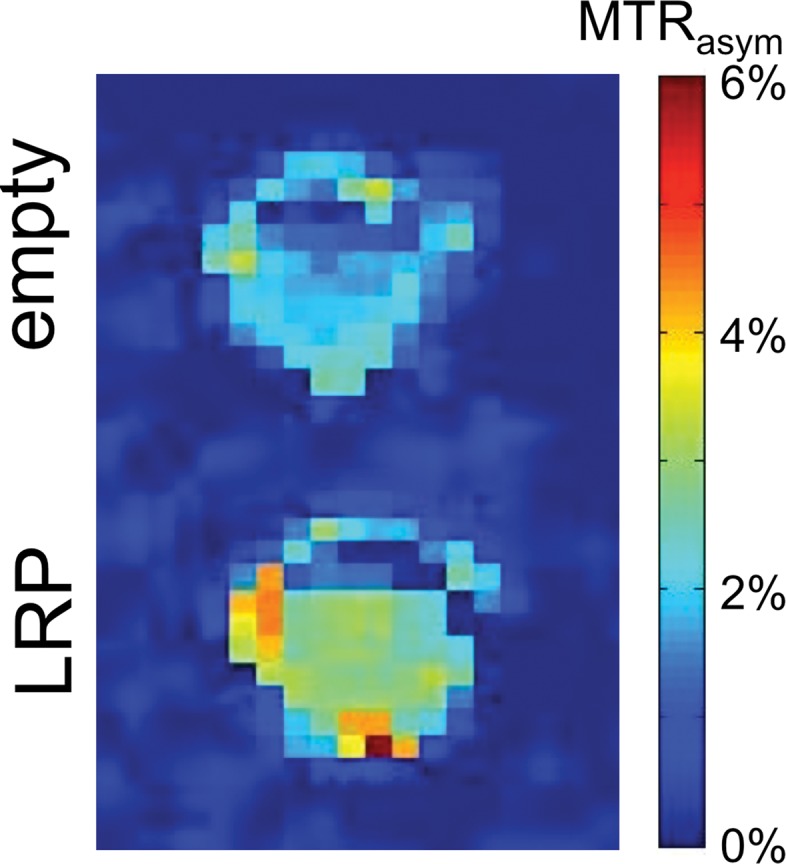
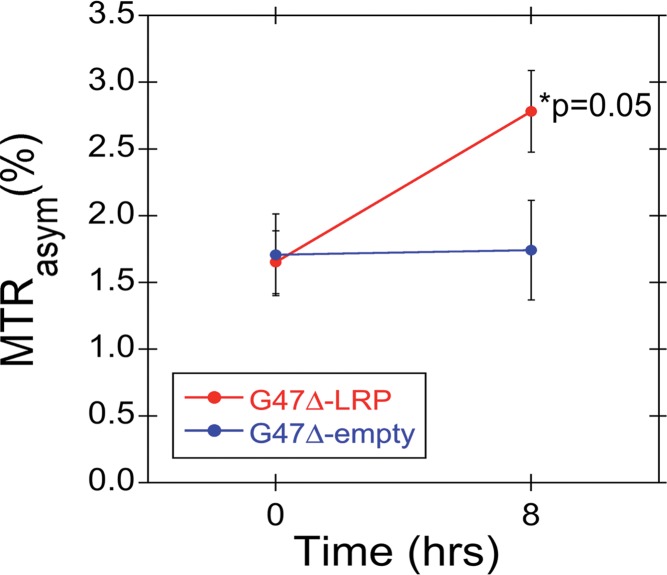
Materials and methods: The institutional subcommittee for research animal care approved all in vivo procedures. Oncolytic herpes simplex virus G47Δ, which carried the LRP gene, was constructed and tested for its capacity to replicate in cancer cells and express LRP in vitro. The LRP gene was detected through CEST imaging of lysates derived from cells infected with G47Δ-LRP or the control G47Δ-empty virus. G47Δ-LRP was then tested for its therapeutic effectiveness and detection with CEST MR imaging in vivo. Images of rat gliomas were acquired before and 8-10 hours after injection of G47Δ-LRP (n = 7) or G47Δ-empty virus (n = 6). Group comparisons were analyzed with a paired t test.

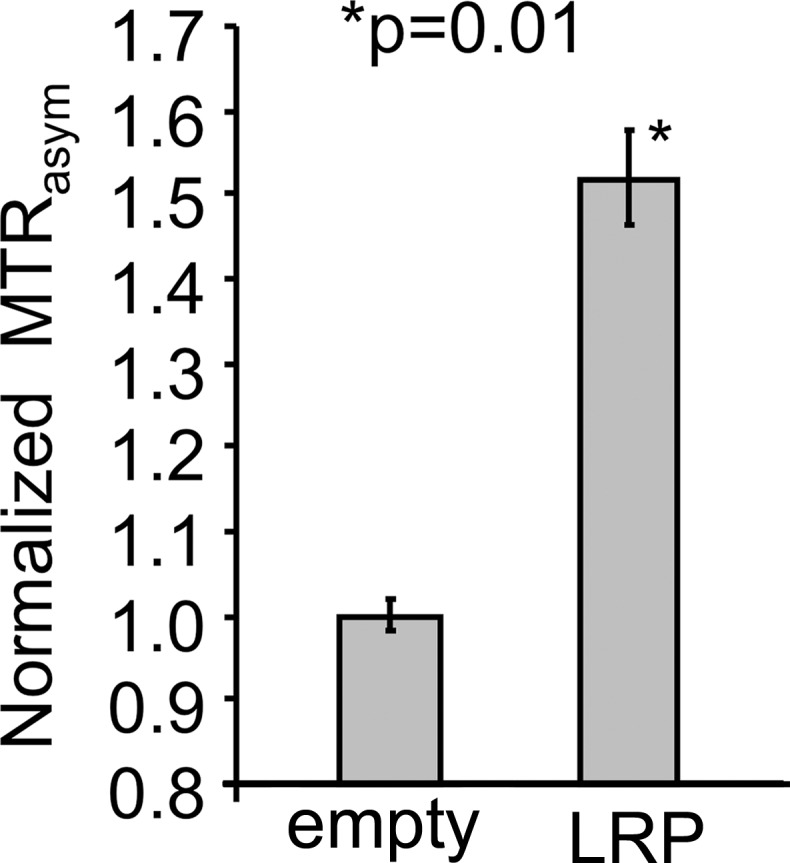
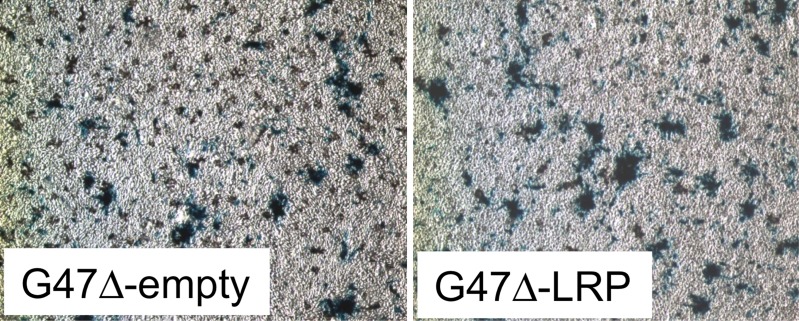
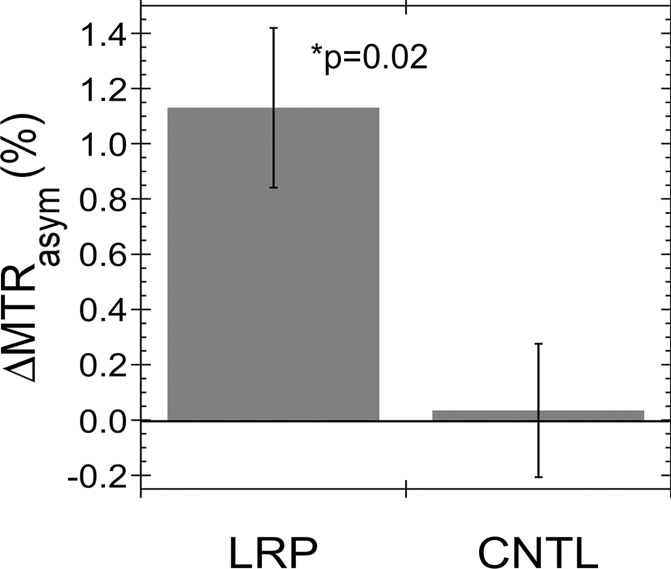
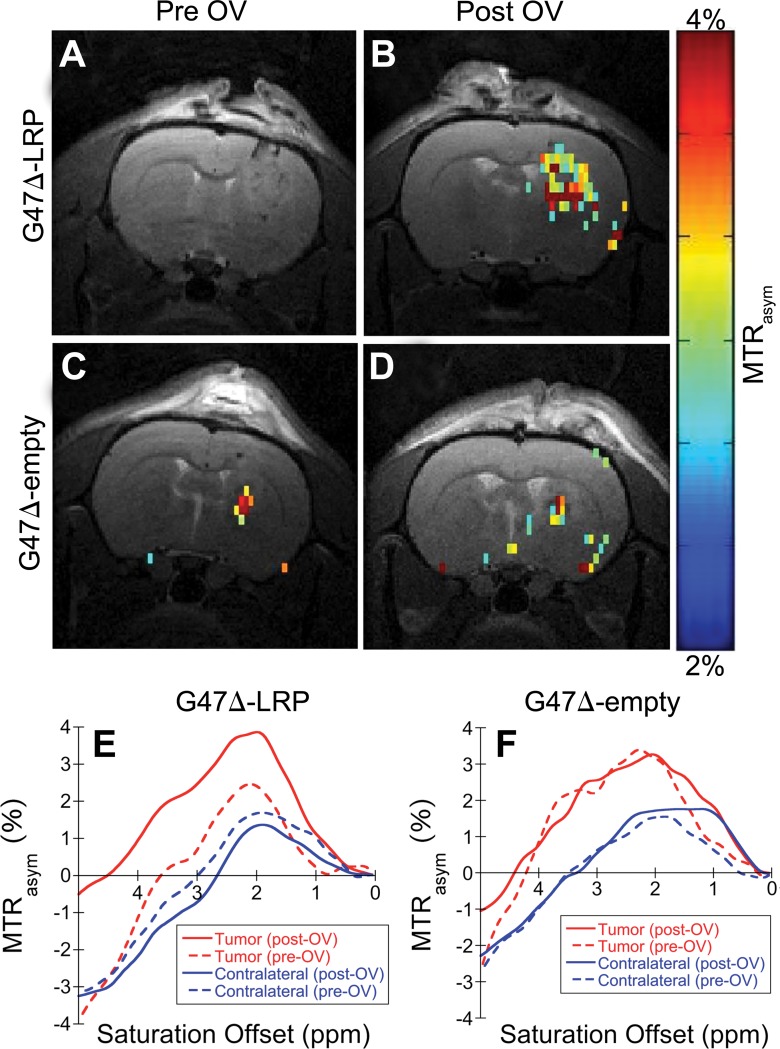
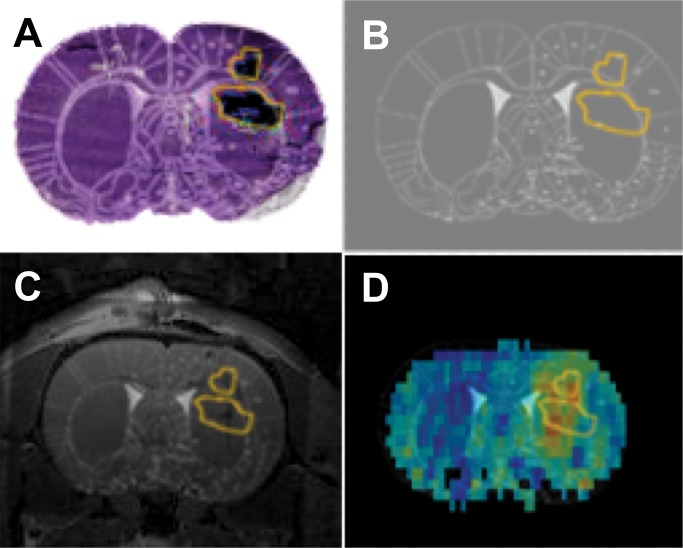
Results: No significant differences were observed in viral replication or therapeutic effectiveness between G47Δ-LRP and G47Δ-empty virus. An increase in CEST image contrast was observed in cell lysates (mean ± standard deviation, 0.52% ± 0.06; P = .01) and in tumors (1.1% ± 0.3, P = .02) after infection with G47Δ-LRP but not G47Δ-empty viruses. No histopathologic differences were observed between tumors infected with G47Δ-LRP and G47Δ-empty virus.

Conclusion: This study has demonstrated the ability of CEST MR imaging to show G47Δ-LRP at acute stages of viral infection. The introduction of the LRP transgene had no effect on the viral replication or therapeutic effectiveness. This can aid in development of the LRP gene as a reporter for the real-time detection of viral spread. Online supplemental material is available for this article.


Figures

Figure 1a:
Figure 1a:
Images illustrate the characterization of G47Δ-LRP. (a) Western blot shows the LRP bands after infection of Vero cells. Bands of approximately 10 kDa and 20 kDa are seen after infection of G47Δ-LRP (left) but not control virus (right). (b) Graph depicts single–time-point burst assay of G47Δ–empty virus and G47Δ-LRP in 9L and D74/HveC rat glioma cells. The graph shows that titers of both G47Δ-LRP and G47Δ–empty virus had increased 10-fold in 24 hours in D74/HveC cells and threefold in 9L cells, indicating that addition of the LRP gene did not disrupt viral replication capacity and that the viruses replicate better in D74/HveC cells than in 9L cells. (c) Kaplan-Meier survival plot for animals with intracranial D74/HveC gliomas treated with control solution (phosphate-buffered saline [PBS]), G47Δ–empty virus, and G47Δ-LRP in six rats each. A significant difference (P = .0032) in survival (mean ± standard deviation) was observed between control animals (mean survival, 12 days ± 0.5) and animals that were treated with virus (mean survival, 15 days ± 1). No difference in survival was observed between animals treated with either G47Δ-LRP or G47Δ–empty virus (P = .1).
Figure 1b:
Figure 1b:
Images illustrate the characterization of G47Δ-LRP. (a) Western blot shows the LRP bands after infection of Vero cells. Bands of approximately 10 kDa and 20 kDa are seen after infection of G47Δ-LRP (left) but not control virus (right). (b) Graph depicts single–time-point burst assay of G47Δ–empty virus and G47Δ-LRP in 9L and D74/HveC rat glioma cells. The graph shows that titers of both G47Δ-LRP and G47Δ–empty virus had increased 10-fold in 24 hours in D74/HveC cells and threefold in 9L cells, indicating that addition of the LRP gene did not disrupt viral replication capacity and that the viruses replicate better in D74/HveC cells than in 9L cells. (c) Kaplan-Meier survival plot for animals with intracranial D74/HveC gliomas treated with control solution (phosphate-buffered saline [PBS]), G47Δ–empty virus, and G47Δ-LRP in six rats each. A significant difference (P = .0032) in survival (mean ± standard deviation) was observed between control animals (mean survival, 12 days ± 0.5) and animals that were treated with virus (mean survival, 15 days ± 1). No difference in survival was observed between animals treated with either G47Δ-LRP or G47Δ–empty virus (P = .1).
Figure 1c:
Figure 1c:
Images illustrate the characterization of G47Δ-LRP. (a) Western blot shows the LRP bands after infection of Vero cells. Bands of approximately 10 kDa and 20 kDa are seen after infection of G47Δ-LRP (left) but not control virus (right). (b) Graph depicts single–time-point burst assay of G47Δ–empty virus and G47Δ-LRP in 9L and D74/HveC rat glioma cells. The graph shows that titers of both G47Δ-LRP and G47Δ–empty virus had increased 10-fold in 24 hours in D74/HveC cells and threefold in 9L cells, indicating that addition of the LRP gene did not disrupt viral replication capacity and that the viruses replicate better in D74/HveC cells than in 9L cells. (c) Kaplan-Meier survival plot for animals with intracranial D74/HveC gliomas treated with control solution (phosphate-buffered saline [PBS]), G47Δ–empty virus, and G47Δ-LRP in six rats each. A significant difference (P = .0032) in survival (mean ± standard deviation) was observed between control animals (mean survival, 12 days ± 0.5) and animals that were treated with virus (mean survival, 15 days ± 1). No difference in survival was observed between animals treated with either G47Δ-LRP or G47Δ–empty virus (P = .1).
Figure 2a:
Figure 2a:
Images derived from CEST MR imaging of G47Δ–empty virus and G47Δ-LRP–infected cell lysates. (a) Representative MTRasym map for phantoms that contained lysates of D74/HveC cells infected with either G47Δ–empty virus (upper half of the image) or G47Δ-LRP (lower half of the image). (b) Graph shows quantification of the MTRasym induced by G47Δ-LRP in these cells. Significantly (P = .01) higher MTRasym was observed in D74/HveC cell lysates infected with G47Δ-LRP (1.52% ± 0.06) compared with G47Δ–empty virus (1.0% ± 0.02). (c) Photomicrographs (lacZ staining for β-galactosidase activity; original magnification, ×10) show that staining for viral β-galactosidase activity in cells infected with G47Δ-LRP or G47Δ–empty virus indicate equal spread for the two viruses (approximately 20% of cells were infected 18 hours after infection).
Figure 2b:
Figure 2b:
Images derived from CEST MR imaging of G47Δ–empty virus and G47Δ-LRP–infected cell lysates. (a) Representative MTRasym map for phantoms that contained lysates of D74/HveC cells infected with either G47Δ–empty virus (upper half of the image) or G47Δ-LRP (lower half of the image). (b) Graph shows quantification of the MTRasym induced by G47Δ-LRP in these cells. Significantly (P = .01) higher MTRasym was observed in D74/HveC cell lysates infected with G47Δ-LRP (1.52% ± 0.06) compared with G47Δ–empty virus (1.0% ± 0.02). (c) Photomicrographs (lacZ staining for β-galactosidase activity; original magnification, ×10) show that staining for viral β-galactosidase activity in cells infected with G47Δ-LRP or G47Δ–empty virus indicate equal spread for the two viruses (approximately 20% of cells were infected 18 hours after infection).
Figure 2c:
Figure 2c:
Images derived from CEST MR imaging of G47Δ–empty virus and G47Δ-LRP–infected cell lysates. (a) Representative MTRasym map for phantoms that contained lysates of D74/HveC cells infected with either G47Δ–empty virus (upper half of the image) or G47Δ-LRP (lower half of the image). (b) Graph shows quantification of the MTRasym induced by G47Δ-LRP in these cells. Significantly (P = .01) higher MTRasym was observed in D74/HveC cell lysates infected with G47Δ-LRP (1.52% ± 0.06) compared with G47Δ–empty virus (1.0% ± 0.02). (c) Photomicrographs (lacZ staining for β-galactosidase activity; original magnification, ×10) show that staining for viral β-galactosidase activity in cells infected with G47Δ-LRP or G47Δ–empty virus indicate equal spread for the two viruses (approximately 20% of cells were infected 18 hours after infection).
Figure 3a:
Figure 3a:
Graphs show the change in MTRasym after intratumoral injection of G47Δ-LRP in vivo. (a) Graph shows the mean MTRasym (± standard error) for G47Δ-LRP (n = 7) and G47Δ–empty virus (n = 6) before and 8 hours after virus injection. MTRasym increased significantly (P = .05) from 1.7% ± 0.2 (previrus injection) to 2.8% ± 0.3 (postvirus injection) in tumors treated with G47Δ-LRP. No change in MTRasym was observed in tumors treated with G47Δ–empty virus (MTRasym of 1.7% ± 0.3 previrus injection and 1.7% ± 0.4 postvirus injection). (b) The bars of the graph indicate the mean of the MTRasym difference (ΔMTRasym) between the two time points (previrus injection and 8–10 hours postvirus injection) for each virus with a significant (P = .02) increase of 1.1% ± 0.3 observed for G47Δ-LRP–infected tumors and no increase for G47Δ–empty virus–infected tumors (0.0% ± 0.2). CNTL = control.
Figure 3b:
Figure 3b:
Graphs show the change in MTRasym after intratumoral injection of G47Δ-LRP in vivo. (a) Graph shows the mean MTRasym (± standard error) for G47Δ-LRP (n = 7) and G47Δ–empty virus (n = 6) before and 8 hours after virus injection. MTRasym increased significantly (P = .05) from 1.7% ± 0.2 (previrus injection) to 2.8% ± 0.3 (postvirus injection) in tumors treated with G47Δ-LRP. No change in MTRasym was observed in tumors treated with G47Δ–empty virus (MTRasym of 1.7% ± 0.3 previrus injection and 1.7% ± 0.4 postvirus injection). (b) The bars of the graph indicate the mean of the MTRasym difference (ΔMTRasym) between the two time points (previrus injection and 8–10 hours postvirus injection) for each virus with a significant (P = .02) increase of 1.1% ± 0.3 observed for G47Δ-LRP–infected tumors and no increase for G47Δ–empty virus–infected tumors (0.0% ± 0.2). CNTL = control.
Figure 4:
Figure 4:
Images depict the overlay of representative MTRasym maps onto T2-weighted anatomic images. A–D, Representative MTRasym maps (color scale) acquired with a saturation frequency offset of 3.6 ppm and overlaid onto the associated T2-weighted (gray-scale) images obtained, A, C, before and, B, D, 8 hours after injection of, B, G47Δ-LRP and, D, G47Δ–empty virus. A significant increase in MTRasym is observed after virus injection for, B, the G47Δ-LRP virus but not, D, the G47Δ–empty virus. E, F, Plots for the MTRasym as a function of the saturation frequency offset for tumor (red lines) and contralateral hemisphere (blue lines) ROIs acquired before (dashed lines) and after (solid lines) injection of, E, G47Δ-LRP and, F, G47Δ–empty virus. A significant increase in MTRasym profile after virus injection is only observed for the tumor ROI of the G47Δ-LRP–infected tumor. No significant differences are observed between previrus injections and postvirus injections for contralateral tissue ROIs or the tumor ROI of the G47Δ–empty–infected tumor. OV = oncolytic virus.
Figure 5:
Figure 5:
Images demonstrate coregistration of histologic findings and MR images. A, Histologic tissue slice overlaid onto the coregistered rat brain atlas tissue section. B, Overlay of the ROI encompasses the β-galactosidase–stained area of the histologic tissue slice with the rat brain atlas tissue section. C, β-galactosidase ROI overlaid onto the coregistered T2-weighted MR and rat brain atlas images. D, Coregistered β-galactosidase ROI overlaid onto the rat brain atlas section and MTRasym map.

Comment in

References

    1. Sherry AD, Woods M. Chemical exchange saturation transfer contrast agents for magnetic resonance imaging. Annu Rev Biomed Eng 2008;10:391–411. - PMC - PubMed
    1. van Zijl PC, Yadav NN. Chemical exchange saturation transfer (CEST): what is in a name and what isn’t? Magn Reson Med 2011;65(4):927–948. - PMC - PubMed
    1. Gilad AA, McMahon MT, Walczak P, et al. . Artificial reporter gene providing MRI contrast based on proton exchange. Nat Biotechnol 2007;25(2):217–219. - PubMed
    1. Fulci G, Chiocca EA. The status of gene therapy for brain tumors. Expert Opin Biol Ther 2007;7(2):197–208. - PMC - PubMed
    1. Russell SJ, Peng KW, Bell JC. Oncolytic virotherapy. Nat Biotechnol 2012;30(7):658–670. - PMC - PubMed

Publication types