Review
. 2015 Feb 12;7(1):353-81.
doi: 10.3390/cancers7010353.

Proton radiobiology

Affiliations
Review

Proton radiobiology

Francesco Tommasino et al. Cancers (Basel). .

Abstract

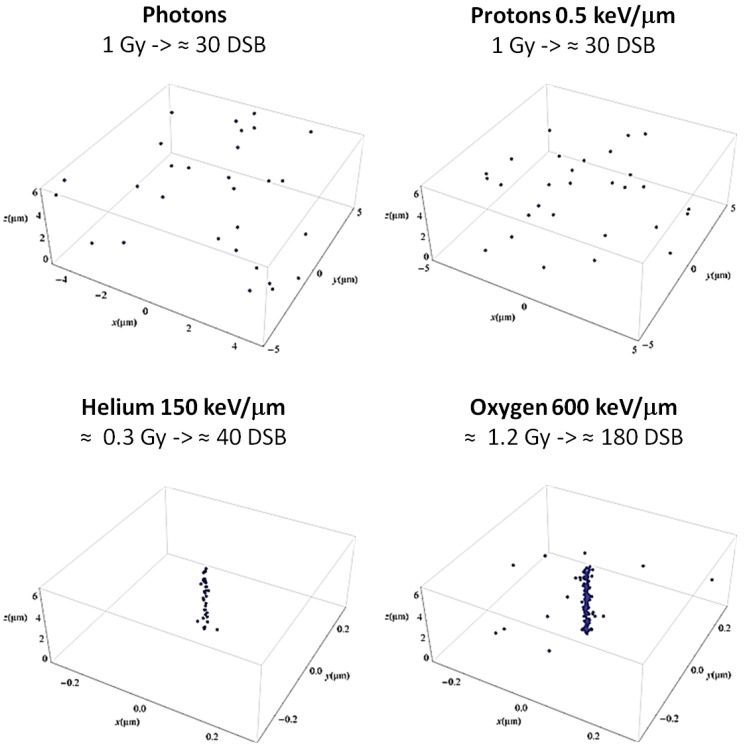
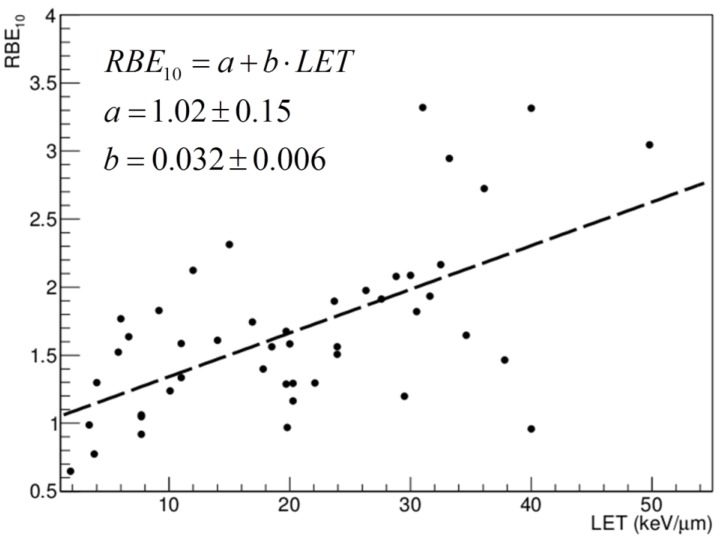
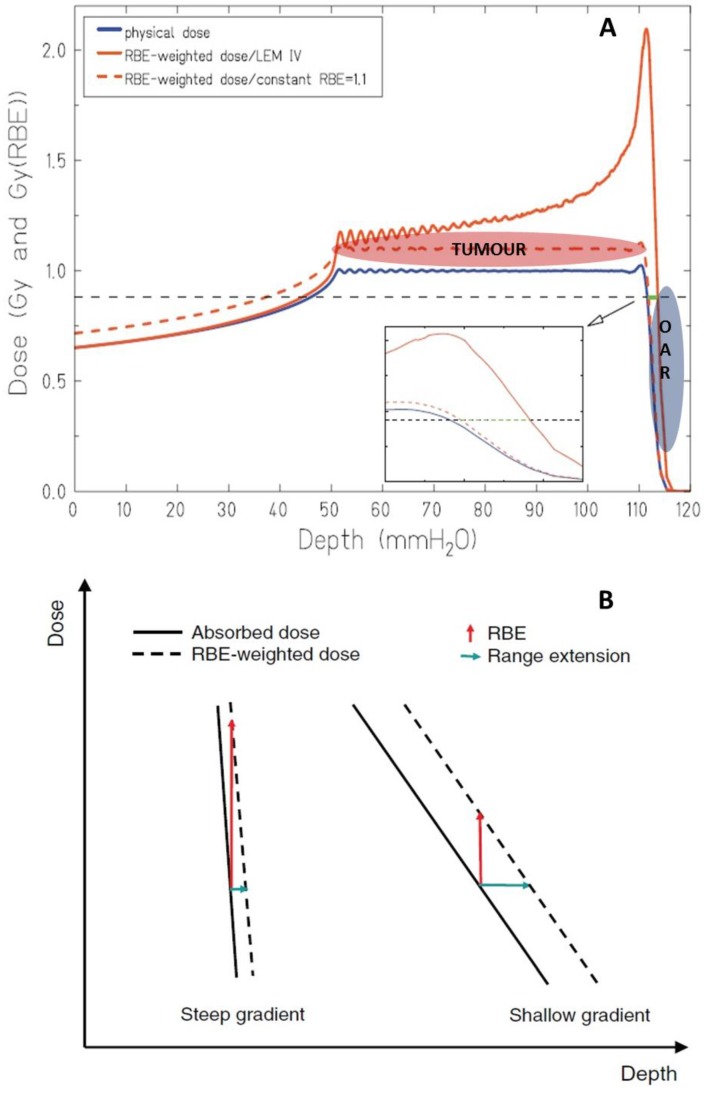
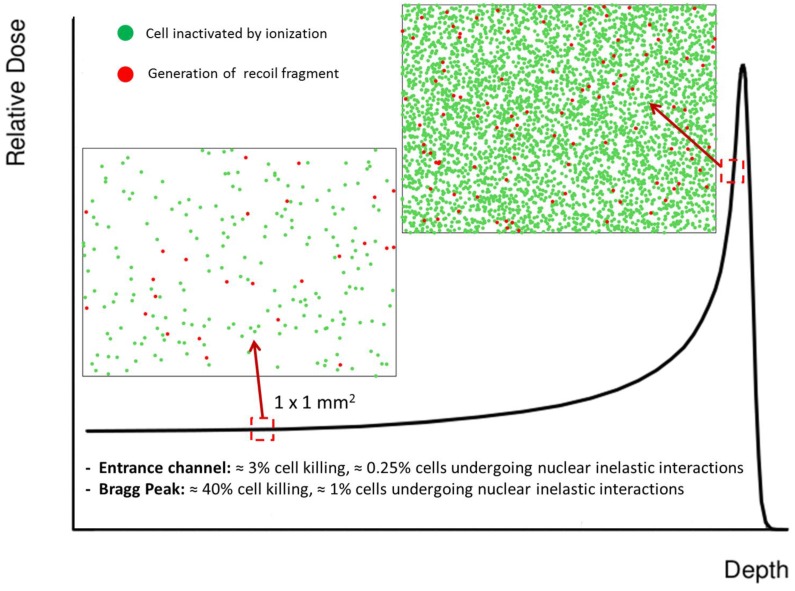
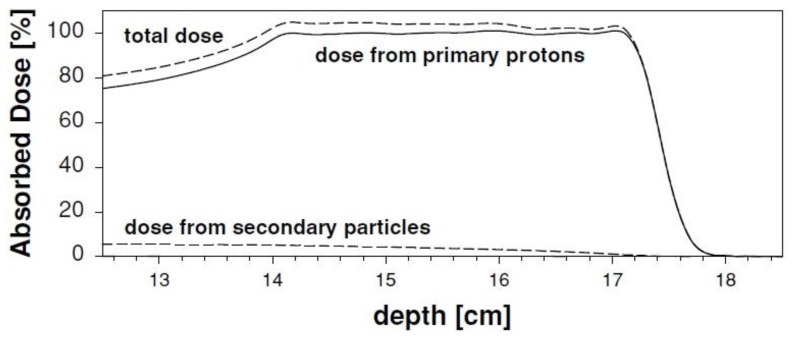
In addition to the physical advantages (Bragg peak), the use of charged particles in cancer therapy can be associated with distinct biological effects compared to X-rays. While heavy ions (densely ionizing radiation) are known to have an energy- and charge-dependent increased Relative Biological Effectiveness (RBE), protons should not be very different from sparsely ionizing photons. A slightly increased biological effectiveness is taken into account in proton treatment planning by assuming a fixed RBE of 1.1 for the whole radiation field. However, data emerging from recent studies suggest that, for several end points of clinical relevance, the biological response is differentially modulated by protons compared to photons. In parallel, research in the field of medical physics highlighted how variations in RBE that are currently neglected might actually result in deposition of significant doses in healthy organs. This seems to be relevant in particular for normal tissues in the entrance region and for organs at risk close behind the tumor. All these aspects will be considered and discussed in this review, highlighting how a re-discussion of the role of a variable RBE in proton therapy might be well-timed.


Figures

Figure 1
Figure 1
Simulated patterns of DSB distribution after photon and ion irradiation in a typical cell nucleus (radius of ≈5 μm). Protons are shown at the typical LET assumed in the entrance channel, resulting in a photon-like distribution of lesions (sparsely ionizing radiation). Low energy alpha particles and oxygen ions are also shown as representative of the typical target fragments produced in PT. In this case, a considerable dose is released in the nucleus after a single particle traversal, and a high dose is released close to the particle track, resulting in the induction of an increased number of close-by DSB (densely ionizing radiation). The DSB distributions were calculated with the Local Effect Model (LEM) [14,15], where an amorphous track structure model is adopted.
Figure 2
Figure 2
RBE values for 10% survival, as extracted from PIDE [7]. The dashed line shows the tendency to an increase in RBE with LET and is the result of a linear fit. All values extracted from the database were pooled together, independent of α/β ratio. This is allowed when looking at RBE for 10% survival; the consistency of this approach was checked by separate fit analysis (not shown). Interestingly, the fit parameters are in line with those presented by Paganetti in his recent review [6]. In that case, when looking at a restricted range of dose-averaged LET<15keV/μm, the linear fit produced RBE2Gy = 1.02 + 0.052xLETd and RBE6Gy = 0.99 + 0.042xLETd.
Figure 3
Figure 3
In panel (A) physical and RBE-weighted dose are shown, as obtained with a constant and with a variable RBE. Special emphasis is given to the differences at the distal fall-off, where OAR might be located. In panel (B) the different impact in terms of range extension that can be expected when comparing steep and shallow dose gradients is shown. Adapted from Grün et al. [103].
Figure 4
Figure 4
Fraction of primary protons undergoing inelastic nuclear reactions along the Bragg peak in a water target for 250 MeV initial beam energy (black symbols). The corresponding total reaction cross section values at the given positions were calculated according to the database currently adopted in the treatment planning system TRiP98 [115,116] (red symbols). The inset shows a zoom in the last 4 cm of range.
Figure 5
Figure 5
The figure schematically shows the impact of ionization and target fragmentation in tissue sections of 1 × 1 mm2. The effect is considered at two different positions along the depth-dose profile. The LEM code was used to estimate cell survival probability [14,15]. The expected contribution of target fragments is calculated assuming that in water about 1% of primary protons undergo nuclear inelastic interactions per traversed cm. We chose a fluence of 2.5 × 10⁸ p/cm2 for the primary beam, and assumed that cell nuclei cover an area of ≈100 μm2. This means that we can expect an average of 250 particles traversing a nucleus. When following protons traversing 1 mm of tissue (stack of 100 cells), we thus expect an average of 0.25 protons undergoing inelastic nuclear reactions. In other words, we will have one fragmentation event every fourth stack of cells, which translates to what is shown in the figure. Importantly, we only show cells where target fragments are generated, but a fraction of those fragments might have enough energy to traverse a few cell nuclei before coming to rest. This is true especially for light fragments (see also Table 1). Even though both the contributions of ionization and fragmentation increase when approaching the Bragg peak, at that position the biological effect is mainly due to ionization events. On the contrary, in the entrance channel the predicted survival is high, and therefore a significant role might be played by low-energy target fragments.
Figure 6
Figure 6
Experimental data of cell inactivation obtained with CHO cells after irradiation with 60Co γ-rays (circles) and with 160 MeV protons (triangles) are shown, together with modeling analysis. The fitted curves show that γ-ray data are well described by the model when nuclear reactions are not considered (dashed line), while a good fit is obtained for proton data by including fragmentation processes in the model (solid line). Adapted from Cucinotta et al. [120].
Figure 7
Figure 7
The total absorbed dose along a proton SOBP is shown, by separating contributions coming from primary protons and from secondary fragments (A < 5). Adapted from Paganetti [114].

Similar articles

Cited by

References

    1. Jermann M. Particle therapy statistics in 2013. Int. J. Part. Ther. 2014;1:40–43. doi: 10.14338/IJPT.14-editorial-2.1. - DOI
    1. Loeffler J.S., Durante M. Charged particle therapy--optimization, challenges and future directions. Nat. Rev. Clin. Oncol. 2013;10:411–424. doi: 10.1038/nrclinonc.2013.79. - DOI - PubMed
    1. Lomax A.J., Bortfeld T., Goitein G., Debus J., Dykstra C., Tercier P.A., Coucke P.A., Mirimanoff R.O. A treatment planning inter-comparison of proton and intensity modulated photon radiotherapy. Radiother. Oncol. 1999;51:257–271. doi: 10.1016/S0167-8140(99)00036-5. - DOI - PubMed
    1. Paganetti H., Niemierko A., Ancukiewicz M., Gerweck L.E., Goitein M., Loeffler J.S., Suit H.D. Relative biological effectiveness (RBE) values for proton beam therapy. Int. J. Radiat. Oncol. Biol. Phys. 2002;53:407–421. doi: 10.1016/S0360-3016(02)02754-2. - DOI - PubMed
    1. Goodhead D.T. Energy deposition stochastics and track structure: What about the target? Radiat. Prot. Dosimetry. 2006;122:3–15. doi: 10.1093/rpd/ncl498. - DOI - PubMed

LinkOut - more resources