

Microfabricated infuse-withdraw micropump component for an integrated inner-ear drug-delivery platform
- PMID: 25686902
- PMCID: PMC12134881
- DOI: 10.1007/s10544-014-9923-8
Microfabricated infuse-withdraw micropump component for an integrated inner-ear drug-delivery platform
Abstract
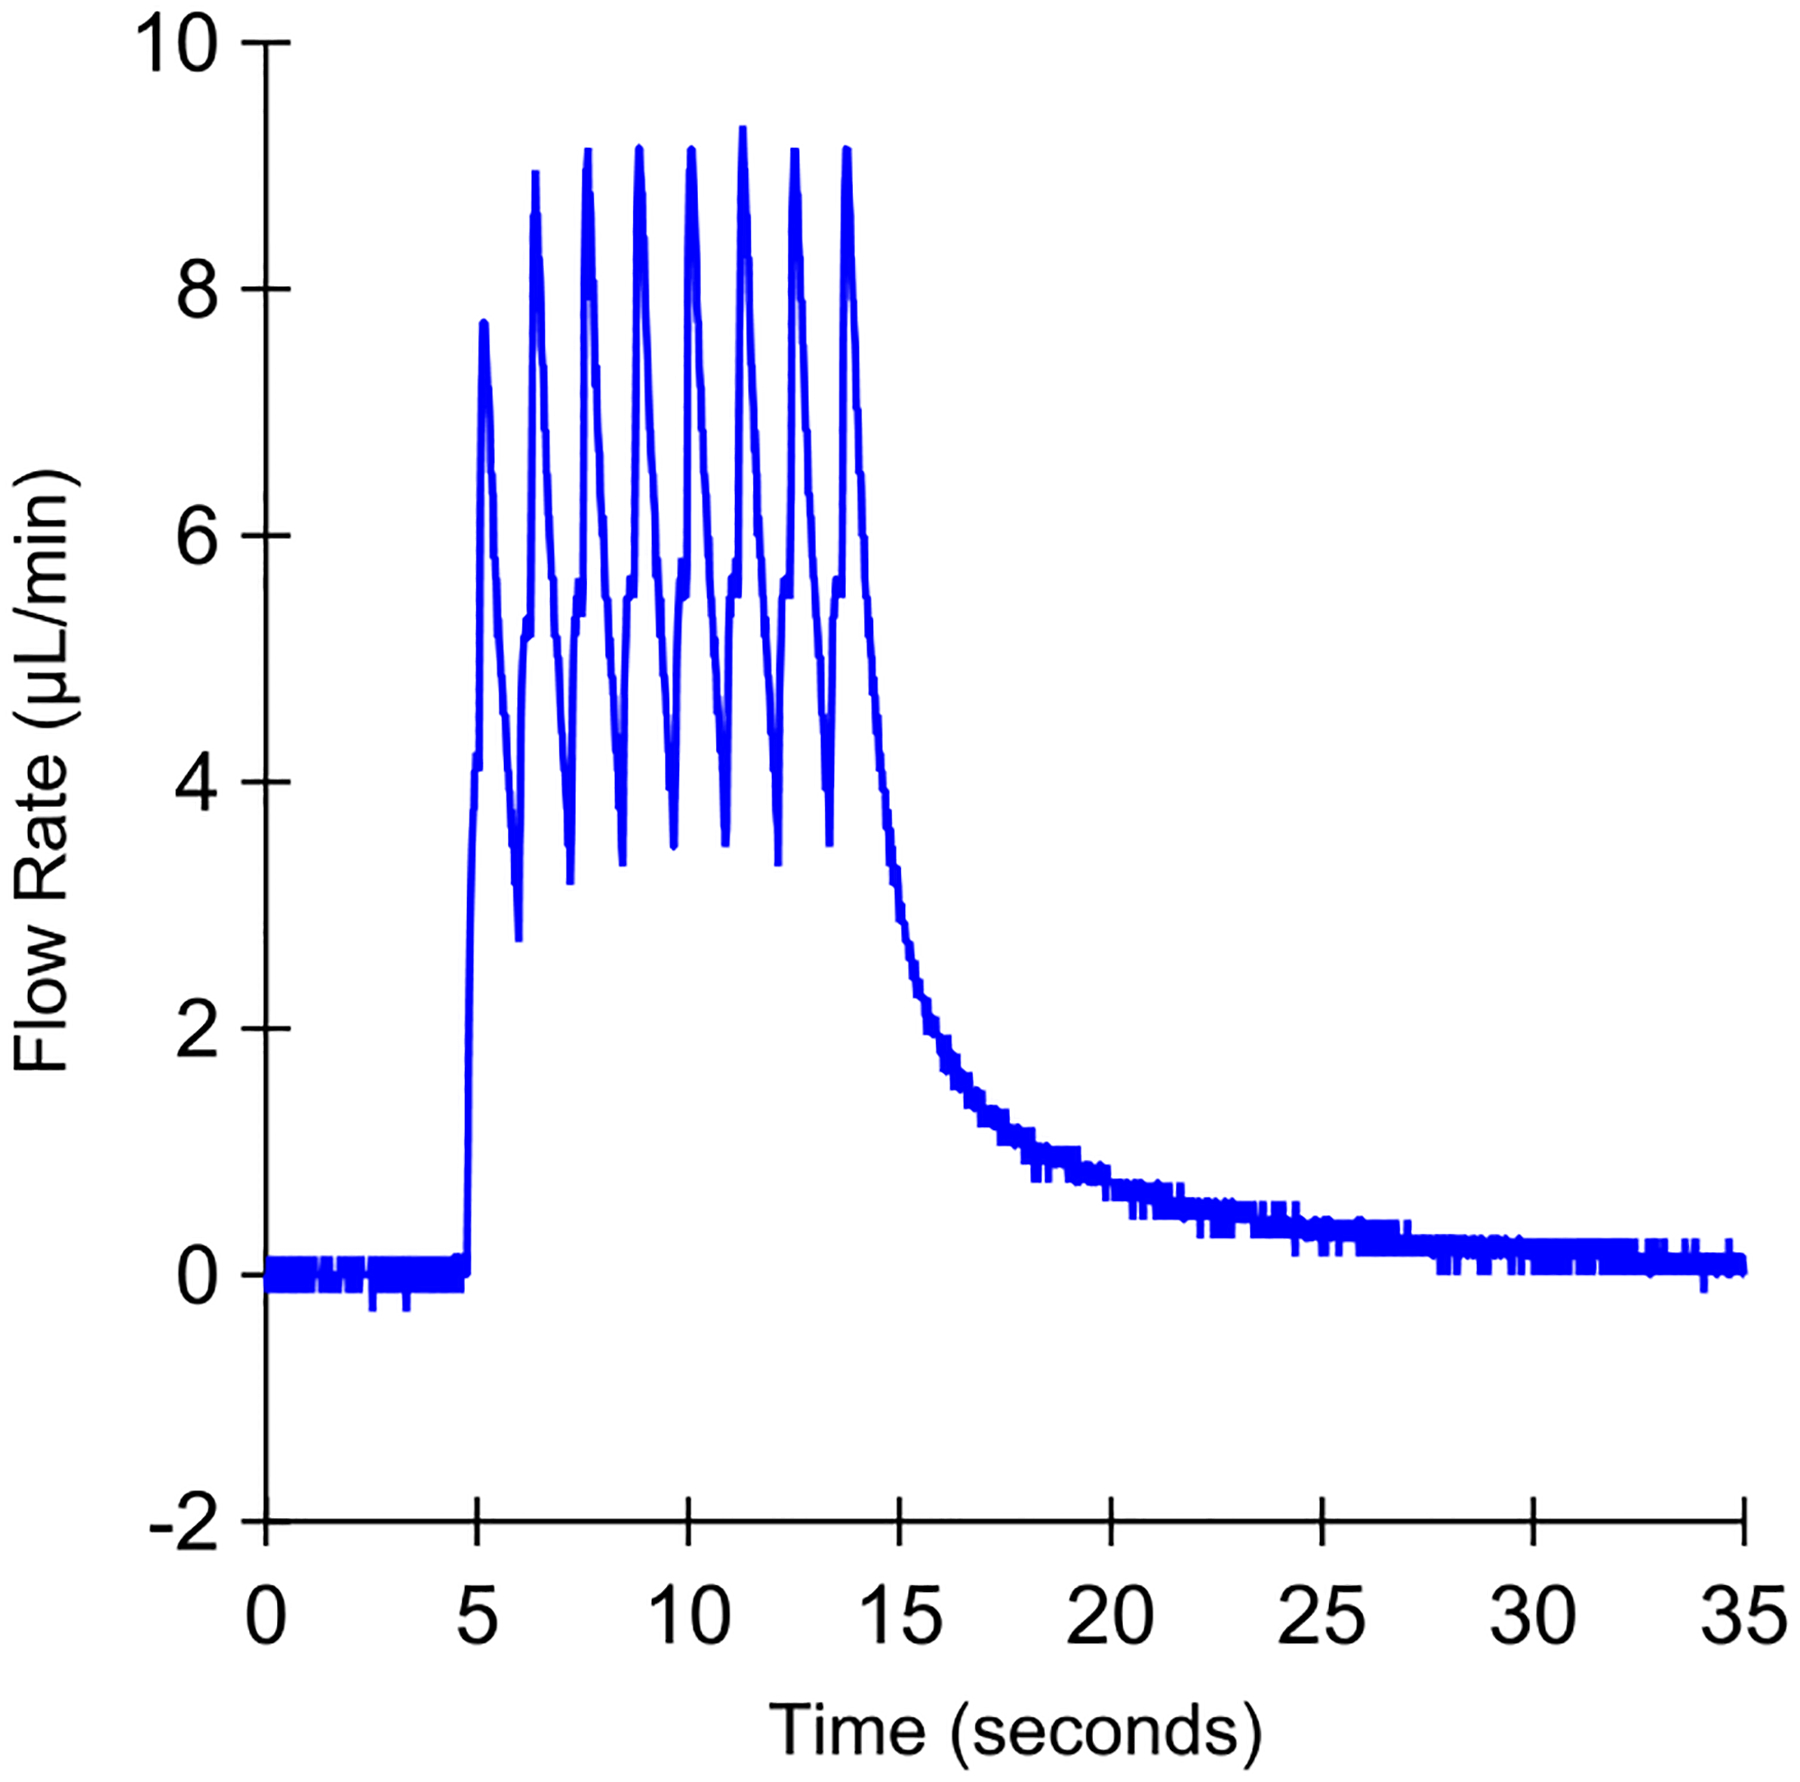
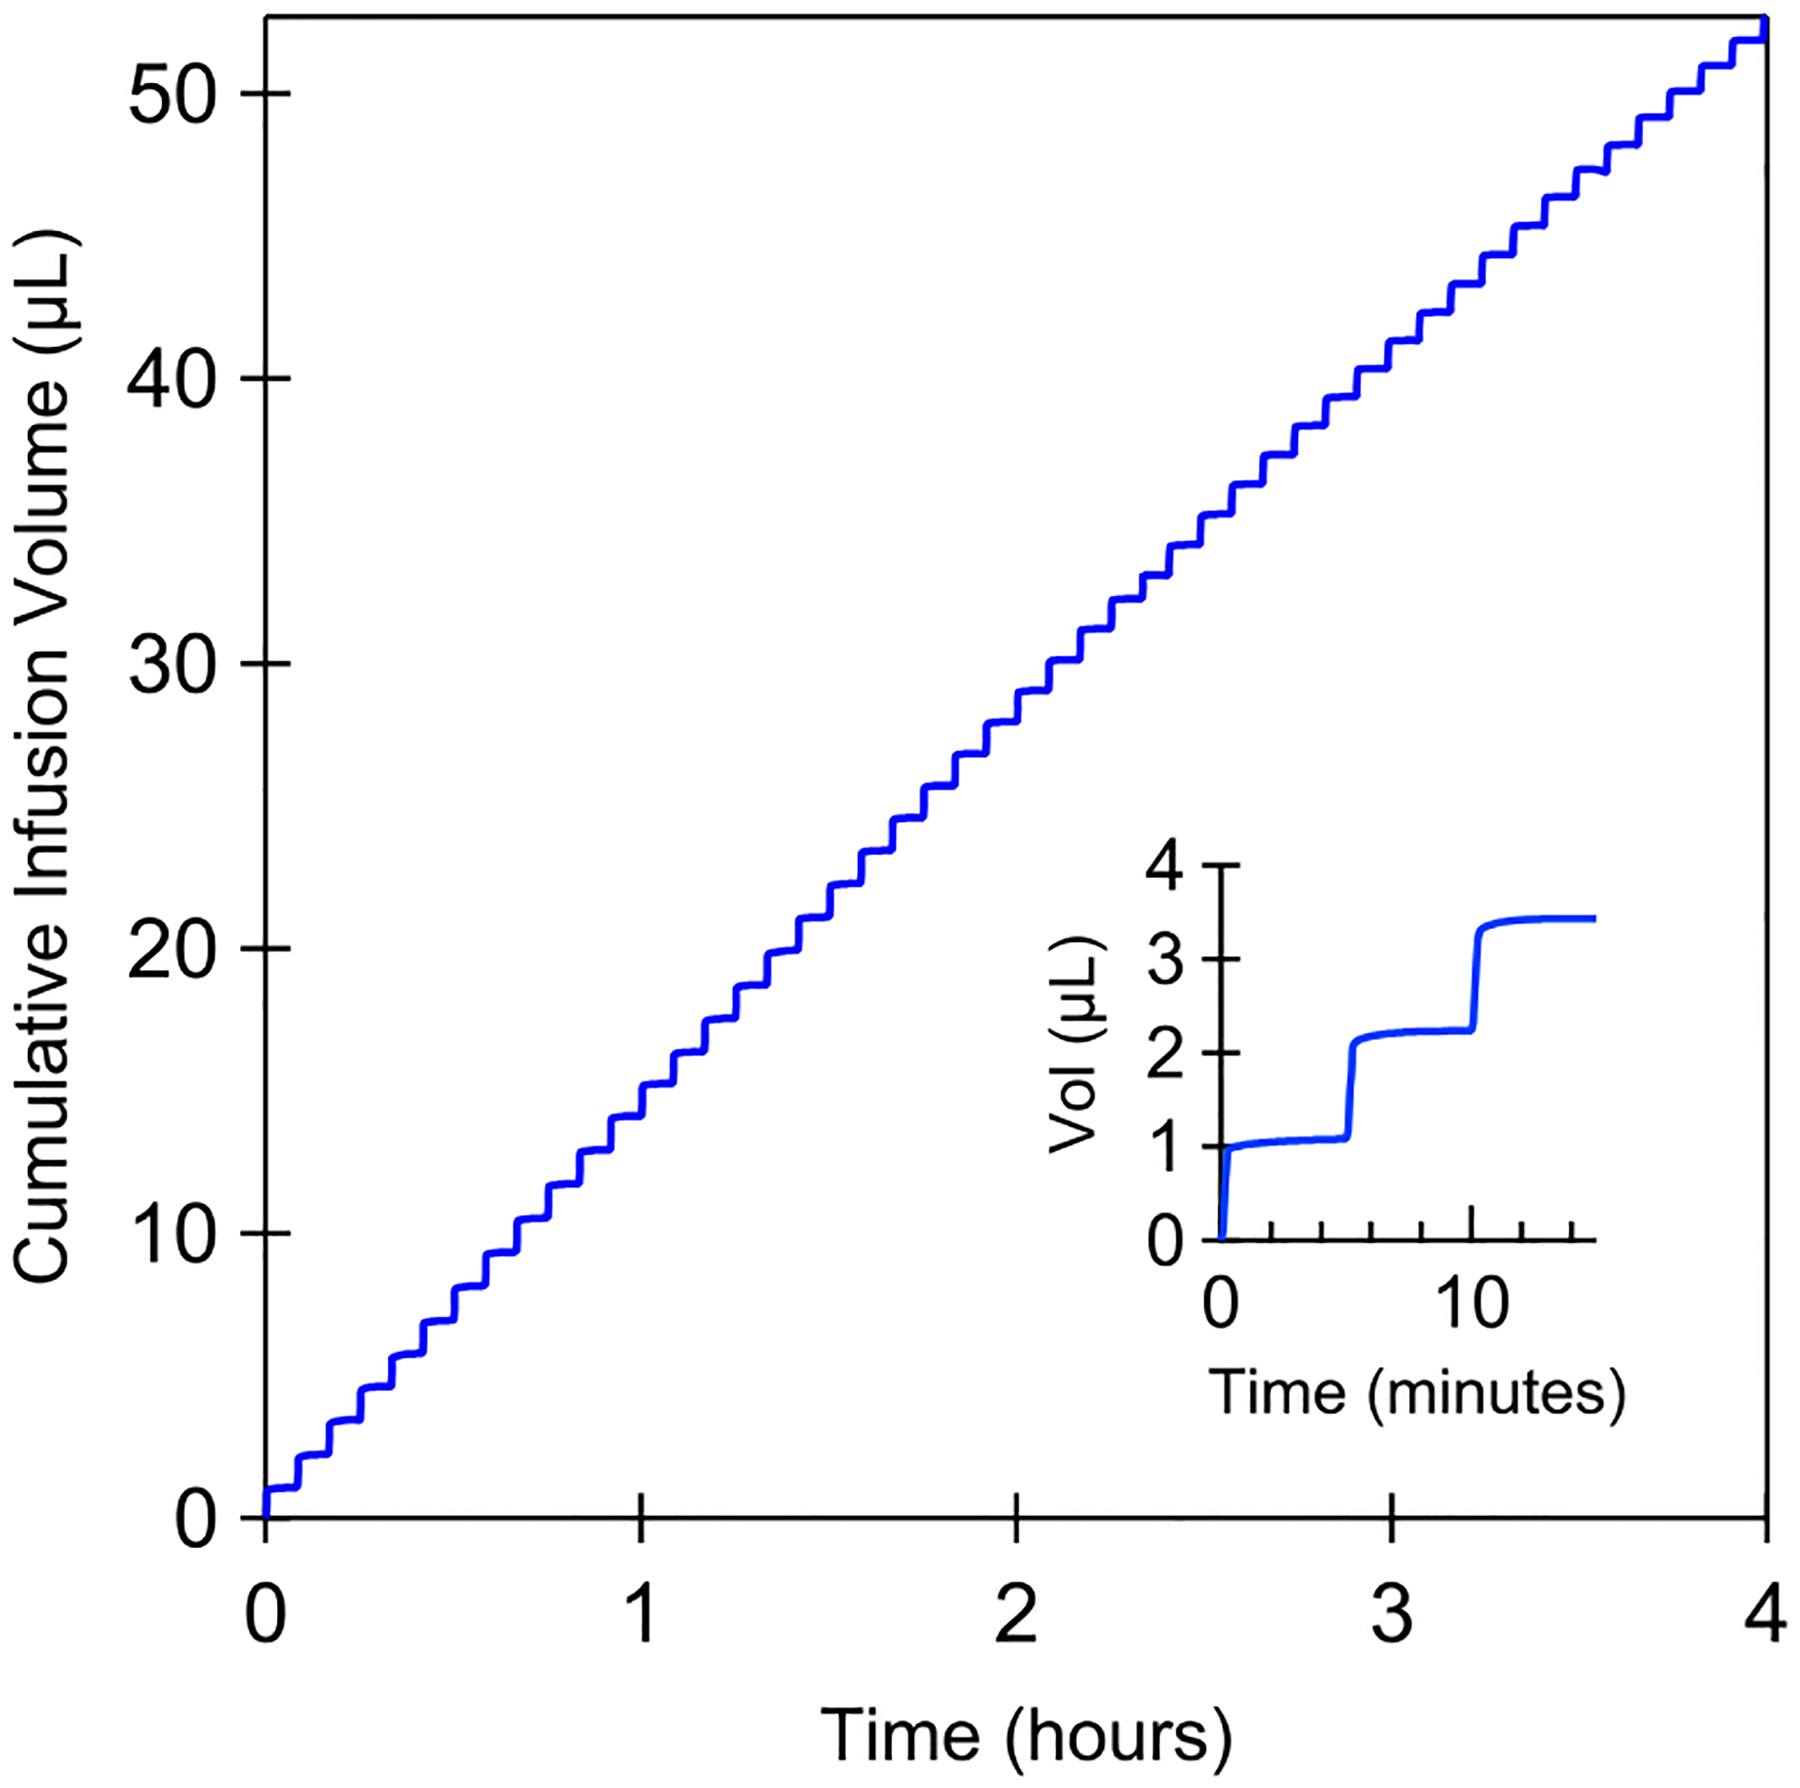
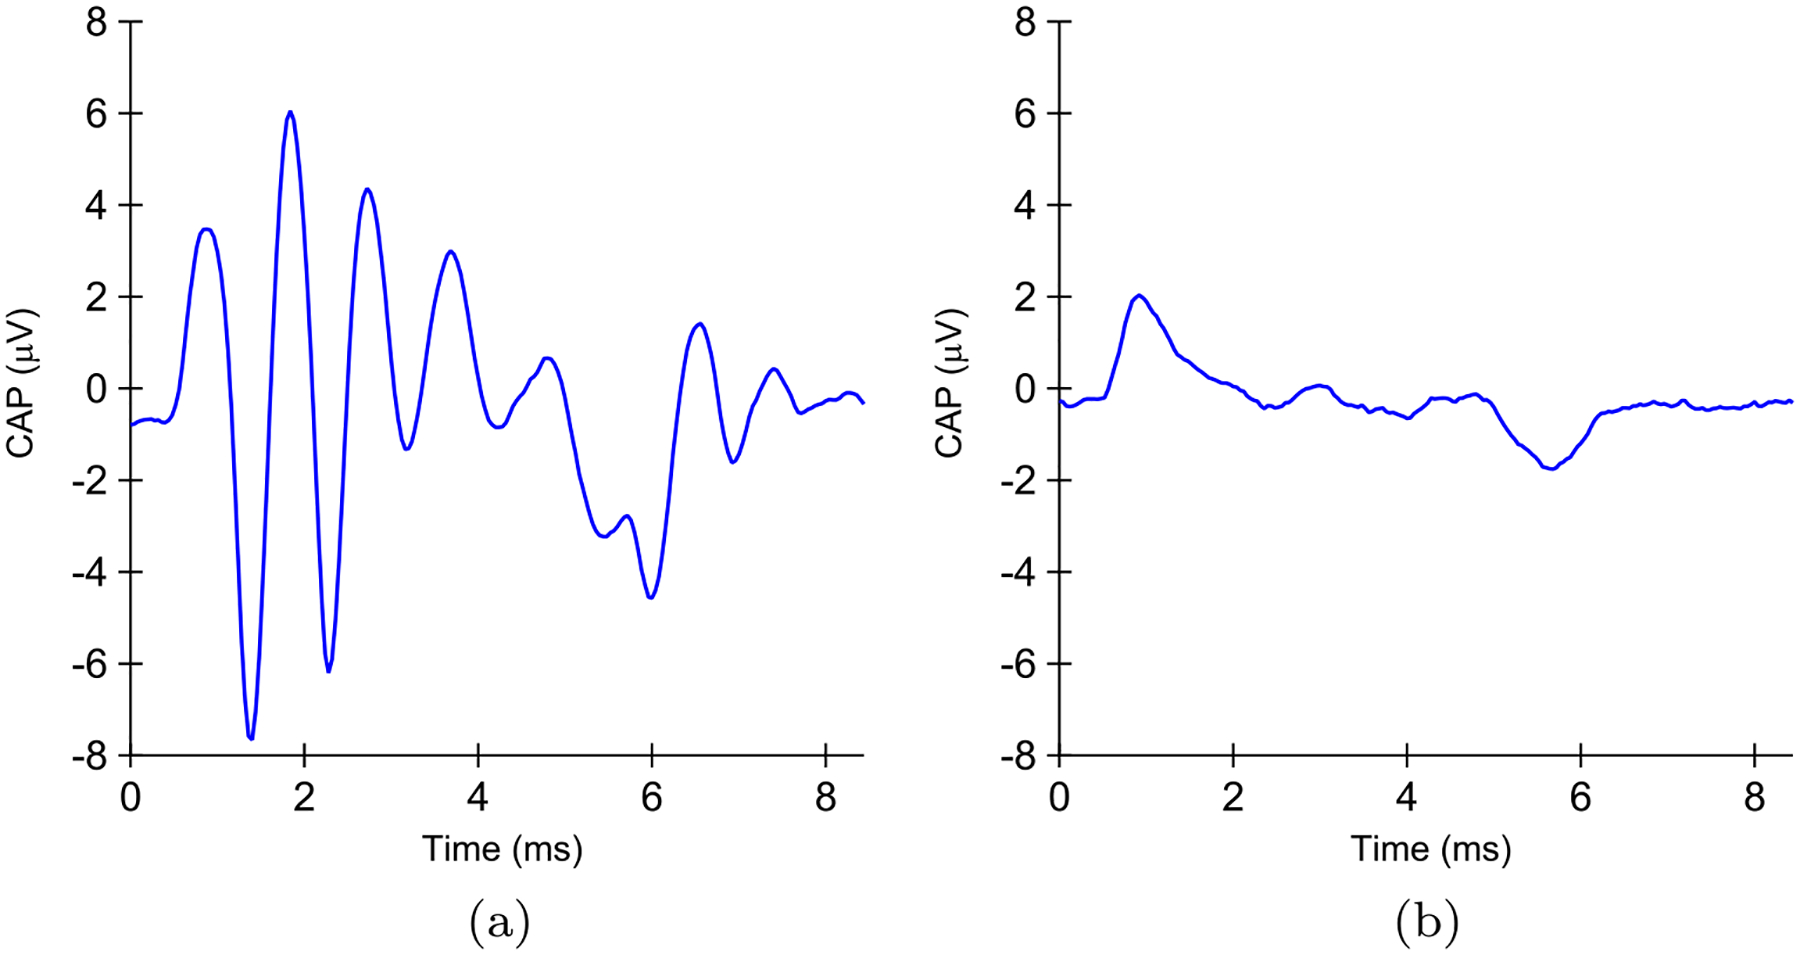
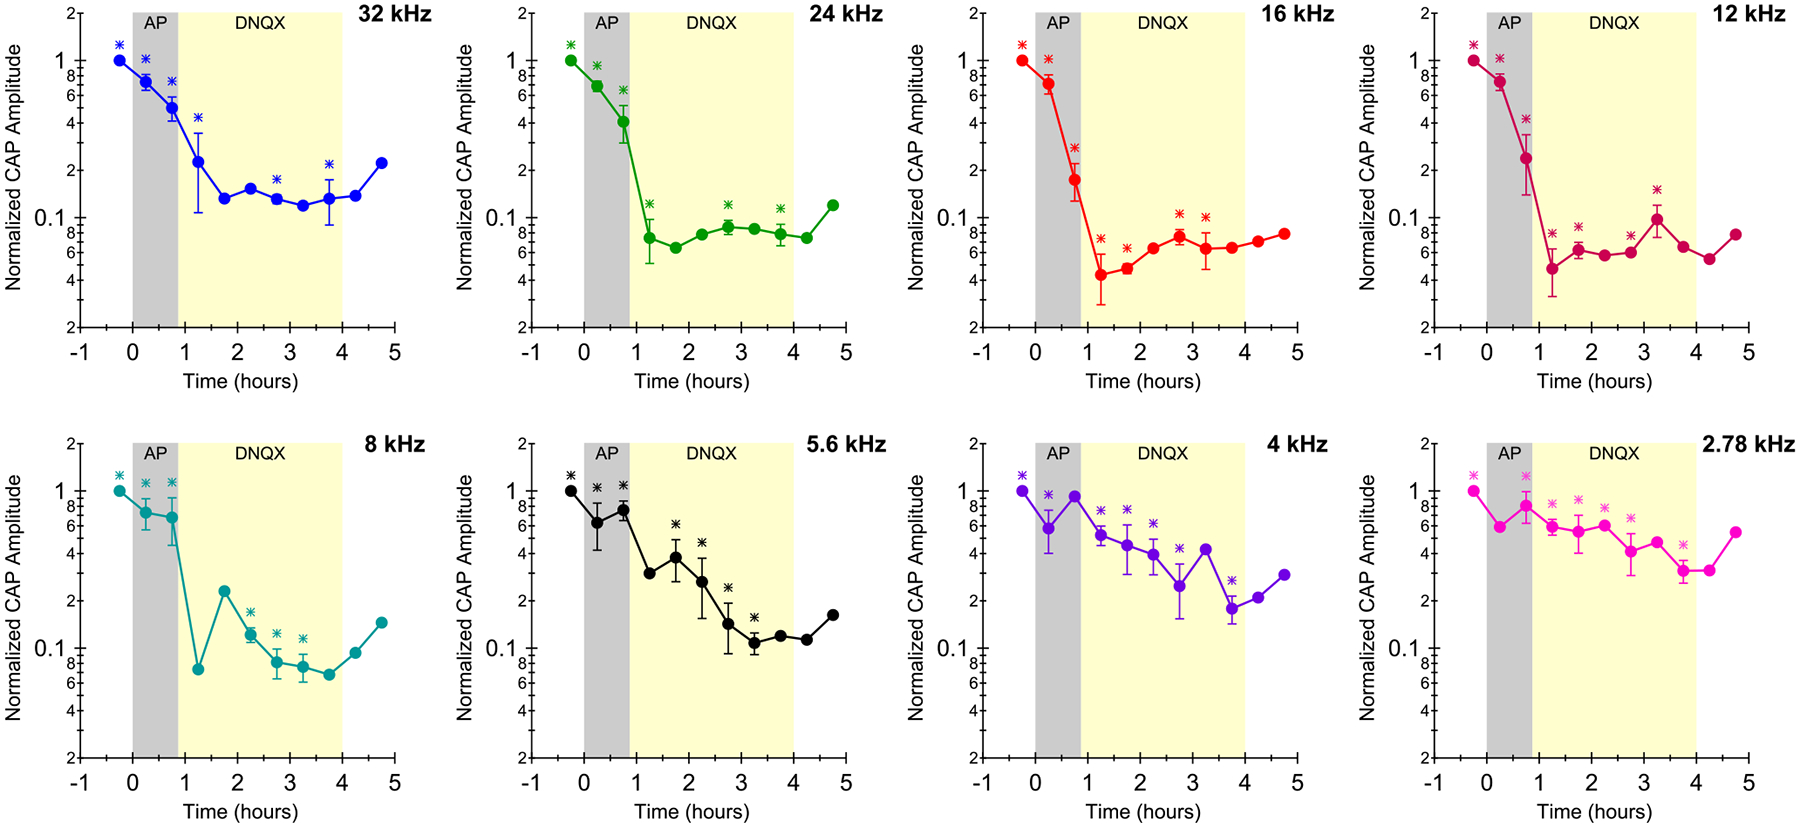
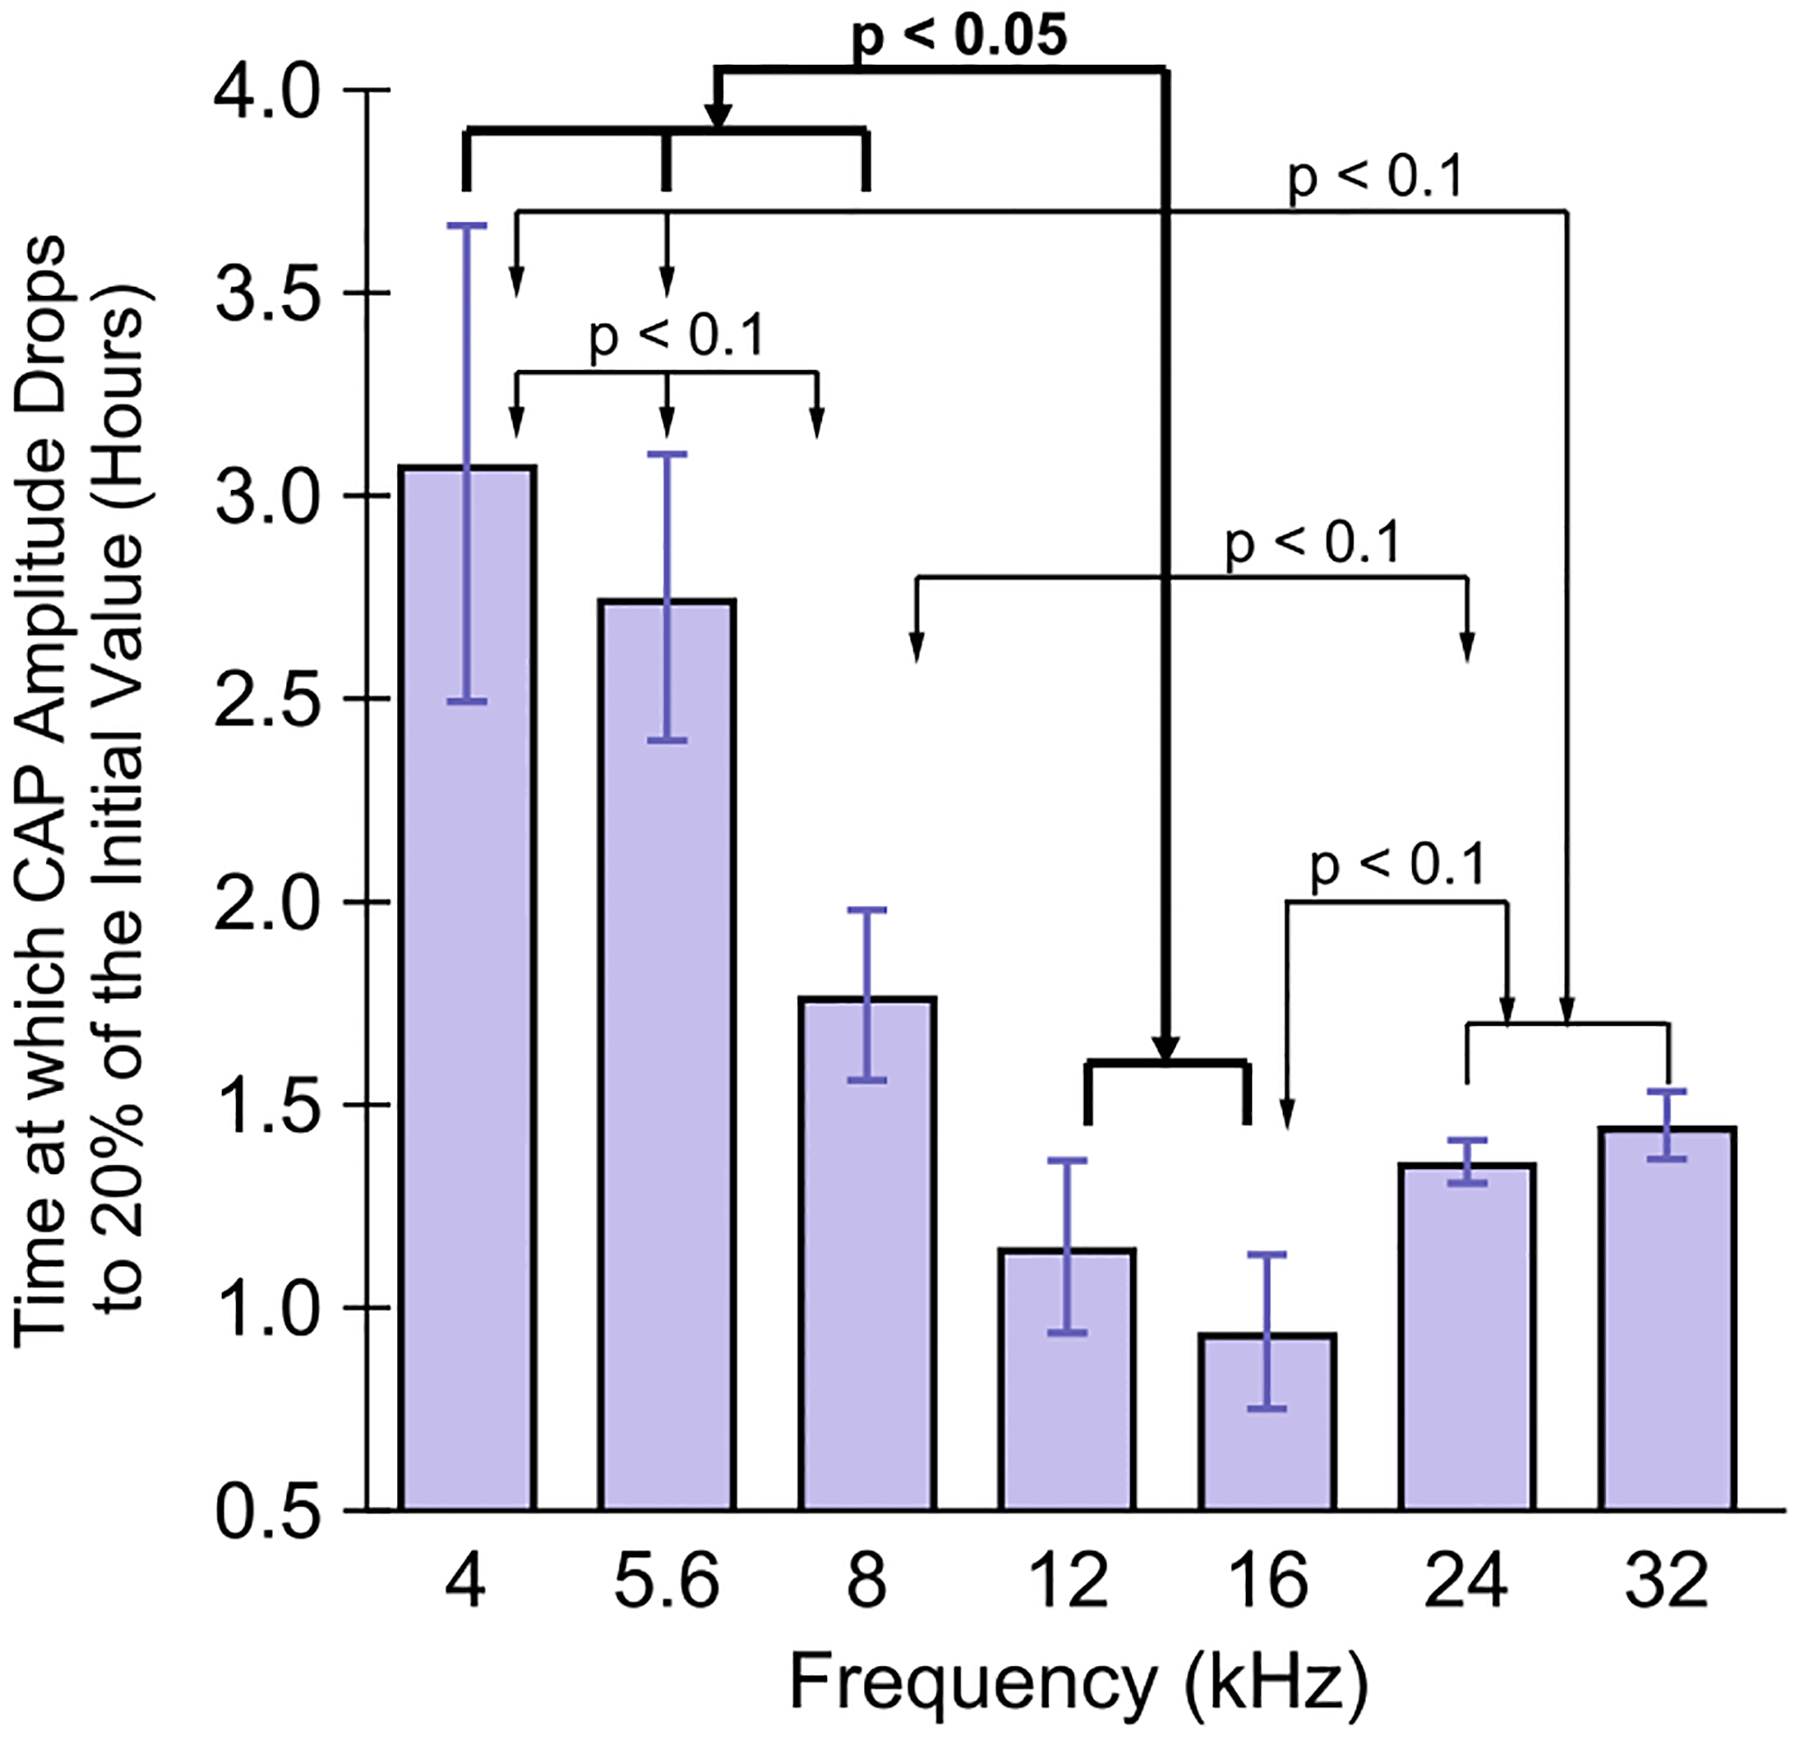
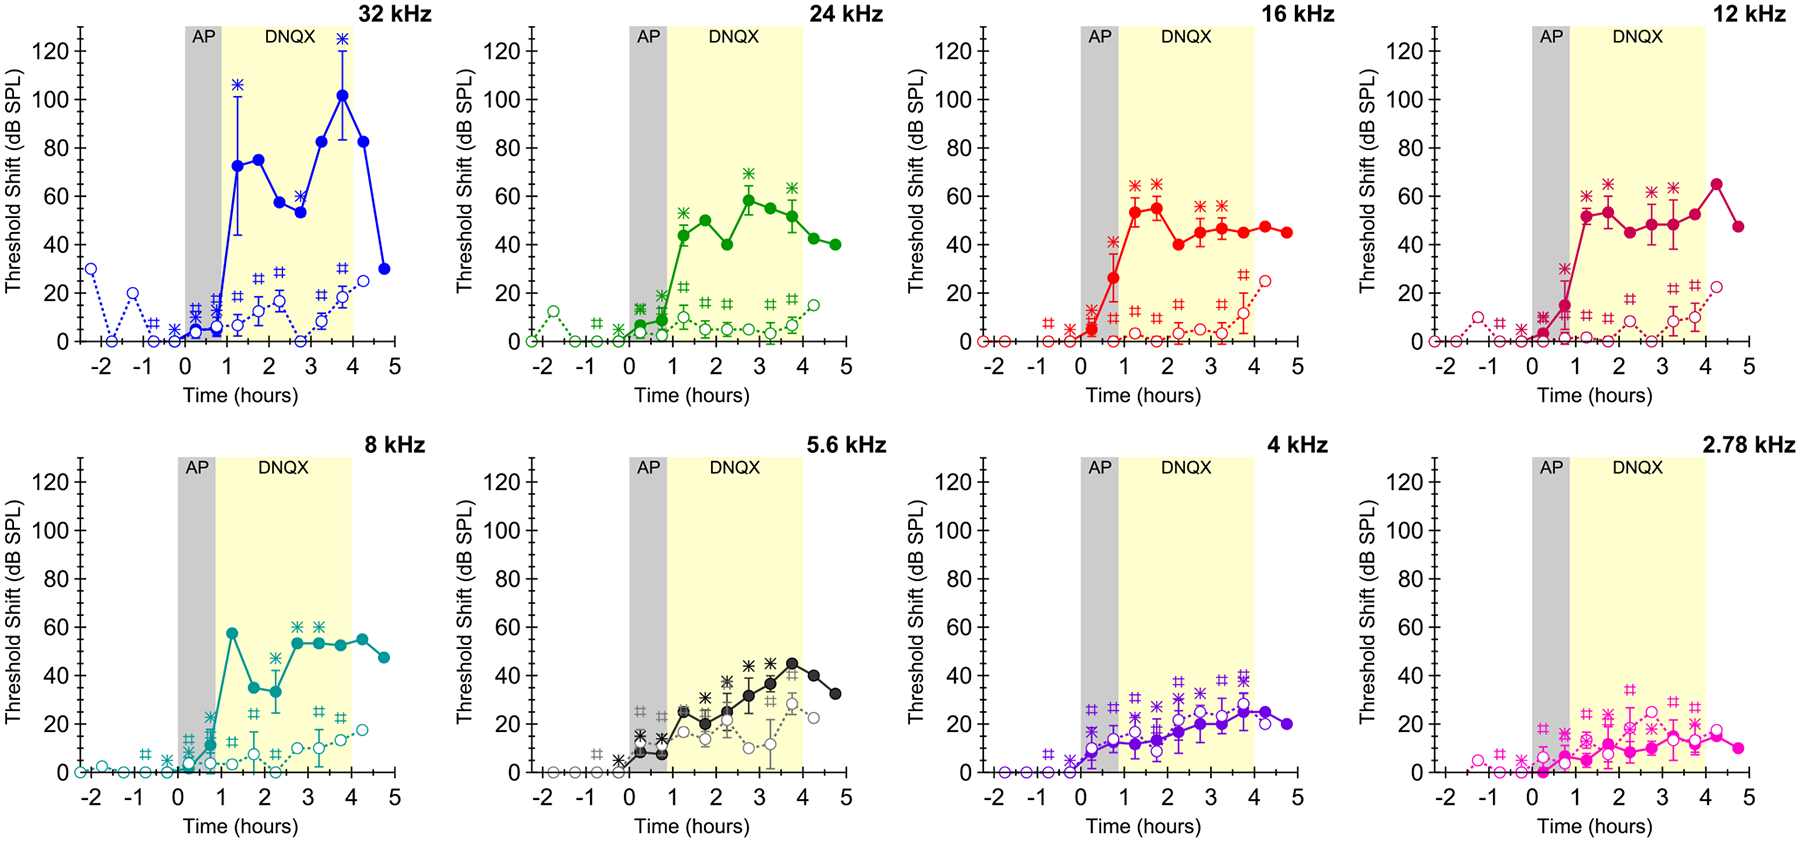
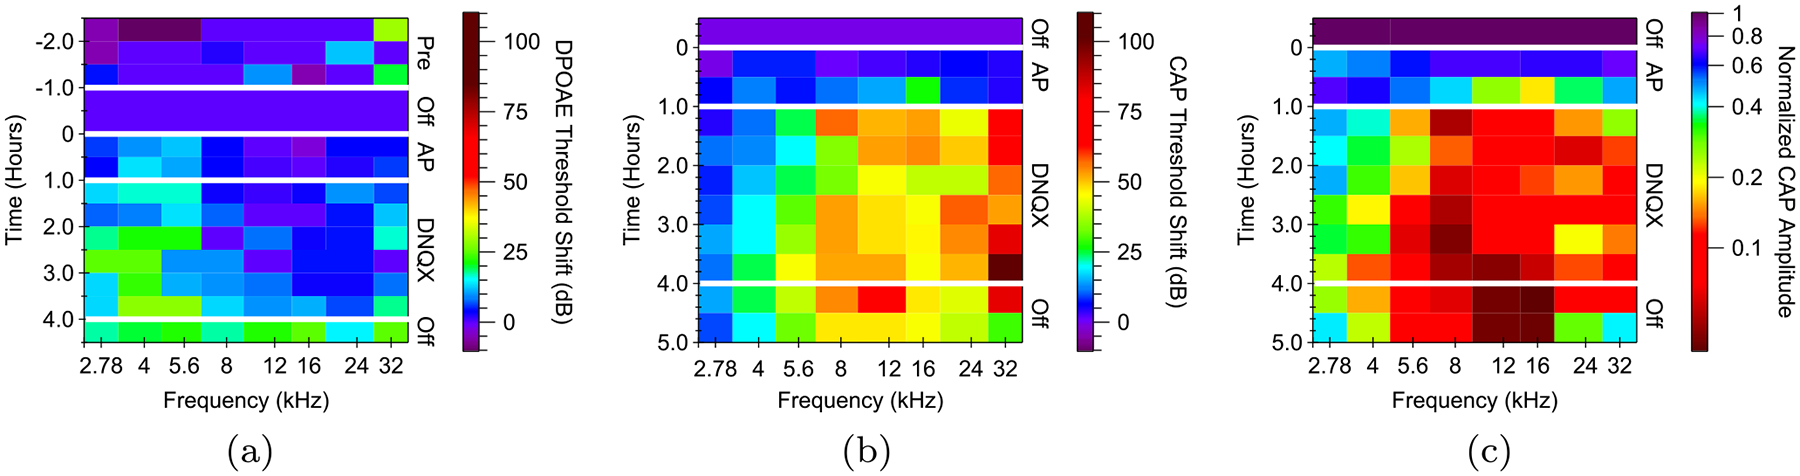
One of the major challenges in treatment of auditory disorders is that many therapeutic compounds are toxic when delivered systemically. Local intracochlear delivery methods are becoming critical in emerging treatments and in drug discovery. Direct infusion via cochleostomy, in particular, is attractive from a pharmacokinetics standpoint, as there is potential for the kinetics of delivery to be well-controlled. Direct infusion is compatible with a large number of drug types, including large, complex molecules such as proteins and unstable molecules such as siRNA. In addition, hair-cell regeneration therapy will likely require long-term delivery of a timed series of agents. This presents unknown risks associated with increasing the volume of fluid within the cochlea and mechanical damage caused during delivery. There are three key requirements for an intracochlear drug delivery system: (1) a high degree of miniaturization (2) a method for pumping precise and small volumes of fluid into the cochlea in a highly controlled manner, and (3) a method for removing excess fluid from the limited cochlear fluid space. To that end, our group is developing a head-mounted microfluidics-based system for long-term intracochlear drug delivery. We utilize guinea pig animal models for development and demonstration of the device. Central to the system is an infuse-withdraw micropump component that, unlike previous micropump-based systems, has fully integrated drug and fluid storage compartments. Here we characterize the infuse-withdraw capabilities of our micropump, and show experimental results that demonstrate direct drug infusion via cochleostomy in animal models. We utilized DNQX, a glutamate receptor antagonist that suppresses CAPs, as a test drug. We monitored the frequency-dependent changes in auditory nerve CAPs during drug infusion, and observed CAP suppression consistent with the expected drug transport path based on the geometry and tonotopic organization of the cochlea.
Figures
Similar articles
-
Microfabricated reciprocating micropump for intracochlear drug delivery with integrated drug/fluid storage and electronically controlled dosing.Lab Chip. 2016 Mar 7;16(5):829-46. doi: 10.1039/c5lc01396h. Lab Chip. 2016. PMID: 26778829 Free PMC article.
-
Development of a microfluidics-based intracochlear drug delivery device.Audiol Neurootol. 2009;14(6):411-22. doi: 10.1159/000241898. Epub 2009 Nov 16. Audiol Neurootol. 2009. PMID: 19923811 Free PMC article.
-
Local drug delivery with a self-contained, programmable, microfluidic system.Biomed Microdevices. 2009 Jun;11(3):571-8. doi: 10.1007/s10544-008-9265-5. Biomed Microdevices. 2009. PMID: 19089621 Free PMC article.
-
Intracochlear drug delivery systems.Expert Opin Drug Deliv. 2011 Sep;8(9):1161-74. doi: 10.1517/17425247.2011.588207. Epub 2011 May 26. Expert Opin Drug Deliv. 2011. PMID: 21615213 Free PMC article. Review.
-
The role of intracochlear drug delivery devices in the management of inner ear disease.Expert Opin Drug Deliv. 2015 Mar;12(3):465-79. doi: 10.1517/17425247.2015.974548. Epub 2014 Oct 27. Expert Opin Drug Deliv. 2015. PMID: 25347140 Review.
Cited by
-
Overcoming barriers: a review on innovations in drug delivery to the middle and inner ear.Front Pharmacol. 2023 Oct 19;14:1207141. doi: 10.3389/fphar.2023.1207141. eCollection 2023. Front Pharmacol. 2023. PMID: 37927600 Free PMC article. Review.
-
Nanoparticles for the Treatment of Inner Ear Infections.Nanomaterials (Basel). 2021 May 17;11(5):1311. doi: 10.3390/nano11051311. Nanomaterials (Basel). 2021. PMID: 34067544 Free PMC article. Review.
-
A nanoliter resolution implantable micropump for murine inner ear drug delivery.J Control Release. 2019 Mar 28;298:27-37. doi: 10.1016/j.jconrel.2019.01.032. Epub 2019 Jan 25. J Control Release. 2019. PMID: 30690105 Free PMC article.
-
Intrinsic mechanism and pharmacologic treatments of noise-induced hearing loss.Theranostics. 2023 Jun 19;13(11):3524-3549. doi: 10.7150/thno.83383. eCollection 2023. Theranostics. 2023. PMID: 37441605 Free PMC article. Review.
-
Microfabricated reciprocating micropump for intracochlear drug delivery with integrated drug/fluid storage and electronically controlled dosing.Lab Chip. 2016 Mar 7;16(5):829-46. doi: 10.1039/c5lc01396h. Lab Chip. 2016. PMID: 26778829 Free PMC article.
References
-
- Eaton-Peabody Laboratories (2014). http://www.masseyeandear.org/research/otolaryngology/investigators/labor...
-
- Andrews J, Böhmer A, Hoffman L, The measurement and manipulation of intralabyrinthine pressure in experimental endolymphatic hydrops. Laryngoscope 101, 661–668 (1991) - PubMed
-
- Barron SE, Bobbin RP, Guth P, Norris C, Cytochalasin D suppresses sound evoked potentials in the guinea pig cochlea. Hear Res. 31(2), 147–53 (1987) - PubMed
-
- Bianchi L, Raz Y, Methods for providing therapeutic agents to treat damaged spiral ganglion neurons. Curr. Drug Targets-CNS Neurol. Disord 3, 195–199 (2004) - PubMed
-
- Bobbin RP, Ceasar G, Kynurenic acid and γ-D-glutamylaminomethylsulfonic the compound action potential of the auditory acid suppress nerve. Hear Res. 25, 77–81 (1987) - PubMed
Publication types
MeSH terms
Substances
Grants and funding
LinkOut - more resources
Full Text Sources
Other Literature Sources
Miscellaneous
