. 2015 Apr:49:735-745.
doi: 10.1016/j.msec.2015.01.077. Epub 2015 Jan 26.

Titania nanotube arrays as interfaces for neural prostheses

Affiliations

Titania nanotube arrays as interfaces for neural prostheses

Jonathan A Sorkin et al. Mater Sci Eng C Mater Biol Appl. 2015 Apr.

Abstract

Neural prostheses have become ever more acceptable treatments for many different types of neurological damage and disease. Here we investigate the use of two different morphologies of titania nanotube arrays as interfaces to advance the longevity and effectiveness of these prostheses. The nanotube arrays were characterized for their nanotopography, crystallinity, conductivity, wettability, surface mechanical properties and adsorption of key proteins: fibrinogen, albumin and laminin. The loosely packed nanotube arrays fabricated using a diethylene glycol based electrolyte, contained a higher presence of the anatase crystal phase and were subsequently more conductive. These arrays yielded surfaces with higher wettability and lower modulus than the densely packed nanotube arrays fabricated using water based electrolyte. Further the adhesion, proliferation and differentiation of the C17.2 neural stem cell line was investigated on the nanotube arrays. The proliferation ratio of the cells as well as the level of neuronal differentiation was seen to increase on the loosely packed arrays. The results indicate that loosely packed nanotube arrays similar to the ones produced here with a DEG based electrolyte, may provide a favorable template for growth and maintenance of C17.2 neural stem cell line.

Keywords: Astrocytes; C17.2 neural stem cell line; Neural prostheses; Neurons; Titania nanotube arrays.


Figures

Figure 1
Figure 1
Schematic of electrochemical anodization set-up with titanium anode and platinum cathode placed within a fluorinated electrolyte solution.
Figure 2
Figure 2
Schematic of 4PP device used to measure the conductance of titania nanotube arrays, comprised of a voltage probe and current probe on the nanotube array surface and the etched titanium surface coated with gold to form ohmic contacts. Current was measured as a potential was applied.
Figure 3
Figure 3
Figure 3(a) Representative SEM images of NT-H2O and NT-DEG arrays indicating the top view (top) and cross-sectional view (bottom). Figure 3(b) Diameter and length of NT-H2O and NT-DEG arrays masured from SEM images using the ImageJ software. Measurements were taken from at least 3 different substrates at 3 different locations (nmin = 9). Diameter and length of the NT-H2O arrays were significantly lower than that of NT-DEG arrays (* → p < 0.05). Error bars represent standard deviation.
Figure 3
Figure 3
Figure 3(a) Representative SEM images of NT-H2O and NT-DEG arrays indicating the top view (top) and cross-sectional view (bottom). Figure 3(b) Diameter and length of NT-H2O and NT-DEG arrays masured from SEM images using the ImageJ software. Measurements were taken from at least 3 different substrates at 3 different locations (nmin = 9). Diameter and length of the NT-H2O arrays were significantly lower than that of NT-DEG arrays (* → p < 0.05). Error bars represent standard deviation.
Figure 4
Figure 4
Representative high-resolution GAXRD scans of titanium substrates, NT-H2O, and NT-DEG arrays with the different peaks for amorphous titanium (■), anatase phase (○), and rutile phase (❖). The NT-DEG arrays have higher amounts of more conductive anatase phase as compared to titanium substrates and NT-H2O arrays.
Figure 5
Figure 5
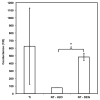
Conductance of titanium substrates, NT-H2O and NT-DEG arrays measured using a 4PP method. Measurements were taken from at least 3 different substrates at 3 different locations (nmin = 9). The conductance of NT-DEG arrays is significantly higher than that of NT-H2O arrays (* → p < 0.05). Error bars represent standard deviation.
Figure 6
Figure 6
Representative images of water droplet on different substrates, respective contact angle values and calculated surface energies of different substrates. Contact angle measurements were taken on at least 3 different substrates at 3 different locations. Statistical symbols are not used in this figure. Titanium substrates have significantly higher contact angles (significantly lower surface energy) as compared to NT-H2O and NT-DEG arrays (p < 0.05).
Figure 7
Figure 7
Figure 7(a) Elastic modulus of titanium substrates, NT-H2O and NT-DEG arrays measured using nanoindentation. Indents were performed on at least 3 different substrates at 3 different locations (nmin = 9). Statistical symbols are not used in this figure. Both NT-H2O and NT-DEG arrays had a significantly lower elastic modulus than that of titanium substrates (p < 0.05). Error bars represent standard deviation. Figure 7(b) Hardness of titanium substrates, NT-H2O and NT-DEG arrays measured using nanoindentation. Indents were performed on at least 3 different substrates at 3 different locations (nmin = 9). Statistical symbols are not used in this figure. Titanium substrates have significantly higher hardness, followed by NT-H2O and NT-DEG arrays (p < 0.05). Error bars represent standard deviation.
Figure 7
Figure 7
Figure 7(a) Elastic modulus of titanium substrates, NT-H2O and NT-DEG arrays measured using nanoindentation. Indents were performed on at least 3 different substrates at 3 different locations (nmin = 9). Statistical symbols are not used in this figure. Both NT-H2O and NT-DEG arrays had a significantly lower elastic modulus than that of titanium substrates (p < 0.05). Error bars represent standard deviation. Figure 7(b) Hardness of titanium substrates, NT-H2O and NT-DEG arrays measured using nanoindentation. Indents were performed on at least 3 different substrates at 3 different locations (nmin = 9). Statistical symbols are not used in this figure. Titanium substrates have significantly higher hardness, followed by NT-H2O and NT-DEG arrays (p < 0.05). Error bars represent standard deviation.
Figure 8
Figure 8
Adsorption of key proteins encountered during neurological prostheses implantation. Proteins adsorption was done on at least 9 different substrates (nmin = 9). The NT-DEG arrays had a significantly laminin adsorption as compared to NT-H2O arrays and titanium substrates (* → p < 0.05). Error bars represent standard deviation.
Figure 9
Figure 9
Figure 9(a) Representative fluorescence microscopy images of C17.2 cells stained with rhodamine phalloidin (red), FITC CMFDA (green), and DAPI (Blue) on titanium substrates, NT-H2O and NT-DEG arrays after 1, 4, and 7 days of culture in growth media. Experiments were replicated on at least 3 different substrates with at least 3 different cell populations (nmin = 9). Figure 9(b) C17.2 cell density on titanium substrates, NT-H2O and NT-DEG arrays after 1, 4, and 7 days of culture in growth media. Cell nuclei were stained with DAPI and counted using ImageJ software. Experiments were replicated on at 3 three different substrates with at least 3 different cell populations and at least 3 different images (nmin = 27). Titanium substrates had significantly lower cell densities than NT-H2O or NT-DEG arrays after each day of culture (p < 0.05). Error bars represent standard deviation. Figure 9(c) Proliferation ratio calculated from cell densities on titanium substrates, NT-H2O, and NT-DEG arrays after 4 and 7 days of culture.
Figure 9
Figure 9
Figure 9(a) Representative fluorescence microscopy images of C17.2 cells stained with rhodamine phalloidin (red), FITC CMFDA (green), and DAPI (Blue) on titanium substrates, NT-H2O and NT-DEG arrays after 1, 4, and 7 days of culture in growth media. Experiments were replicated on at least 3 different substrates with at least 3 different cell populations (nmin = 9). Figure 9(b) C17.2 cell density on titanium substrates, NT-H2O and NT-DEG arrays after 1, 4, and 7 days of culture in growth media. Cell nuclei were stained with DAPI and counted using ImageJ software. Experiments were replicated on at 3 three different substrates with at least 3 different cell populations and at least 3 different images (nmin = 27). Titanium substrates had significantly lower cell densities than NT-H2O or NT-DEG arrays after each day of culture (p < 0.05). Error bars represent standard deviation. Figure 9(c) Proliferation ratio calculated from cell densities on titanium substrates, NT-H2O, and NT-DEG arrays after 4 and 7 days of culture.
Figure 10
Figure 10
Figure 10(a) Representative immunofluorescence images of C17.2 cells after 7 days of culture in differentiation media immunostained with ALDH1L1 (red), nestin (green), and DAPI (blue) for the expression of astrocyte marker, neural precursor marker, and nucleus respectively. Experiments were replicated on at least 3 different substrates with at least 3 different cell populations (nmin = 9). Figure 10(b) Representative immunofluorescence images of C17.2 cells after 7 days of culture in differentiation media, immunostained with NF-L (red), nestin (green), and DAPI (blue) for the expression of neuronal marker, neural precursor marker, and nucleus respectively. Experiments were replicated on at least 3 different substrates with at least 3 different cell populations (nmin = 9). Figure 10(c) Percentage of TR-labeled ALDH1L1 and NF-L normalized by total number of cells in an image.
Figure 10
Figure 10
Figure 10(a) Representative immunofluorescence images of C17.2 cells after 7 days of culture in differentiation media immunostained with ALDH1L1 (red), nestin (green), and DAPI (blue) for the expression of astrocyte marker, neural precursor marker, and nucleus respectively. Experiments were replicated on at least 3 different substrates with at least 3 different cell populations (nmin = 9). Figure 10(b) Representative immunofluorescence images of C17.2 cells after 7 days of culture in differentiation media, immunostained with NF-L (red), nestin (green), and DAPI (blue) for the expression of neuronal marker, neural precursor marker, and nucleus respectively. Experiments were replicated on at least 3 different substrates with at least 3 different cell populations (nmin = 9). Figure 10(c) Percentage of TR-labeled ALDH1L1 and NF-L normalized by total number of cells in an image.
Figure 11
Figure 11
Representative SEM images of C17.2 cells on titanium substrates, NT-H2O and NT-DEG arrays after 7 days of culture in differentiation media. Experiments were replicated on at least 3 different substrates with at least 3 different cell populations (nmin = 9). The substrates and cells were coated with a 10nm layer of gold and were imaged a 7keV.

Similar articles

Cited by

References

    1. Pezaris JS, Eskandar EN. Neurosurgical focus. 2009;27:E6. doi: 10.3171/2009.4.FOCUS0986. - DOI - PMC - PubMed
    1. Lim HH, Lenarz M, Lenarz T. Trends in amplification. 2009;13:149–180. doi: 10.1177/1084713809348372. - DOI - PMC - PubMed
    1. Wilson BS, Dorman MF. Hearing research. 2008;242:3–21. doi: 10.1016/j.heares.2008.06.005. - DOI - PMC - PubMed
    1. Cohen ED. Journal of neural engineering. 2007;4:R14–31. doi: 10.1088/1741-2560/4/2/R02. - DOI - PubMed
    1. Waldert S, Pistohl T, Braun C, Ball T, Aertsen A, Mehring C. Journal of physiology, Paris. 2009;103:244–254. doi: 10.1016/j.jphysparis.2009.08.007. - DOI - PubMed

Publication types

LinkOut - more resources