. 2015 Mar 9;212(3):385-99.
doi: 10.1084/jem.20141442. Epub 2015 Feb 16.

Restricted dendritic cell and monocyte progenitors in human cord blood and bone marrow

Affiliations

Restricted dendritic cell and monocyte progenitors in human cord blood and bone marrow

Jaeyop Lee et al. J Exp Med. .

Abstract

In mice, two restricted dendritic cell (DC) progenitors, macrophage/dendritic progenitors (MDPs) and common dendritic progenitors (CDPs), demonstrate increasing commitment to the DC lineage, as they sequentially lose granulocyte and monocyte potential, respectively. Identifying these progenitors has enabled us to understand the role of DCs and monocytes in immunity and tolerance in mice. In humans, however, restricted monocyte and DC progenitors remain unknown. Progress in studying human DC development has been hampered by lack of an in vitro culture system that recapitulates in vivo DC hematopoiesis. Here we report a culture system that supports development of CD34(+) hematopoietic stem cell progenitors into the three major human DC subsets, monocytes, granulocytes, and NK and B cells. Using this culture system, we defined the pathway for human DC development and revealed the sequential origin of human DCs from increasingly restricted progenitors: a human granulocyte-monocyte-DC progenitor (hGMDP) that develops into a human monocyte-dendritic progenitor (hMDP), which in turn develops into monocytes, and a human CDP (hCDP) that is restricted to produce the three major DC subsets. The phenotype of the DC progenitors partially overlaps with granulocyte-macrophage progenitors (GMPs). These progenitors reside in human cord blood and bone marrow but not in the blood or lymphoid tissues.


Figures

Figure 1.
Figure 1.
Stromal culture system for DCs and other leukocytes. (a) Flow cytometry plots show DCs obtained from peripheral blood (PBMC) and DCs obtained from cultures of cord blood CD34+ cells with Flt3L+SCF+GM-CSF+IL-4 (FSG-4) or mouse BM stromal cells (MS5)+Flt3L or MS5+FSG. pDCs, CD1c+ cDCs, and CD141+ cDCs are shaded green, blue, and red, respectively. Pie charts indicate the relative representation of each DC subset in each group. Plots are representative of two Flt3L+SCF+GM-CSF+IL-4 or more than three MS5+Flt3L and MS5+FSG experiments. (b) Graphs show output of the indicated cells derived from CD34+ cells in MS5 with Flt3L (F) versus FSG. Error bars indicate SEM. (c) Flow cytometry plots show phenotype of cells developing from 2,000 CD34+ HSPCs purified from human cord blood and cultured in MS5+FSG for 14 d. Representative culture of five different donors. Pie chart shows CD45+ cell composition.
Figure 2.
Figure 2.
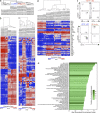
Culture-derived DCs resemble primary DCs. (a–e) Transcriptional profiling of pDCs, monocytes, and CD1c+ and CD141+ cDCs purified from primary peripheral blood (blood; six healthy individuals) or from culture of CD34+ cells in MS5+Flt3L for 14 d (culture; four cord blood donors) as in Fig. S1. (a) Hierarchical clustering dendrogram of cultured versus primary pDCs, monocytes, and CD1c+ and CD141+ cDCs. This dendrogram was generated using the top 611 differentially expressed genes selected by unsupervised clustering (sparse hierarchical clustering using all genes; Table S5). (b) Heat map showing the sparse hierarchical clustering of mRNAs expressed by primary and culture-derived pDCs and monocytes. This analysis showed that a minimal number of 78 genes is enough to distinguish one cell type from another. The normalized expression values for the top 78 differentially expressed genes (Table S1) are displayed. (c) Heat map showing the sparse hierarchical clustering of mRNAs expressed by primary and culture-derived CD1c+ and CD141+ cDCs. This analysis showed that a minimal number of 80 genes is enough to distinguish one cell type from another. The normalized expression values for the top 80 differentially expressed genes (Table S2) are displayed. (d) Heat map showing the hierarchical clustering of mRNAs for selected genes (Table S3) expressed by primary and culture-derived pDCs, monocytes, and CD1c+ and CD141+ cDCs. (e) Top 50 enriched KEGG metabolic pathways (Table S4) for genes shared by both subsets of cultured cDCs but not primary cDCs according to GSEA analysis. (f) Phenotype change of blood CD141+ and CD1c+ cDCs in culture. Blood CD141+ and CD1c+ cDCs were purified and cultured for 7 d in MS5+FSG. Flow cytometry plots of gated CD45+ cells show cell surface markers of output cells.
Figure 3.
Figure 3.
Culture-derived cells resemble their ex vivo counterparts in phenotype and function. (a) Histograms show cell surface markers of human monocytes and DCs isolated from blood (top rows) and MS5+FSG cultures (bottom rows). (b) Cord blood CD34+-derived DC subsets were cultured for 14 d, purified by FACs, and exposed to the indicated TLR stimuli. Graphs indicate concentration of IFN-α and IL-12p70 in the supernatant measured by ELISA after 48 h from three independent experiments. n (number of donors) = 3. Error bars indicate SEM.
Figure 4.
Figure 4.
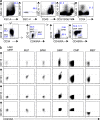
Fractionation of cord blood progenitors based on cytokine receptor expression. (a and b) Flow cytometry plots show exhaustive separation of CD34+ cord blood cells into six populations, HSCs/MPPs, MLPs, B and NK progenitors (B/NK), CMPs, megakaryocytic and erythroid progenitors (MEP), and GMPs (a), and expression of CD115, CD116, CD135, and CD123 on each of the cord blood CD34+ populations in a (b).
Figure 5.
Figure 5.
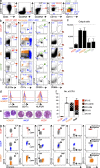
Characterization of cord blood progenitors. (a) Flow cytometry plots show gating of cord blood CD34+CD38hiCD10CD45RA+CD123int/hi GMP cells (Doulatov et al., 2010) and further separation into five separate populations based on CD123, CD115, and CD116 expression: CD123hiCD115 (CD123hi), CD123intCD115+CD116 (CD115+), CD123intCD115+CD116+ (DP), CD123intCD115CD116+ (CD116+), and CD123intCD115CD116 (DN). (b) Differentiation potential of 200 purified cells from each of the five populations indicated in a in MS5+FSG culture harvested after 7 d. Flow cytometry plots show CD45+CD56CD19 cells. (c) Graph indicates output/input ratio of total number of CD45+ cells obtained from each of the five populations sorted in a. Bars and error bars are means and SEM, respectively, from three independent experiments. (d) Histograms show expression of indicated markers on hGMDPs, hMDPs, and hCDPs. (e) Morphology of purified cord blood hGMDPs, hMDPs, and hCDPs by Giemsa staining of cytospin preparations. Bars, 10 µm. (f) Graph indicates the differentiation potential of hCDPs, hMDPs, hGMDPs, and CMPs in methylcellulose colony formation assays in vitro (as in Materials and methods). Colonies were enumerated at 14 d after culture. BFU-E, burst-forming unit erythroid; GEMM, granulocyte, erythrocyte, macrophage, megakaryocyte; GM, granulocyte and macrophage; G, granulocyte; M, macrophage. Bars are means and error bars are SEM from three independent experiments. (g) Cross-phenotyping hCDPs, hMDPs, and hGMDPs with DC-associated progenitors. hCDPs, hMDPs, and hGMDPs were identified by flow cytometry and overlaid with previously identified progenitors (gray). CLPs were gated as CD45+Lin(CD3/19/56/14)CD34+CD10+CD45RA+ (Galy et al., 1995; Ishikawa et al., 2007), LMPPs as CD45+LinCD34+CD10CD62L+CD45RA+ (Kohn et al., 2012), CMPs as CD45+LinCD34+CD38+CD10CD45RACD123+, GMPs as CD45+LinCD34+CD38+CD10CD45RA+CD123+/hi (Chicha et al., 2004; Doulatov et al., 2010), MLPs as CD45+LinCD34+CD38CD45RA+ (Doulatov et al., 2010), and myeloid DC progenitors as CD45+LinCD34+CD123hi (Olweus et al., 1997). n (number of donors) = 3.
Figure 6.
Figure 6.
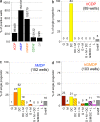
Developmental potential of single progenitor cells. (a) Graph shows the percentage of positive wells obtained from culturing single hCDP, hMDP, hGMDP, CD123intCD115CD116+ (CD116+), and CD123intCD115+ CD116+ (DP) cells in MS5+FSG culture. Clonal efficiency calculated based on the number of positive wells is indicated. Data are pooled from three independent experiments. (b–d) Bar graphs summarize the cellular output of all positive single cell cultures of hCDPs (b), hMDPs (c), and hGMDPs (d) from three independent experiments (n = 3 donors). The number of wells per category is noted on top of each bar. DC, pDC and/or cDC; G, granulocyte; L, lymphocyte; M, monocyte.
Figure 7.
Figure 7.
Relationship of hGMDPs to hMDPs and to hCDPs. (a) 10,000 hGMDPs were purified from cord blood and adoptively transferred into the bone cavity of the preconditioned NSG mice (Materials and methods). 7 d later, BM cells were analyzed. Flow cytometry plots show phenotype of BM cells from NSG mice receiving PBS or hGMDPs (n = 3 mice). (b) 200–400 hGMDP, hMDP, and hCDP cells were purified and cultured in MS5+FSG. Cultures were analyzed on days 1, 4, and 8. Flow cytometry plots gated on live CD45+Lin(CD3/19/56/14)DC(CD1c/141/303)CD45RA+ cells show cell surface markers and frequency of hCDPs, hMDPs, and hGMDPs. Results are representative of three independent experiments.
Figure 8.
Figure 8.
Distribution of hGMDPs, hMDPs, and hCDPs in adult hematopoietic organs. (a) Representative flow cytometry plots of gated CD45+Lin(CD3/19/56/14)CD34+ cells show hGMDPs, hMDPs, and hCDPs in human BM (n = 4), peripheral blood (PBMC; n = 4), and tonsils (n = 4). (b) hGMDPs, hMDPs, and hCDPs were purified from human BM, and 2,500 progenitors were cultured in MS5+FSG for 7 d. Flow cytometry plots of gated live CD45+ cells show phenotype of output cells, including granulocytes (brown), CD141+ cDCs (red), CD1c+ cDCs (blue), monocytes (orange), and pDCs (green). Data represent three independent experiments. (c) Graph shows output/input cell ratio in percentage of the indicated cells derived from BM (n = 3) or cord blood (CB; n = 3) cultures of hGMDPs, hMDPs, and hCDPs in MS5+FSG for 7 d. Statistical significance was determined using unpaired Student’s t test. *, P < 0.05; **, P < 0.001.

Comment in

References

    1. Akashi K., Traver D., Miyamoto T., and Weissman I.L.. 2000. A clonogenic common myeloid progenitor that gives rise to all myeloid lineages. Nature. 404:193–197 10.1038/35004599 - DOI - PubMed
    1. Bigley V., Haniffa M., Doulatov S., Wang X.N., Dickinson R., McGovern N., Jardine L., Pagan S., Dimmick I., Chua I., et al. . 2011. The human syndrome of dendritic cell, monocyte, B and NK lymphoid deficiency. J. Exp. Med. 208:227–234 10.1084/jem.20101459 - DOI - PMC - PubMed
    1. Boissel N., Rousselot P., Raffoux E., Cayuela J.M., Maarek O., Charron D., Degos L., Dombret H., Toubert A., and Rea D.. 2004. Defective blood dendritic cells in chronic myeloid leukemia correlate with high plasmatic VEGF and are not normalized by imatinib mesylate. Leukemia. 18:1656–1661 10.1038/sj.leu.2403474 - DOI - PubMed
    1. Breton G., Lee J., Zhou Y.J., Schreiber J.J., Keler T., Puhr S., Anandasabapathy N., Schlesinger S., Caskey M., Liu K., and Nussenzweig M.C.. 2015. Circulating precursors of human CD1c+ and CD141+ dendritic cells. J. Exp. Med. 212:401–413 10.1084/jem.20141441 - DOI - PMC - PubMed
    1. Chang C.C., Wright A., and Punnonen J.. 2000. Monocyte-derived CD1a+ and CD1a− dendritic cell subsets differ in their cytokine production profiles, susceptibilities to transfection, and capacities to direct Th cell differentiation. J. Immunol. 165:3584–3591 10.4049/jimmunol.165.7.3584 - DOI - PubMed

Publication types

Associated data