

Measuring frailty using self-report and test-based health measures
- PMID: 25687601
- PMCID: PMC4411224
- DOI: 10.1093/ageing/afv010
Measuring frailty using self-report and test-based health measures
Abstract
Background: previously, frailty indices were constructed using mostly subjective health measures. The reporting error in this type of measure can have implications on the robustness of frailty findings.
Objective: to examine whether frailty assessment differs when we construct frailty indices using solely self-reported or test-based health measures.
Design: secondary analysis of data from The Irish LongituDinal study on Ageing (TILDA).
Subjects and methods: 4,961 Irish residents (mean age: 61.9 ± 8.4; 54.2% women) over the age of 50 years who underwent a health assessment were included in this analysis. We constructed three frailty indices using 33 self-reported health measures (SRFI), 33 test-based health measures (TBFI) and all 66 measures combined (CFI). The 2-year follow-up outcomes examined were all-cause mortality, disability, hospitalisation and falls.
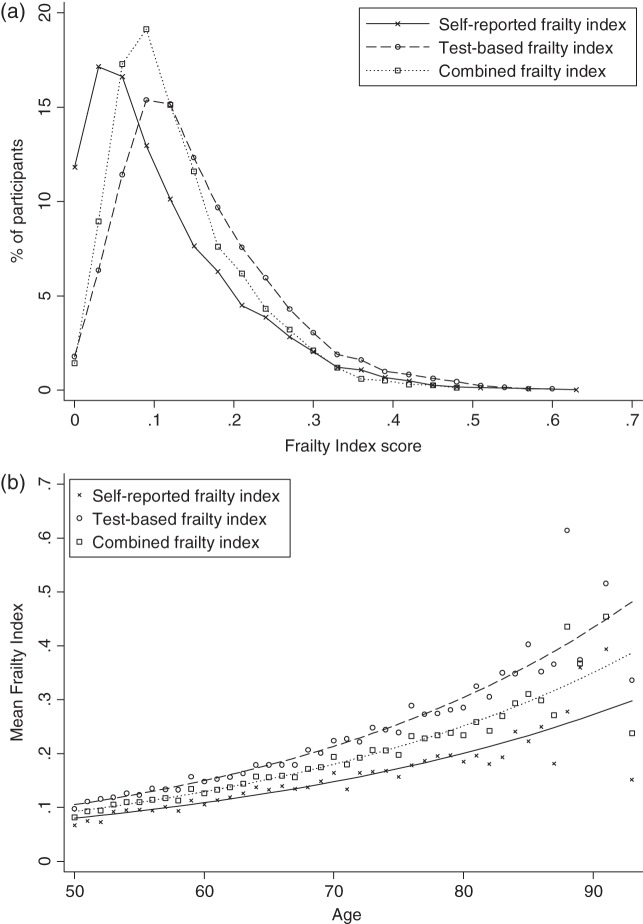
Results: all three indices had a right-skewed distribution, an upper limit to frailty, a non-linear increase with age, and had a dose-response relationship with adverse outcomes. Levels of frailty were lower when self-reported items were used (SRFI: 0.12 ± 0.09; TBFI: 0.17 ± 0.15; CFI: 0.14 ± 0.13). Men had slightly higher frailty index scores than women when test-based measures were used (men: 0.17 ± 0.09; women: 0.16 ± 0.10). CFI had the strongest prediction for risk of adverse outcomes (ROC: 0.64-0.81), and age was not a significant predictor when it was included in the regression model.
Conclusions: except for sex differences, characteristics of frailty are similar regardless of whether self-reported or test-based measures are used exclusively to construct a frailty index. Where available, self-reported and test-based measures should be combined when trying to identify levels of frailty.
Keywords: frailty; frailty index; older people; self-reported health measures; test-based health measures.
© The Author 2015. Published by Oxford University Press on behalf of the British Geriatrics Society. All rights reserved. For Permissions, please email: journals.permissions@oup.com.
Figures
Similar articles
-
A frailty index based on laboratory deficits in community-dwelling men predicted their risk of adverse health outcomes.Age Ageing. 2016 Jul;45(4):463-8. doi: 10.1093/ageing/afw054. Epub 2016 Apr 13. Age Ageing. 2016. PMID: 27076524
-
Identifying common characteristics of frailty across seven scales.J Am Geriatr Soc. 2014 May;62(5):901-6. doi: 10.1111/jgs.12773. Epub 2014 Apr 2. J Am Geriatr Soc. 2014. PMID: 24697631
-
Frailty and its prediction of disability and health care utilization: the added value of interviews and physical measures following a self-report questionnaire.Arch Gerontol Geriatr. 2012 Sep-Oct;55(2):369-79. doi: 10.1016/j.archger.2012.04.008. Epub 2012 May 15. Arch Gerontol Geriatr. 2012. PMID: 22595766
-
Sex Differences in Frailty.Interdiscip Top Gerontol Geriatr. 2015;41:41-53. doi: 10.1159/000381161. Epub 2015 Jul 17. Interdiscip Top Gerontol Geriatr. 2015. PMID: 26301978 Review.
-
Differences in frailty in older men and women.Med J Aust. 2020 Mar;212(4):183-188. doi: 10.5694/mja2.50466. Epub 2019 Dec 30. Med J Aust. 2020. PMID: 31886526 Review.
Cited by
-
Prevalence of multimorbidity with frailty and associations with socioeconomic position in an adult population: findings from the cross-sectional HUNT Study in Norway.BMJ Open. 2020 Jun 15;10(6):e035070. doi: 10.1136/bmjopen-2019-035070. BMJ Open. 2020. PMID: 32546489 Free PMC article.
-
Frailty predicts all-cause and cause-specific mortality among older adults in Austria: 8-year mortality follow-up of the Austrian Health Interview Survey (ATHIS 2014).BMC Geriatr. 2024 Jan 3;24(1):13. doi: 10.1186/s12877-023-04633-3. BMC Geriatr. 2024. PMID: 38172757 Free PMC article.
-
A simple test-based frailty index to predict survival among cancer patients with an unplanned hospitalization: An observational cohort study.Cancer Med. 2021 Sep;10(17):5765-5774. doi: 10.1002/cam4.4107. Epub 2021 Aug 5. Cancer Med. 2021. PMID: 34350715 Free PMC article.
-
Sex differences in genetic and environmental influences on frailty and its relation to body mass index and education.Aging (Albany NY). 2021 Jul 6;13(13):16990-17023. doi: 10.18632/aging.203262. Epub 2021 Jul 6. Aging (Albany NY). 2021. PMID: 34230219 Free PMC article.
-
Prevalence and Factors Associated with Potential Drug-Drug Interactions in Older Community-Dwelling Adults: A Prospective Cohort Study.Drugs Aging. 2021 Nov;38(11):1025-1037. doi: 10.1007/s40266-021-00898-8. Epub 2021 Oct 11. Drugs Aging. 2021. PMID: 34632551 Free PMC article.
References
-
- Central Statistics Office. Population and Labour Force Projections. Dublin: Stationery Office, 2008.
-
- European Commission/Economic Policy Committee. The 2009 Ageing Report: Economic and Budgetary Projections for the EU-27 Member States (2008–2060). http://europa.eu/epc/pdf/2009_ageing_report.pdf (June 2014, date last accessed) 2009.
-
- Rockwood K, Mitnitski A. Frailty defined by deficit accumulation and geriatric medicine defined by frailty. Clin Geriatr Med 2011; 27: 17–26. - PubMed
-
- Theou O, Rockwood K. Should frailty status always be considered when treating the elderly patient? Aging Health 2012; 8: 261–71.
Publication types
MeSH terms
LinkOut - more resources
Full Text Sources
Other Literature Sources
Medical
Miscellaneous
