. 2015 Apr 5;370(1665):20140135.
doi: 10.1098/rstb.2014.0135.

Climate change influences on global distributions of dengue and chikungunya virus vectors

Affiliations

Climate change influences on global distributions of dengue and chikungunya virus vectors

Lindsay P Campbell et al. Philos Trans R Soc Lond B Biol Sci. .

Abstract

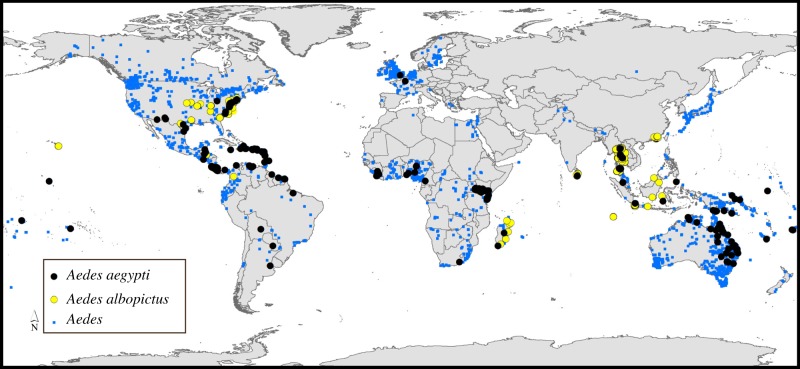
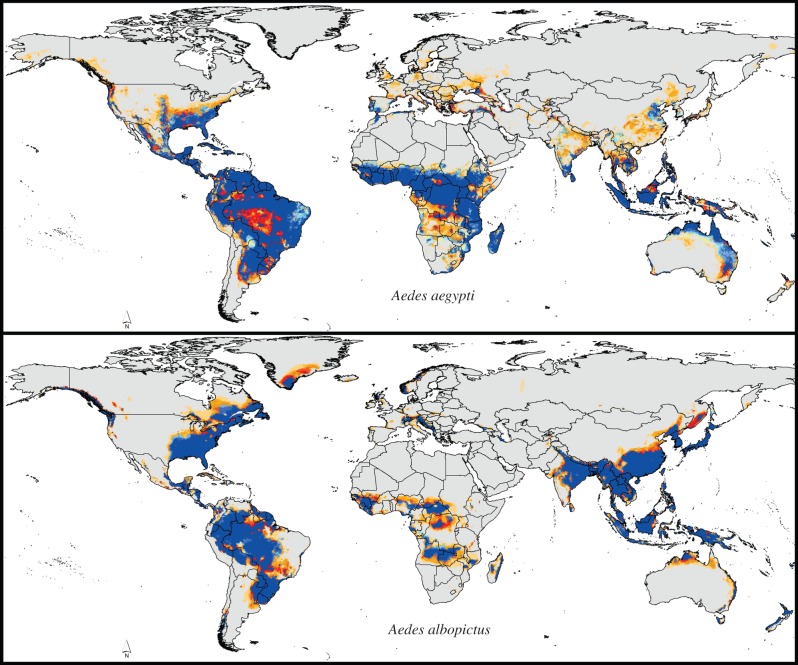
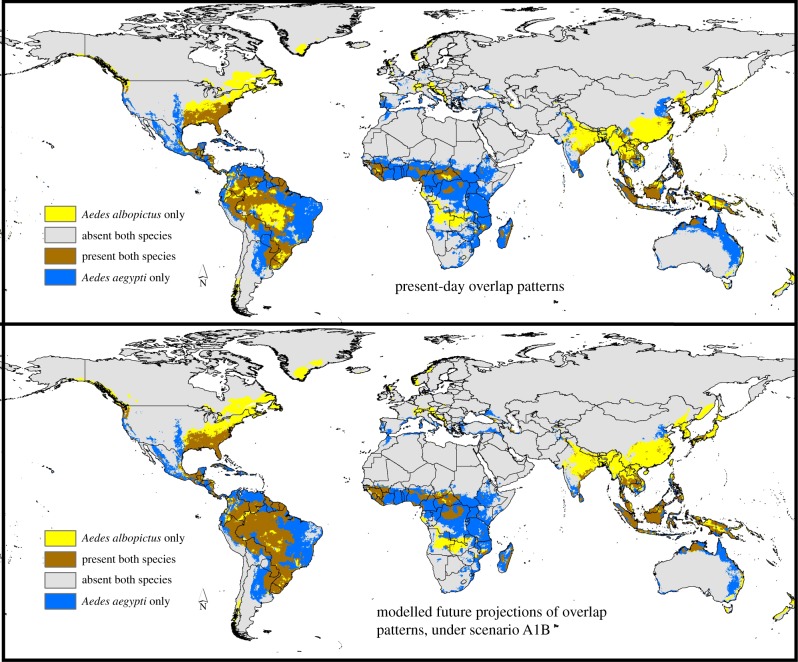
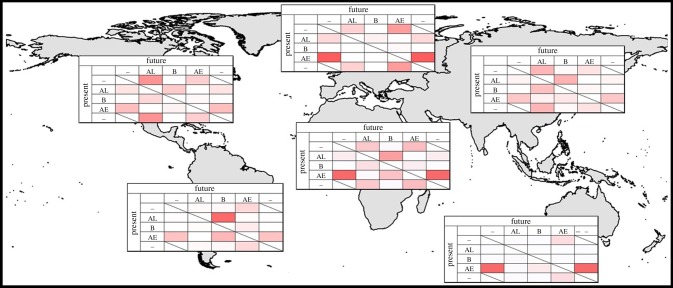
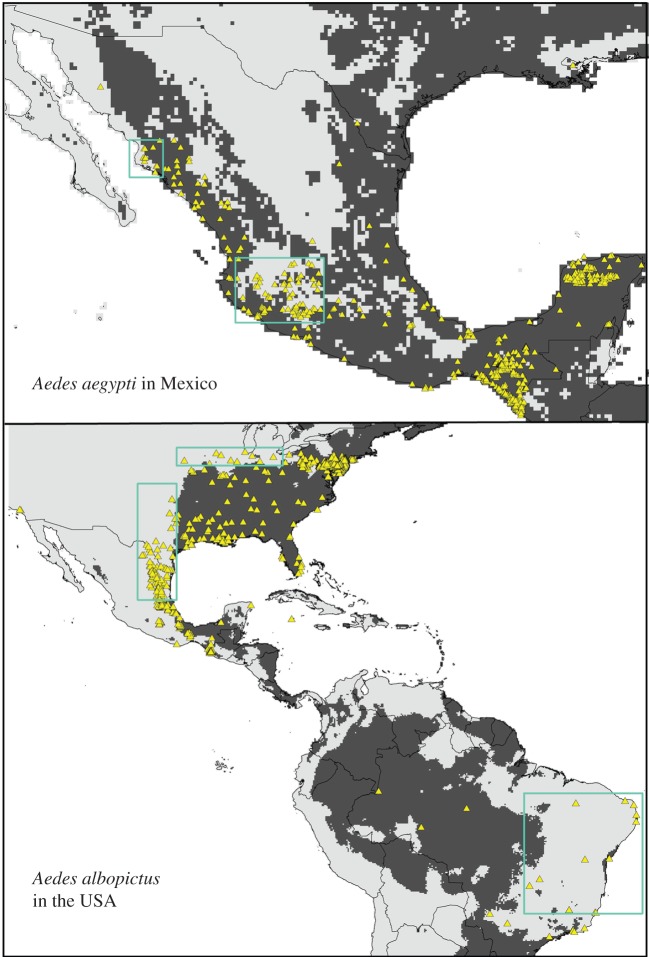
Numerous recent studies have illuminated global distributions of human cases of dengue and other mosquito-transmitted diseases, yet the potential distributions of key vector species have not been incorporated integrally into those mapping efforts. Projections onto future conditions to illuminate potential distributional shifts in coming decades are similarly lacking, at least outside Europe. This study examined the global potential distributions of Aedes aegypti and Aedes albopictus in relation to climatic variation worldwide to develop ecological niche models that, in turn, allowed anticipation of possible changes in distributional patterns into the future. Results indicated complex global rearrangements of potential distributional areas, which--given the impressive dispersal abilities of these two species--are likely to translate into actual distributional shifts. This exercise also signalled a crucial priority: digitization and sharing of existing distributional data so that models of this sort can be developed more rigorously, as present availability of such data is fragmentary and woefully incomplete.

Keywords: chikungunya; climate change; dengue; mosquitoes; potential distribution.


Figures

Figure 1.
Figure 1.
Summary of primary occurrence data available globally for Aedes mosquitoes in general (blue), and Ae. aegypti (black) and Ae. albopictus (yellow) in particular. (Online version in colour.)
Figure 2.
Figure 2.
Summary of modelled potential distributional patterns of Ae. aegypti and Ae. albopictus under present-day conditions based on analysis of eight principal components. (Online version in colour.)
Figure 3.
Figure 3.
Summary of modelled potential distributional patterns of Ae. aegypti and Ae. albopictus under future conditions (A1B) based on analysis of eight principal components. Confidence in present-day and future distributional potential is based on agreement among six climate models (table 1): present-day-only distributional areas are shown in blue, with model agreement regarding stability of present-day distributional areas shown via the intensity of blue shading (light blue denotes low and dark blue denotes high model agreement); future distributional potential is shown as shades of orange (light orange denotes low and dark orange denotes high model agreement in predicting future suitability). (Online version in colour.)
Figure 4.
Figure 4.
Summary of patterns of potential distributional overlap derived from ecological niche models of Ae. aegypti and Ae. albopictus worldwide, both under current conditions and under modelled future conditions (A1B scenario), based on eight principal components. (Online version in colour.)
Figure 5.
Figure 5.
Summary of patterns of change in potential presence and distributional overlap of Ae. aegypti and Ae. albopictus worldwide under the A1B scenario, continent by continent. Patterns of shift under climate change scenario A1B are shown via transition matrices for each continent: rows indicate present-day situation, and columns indicate model projections of future potential. AL, Ae. albopictus; AE, Ae. aegypti; B, both species; –, neither species. (Online version in colour.)
Figure 6.
Figure 6.
Overlay of independent occurrence dataset (yellow triangles) on model predictions for present-day potential distributions of Ae. aegypti and Ae. albopictus. Green boxes delimit areas in which model predictions failed to anticipate known occurrences. (Online version in colour.)

Similar articles

Cited by

References

    1. Brady OJ, et al. 2012. Refining the global spatial limits of dengue virus transmission by evidence-based consensus. PLoS Negl. Trop. Dis. 6, e1760 (10.1371/journal.pntd.0001760) - DOI - PMC - PubMed
    1. Charrel RN, de Lamballerie X, Raoult D. 2007. Chikungunya outbreaks—the globalization of vectorborne diseases. New Engl. J. Med. 356, 769 (10.1056/NEJMp078013) - DOI - PubMed
    1. Jentes ES, et al. 2011. The revised global yellow fever risk map and recommendations for vaccination, 2010: consensus of the Informal WHO Working Group on Geographic Risk for Yellow Fever. Lancet Infect. Dis. 11, 622–632. (10.1016/S1473-3099(11)70147-5) - DOI - PubMed
    1. Rogers D, Wilson A, Hay S, Graham A. 2006. The global distribution of yellow fever and dengue. Adv. Parasitol. 62, 181–220. (10.1016/S0065-308X(05)62006-4) - DOI - PMC - PubMed
    1. Van Kleef E, Bambrick H, Hales S. 2010. The geographic distribution of dengue fever and the potential influence of global climate change. TropIKA.net. See http://journal.tropika.net/scielo.php?script=sci_arttext&pid=S2078-86062...

LinkOut - more resources