. 2015 Feb 17:5:8512.
doi: 10.1038/srep08512.

Chromatin compaction under mixed salt conditions: opposite effects of sodium and potassium ions on nucleosome array folding

Affiliations

Chromatin compaction under mixed salt conditions: opposite effects of sodium and potassium ions on nucleosome array folding

Abdollah Allahverdi et al. Sci Rep. .

Abstract

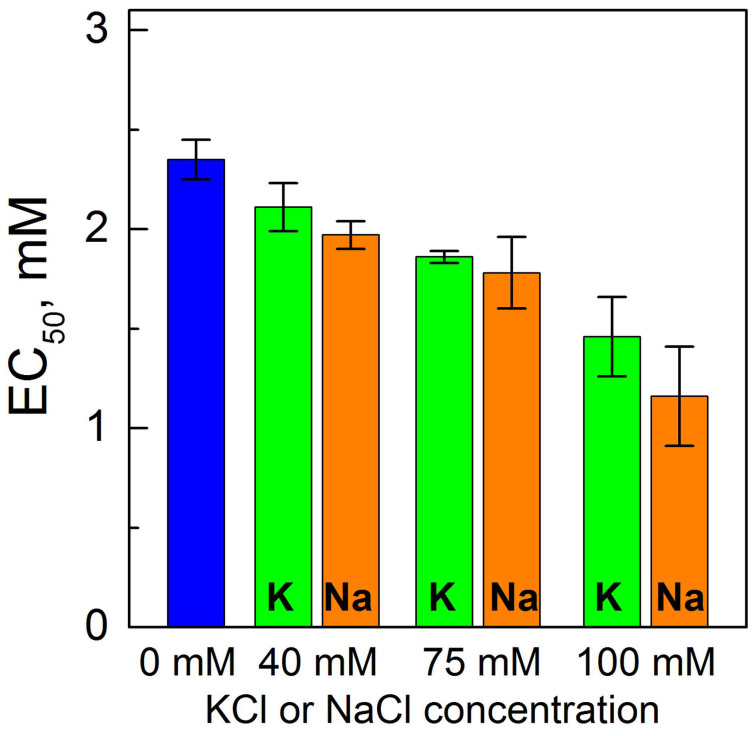
It is well known that chromatin structure is highly sensitive to the ionic environment. However, the combined effects of a physiologically relevant mixed ionic environment of K(+), Mg(2+) and Na(+), which are the main cations of the cell cytoplasm, has not been systematically investigated. We studied folding and self-association (aggregation) of recombinant 12-mer nucleosome arrays with 177 bp DNA repeat length in solutions of mixtures of K(+) and Mg(2+) or Na(+) and Mg(2+). In the presence of Mg(2+), the addition of sodium ions promotes folding of array into 30-nm fibres, whereas in mixtures of K(+) and Mg(2+), potassium ions abrogate folding. We found that self-association of nucleosome arrays in mixed salt solutions is synergistically promoted by Mg(2+) and monovalent ions, with sodium being slightly more efficient than potassium in amplifying the self-association. The results highlight the importance of a mixed ionic environment for the compaction of chromatin under physiological conditions and demonstrate the complicated nature of the various factors that determine and regulate chromatin compaction in vivo.


Figures

Figure 1
Figure 1. van Holde-Weischet analysis of the AUC-SV data obtained in mixed salt solutions.
Each graph presents the data determined at fixed concentration of NaCl or KCl (indicated at the top of the graph); each curve in the graphs was recorded for a given Mg2+ concentration. In each graph, the two vertical dashed lines indicate the s20,w values characteristic of the 12-177-601 array respectively in unfolded state at low salt concentration (TEK buffer; s20,w = 35.2 S) and in fully folded state obtained at 100 mM NaCl (s20,w = 55 S); the horizontal dashed line marks the 50% boundary.
Figure 2
Figure 2. Summary of AUC-SV results.
(A). Values of sedimentation velocity coefficient, s20,w, are displayed as a function of Mg2+ concentration at fixed concentration of added KCl (green) or NaCl (orange). Blue points are Mg2+-concentration dependence in the absence of added monovalent salt (data from Ref. 22). (B). Dependence of the s20,w values on KCl or NaCl concentration in the absence of Mg2+ (hollow points; data from Ref. 22) or in the presence of 1 mM Mg2+ (solid points). All solutions contained TEK buffer. Error bars were calculated from 2–3 independent AUC scans and using s20,w values within 20–80% of boundary. For 1 mM Mg2+ with added NaCl (solid triangles in (B)), the s20,w values exceed the ones expected for the fully folded array (~55 S) and are of low quality (as indicated by large error bars) demonstrating array aggregation.
Figure 3
Figure 3. Mg2+-induced precipitation of the nucleosome arrays.
Relative absorbance at 259 nm determined in the supernatant of the array solution with fixed concentrations of KCl (A) or NaCl (B) is plotted as a function of MgCl2 concentration. (All solutions contained 10 mM Tris buffer, pH 7.5). Points are experimental results; curves are sigmoidal fitting of the data. The dashed horizontal line indicates the midpoint of precipitation (EC50).
Figure 4
Figure 4. Summary of the precipitation assay results.
Midpoints of the Mg2+-induced precipitation, EC50, obtained in 10 mM Tris·HCl, pH 7.5 buffer without added monovalent salt (blue bar) or with 40, 75, 100 mM of added KCl (green) or NaCl (orange).

References

    1. Wolffe A. P. Chromatin: Structure and function, 447 (Academic Press, San DiegoCA, 1998).
    1. Routh A., Sandin S. & Rhodes D. Nucleosome repeat length and linker histone stoichiometry determine chromatin fiber structure. Proc. Natl. Acad. Sci. U. S. A. 105, 8872–8877 (2008). - PMC - PubMed
    1. Grigoryev S. A. & Woodcock C. L. Chromatin organization - The 30 nm fiber. Exp Cell Res. 318, 1448–1455 (2012). - PubMed
    1. Maeshima K., Imai R., Tamura S. & Nozaki T. Chromatin as dynamic 10-nm fibers. Chromosoma 123, 225–237 (2014). - PMC - PubMed
    1. Woodcock C. L., Skoultchi A. I. & Fan Y. Role of linker histone in chromatin structure and function: H1 stoichiometry and nucleosome repeat length. Chromosome Res. 14, 17–25 (2006). - PubMed

Publication types