. 2015 Mar 27;290(13):8310-20.
doi: 10.1074/jbc.M115.639831. Epub 2015 Feb 16.

Sulfide oxidation by a noncanonical pathway in red blood cells generates thiosulfate and polysulfides

Affiliations

Sulfide oxidation by a noncanonical pathway in red blood cells generates thiosulfate and polysulfides

Victor Vitvitsky et al. J Biol Chem. .

Abstract

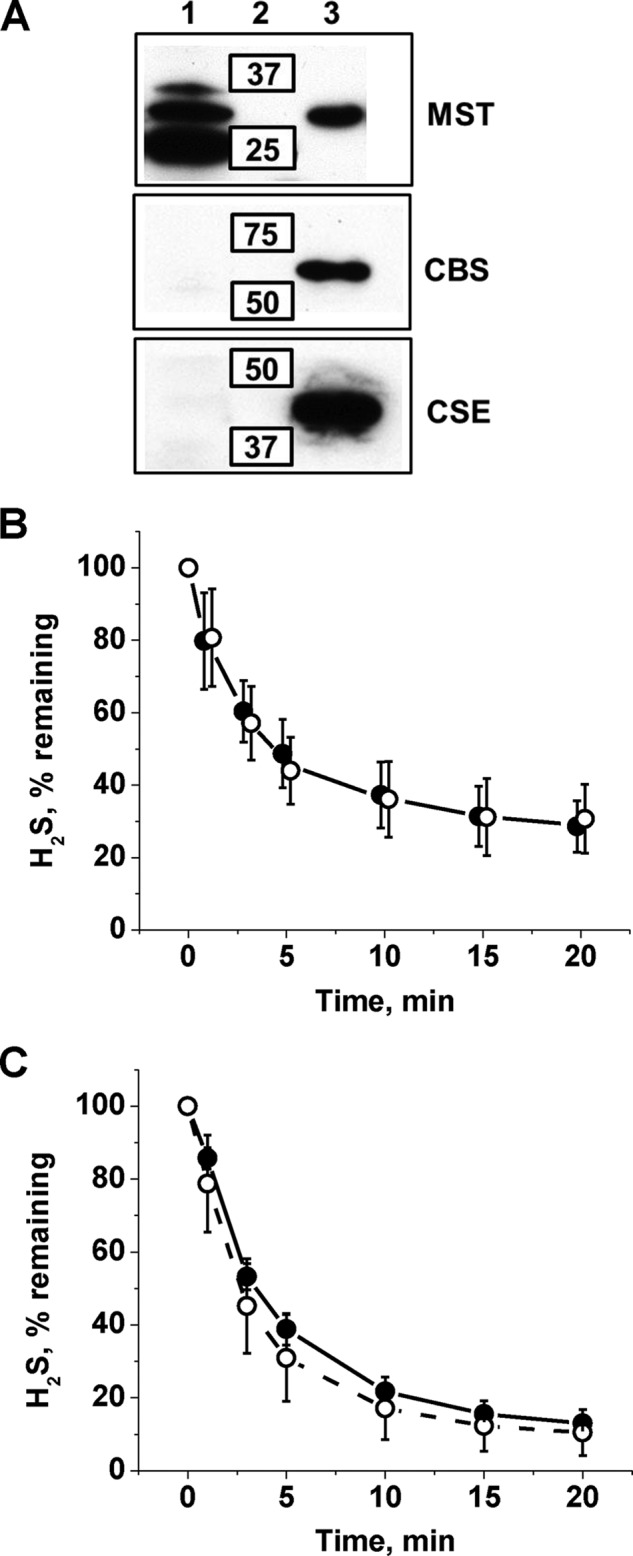
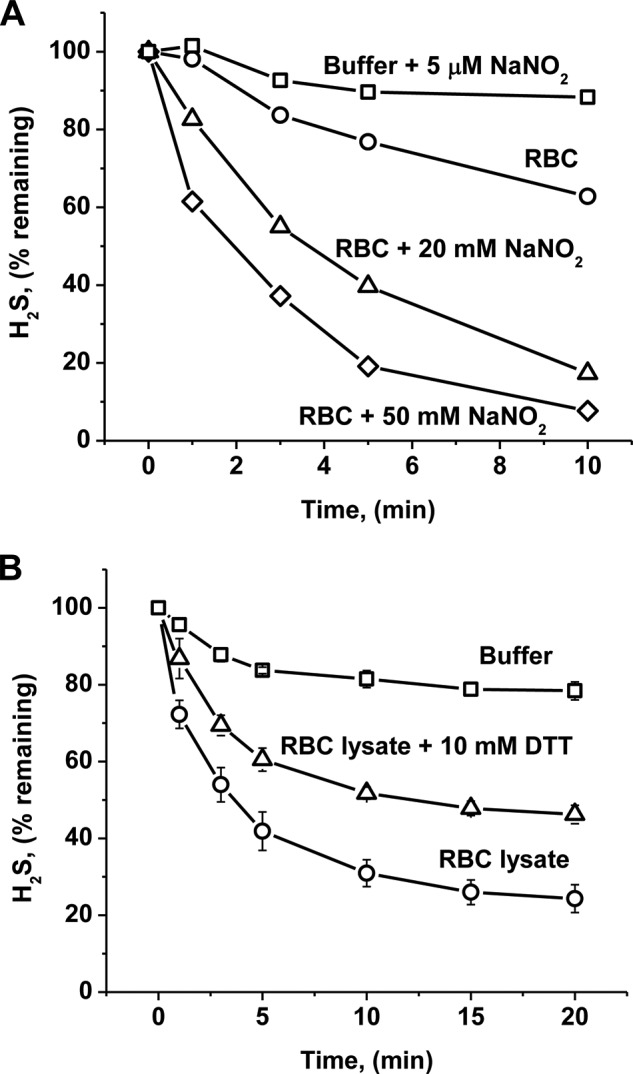
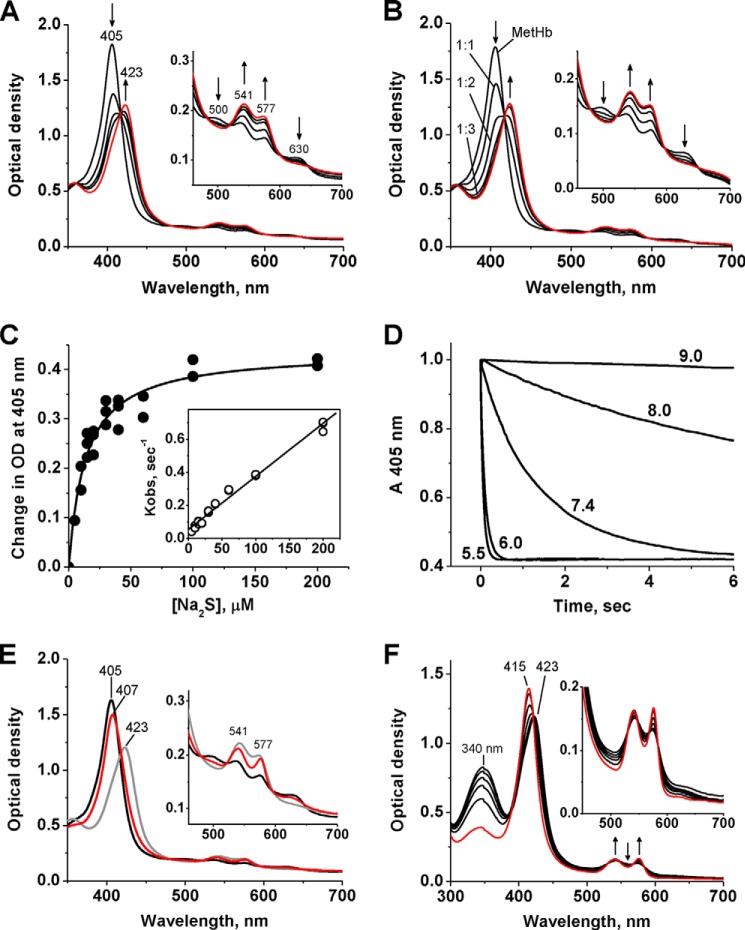
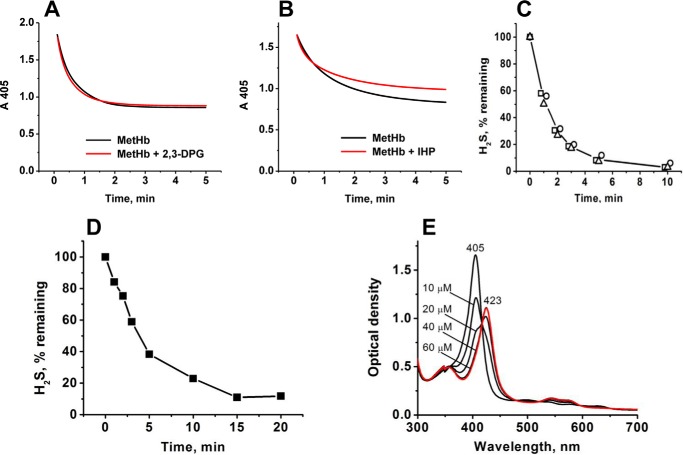
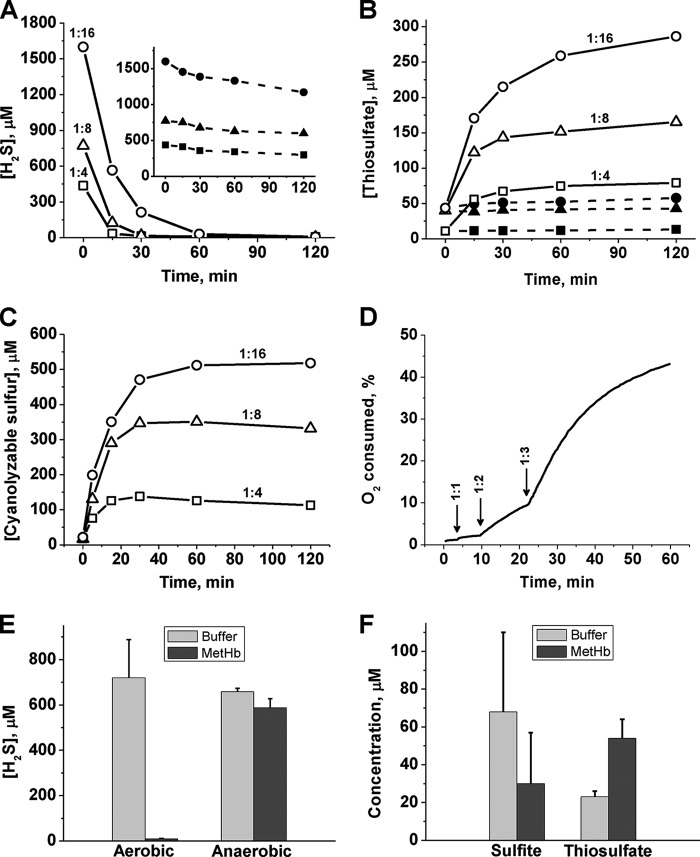
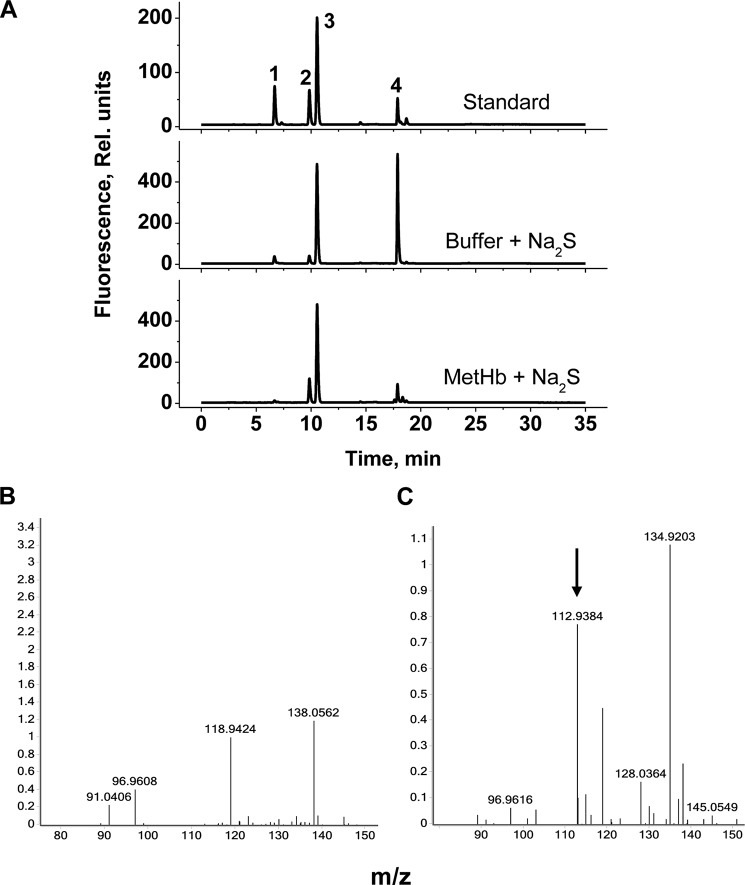
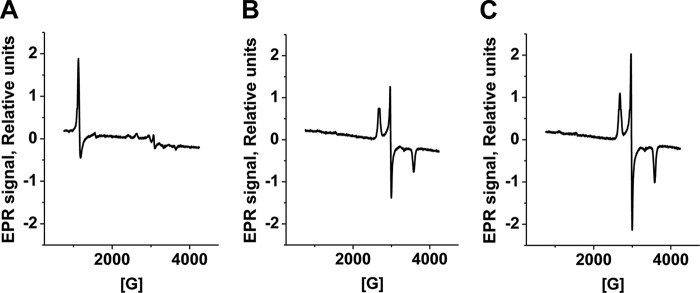
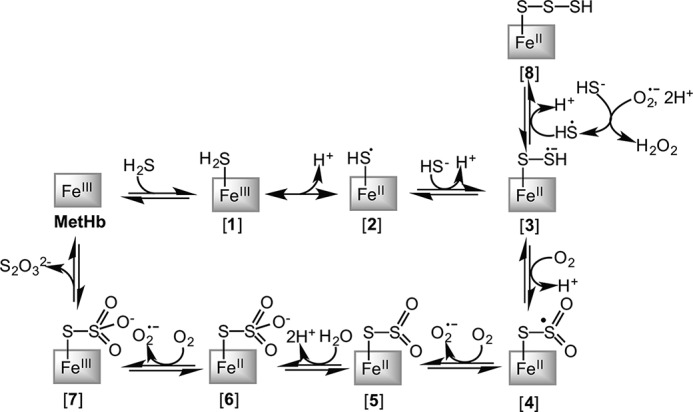
A cardioprotectant at low concentrations, H2S is a toxin at high concentrations and inhibits cytochrome c oxidase. A conundrum in H2S homeostasis is its fate in red blood cells (RBCs), which produce H2S but lack the canonical mitochondrial sulfide oxidation pathway for its clearance. The sheer abundance of RBCs in circulation enhances the metabolic significance of their clearance strategy for H2S, necessary to avoid systemic toxicity. In this study, we demonstrate that H2S generation by RBCs is catalyzed by mercaptopyruvate sulfurtransferase. Furthermore, we have discovered the locus of sulfide oxidation in RBCs and describe a new role for an old protein, hemoglobin, which in the ferric or methemoglobin state binds H2S and oxidizes it to a mixture of thiosulfate and hydropolysulfides. Our study reveals a previously undescribed route for the biogenesis of hydropolysulfides, which are increasingly considered important for H2S-based signaling, but their origin in mammalian cells is unknown. An NADPH/flavoprotein oxidoreductase system restores polysulfide-carrying hemoglobin derivatives to ferrous hemoglobin, thus completing the methemoglobin-dependent sulfide oxidation cycle. Methemoglobin-dependent sulfide oxidation in mammals is complex and has similarities to chemistry reported for the dissolution of iron oxides in sulfidic waters and during bioleaching of metal sulfides. The catalytic oxidation of H2S by hemoglobin explains how RBCs maintain low steady-state H2S levels in circulation, and suggests that additional hemeproteins might be involved in sulfide homeostasis in other tissues.

Keywords: Heme; Hemoglobin; Hydrogen Sulfide; Oxidation-Reduction (Redox); Sulfur.


Figures

FIGURE 1.
FIGURE 1.
H2S metabolism in human RBCs. A, Western blot analysis of RBC samples (200 μg of Hb/lane) and human recombinant MST, CBS, and CSE standards indicate the presence of MST but not the other two H2S-generating enzymes. Lanes 1, 2, and 3 contain samples, molecular weight standards, and purified proteins, respectively. B and C, kinetics of H2S clearance by a 10% (v/v) suspension of human RBCs in PBS, pH 7.4, 25 °C (B) and by human MetHb (0.5 mg ml−1) in 100 mm HEPES, pH 7.4, 25 °C (C) under aerobic (–●–) or anaerobic conditions (–○–). The data presented in B and C represent the mean ± S.D. of three independent experiments.
FIGURE 2.
FIGURE 2.
Modulation of H2S binding kinetics by sodium nitrate or DTT. A, an RBC suspension (10% (v/v) in PBS containing 5 mm glucose) was used to monitor clearance of 17.9 nmol of H2S at 25 °C under anaerobic conditions. The RBCs were untreated (○), pretreated with 20 mm NaNO2 for 60 min (▵), or with 50 mm NaNO2 for 10 min (◇). Excess NaNO2 was removed by extensive washing prior to the start of the experiment as described under “Experimental Procedures” and was present at <3 nmol in the reaction mixture. PBS with 5 μm NaNO2 was used as a blank (□). B, RBC lysate (1:9 v/v in 100 mm HEPES buffer, pH 7.4, 25 °C) was treated with 10 mm DTT at 25 °C under anaerobic conditions. The symbols represent buffer only (□), RBC lysate (○), and RBC lysate with 10 mm DTT (▵). Data are the mean ± S.D. of four independent experiments with RBCs from four different donors.
FIGURE 3.
FIGURE 3.
Spectral changes associated with interaction of human MetHb with H2S. A, Na2S (40 μm) was added to 2.5 μm human MetHb (10 μm heme) in 100 mm HEPES, pH 7.4, at 25 °C under aerobic conditions, and successive spectra were recorded at 1, 2, 3, and 30 min (red line), respectively. The inset shows the α/β peaks on an expanded scale. B, spectral changes observed upon mixing 2.5 μm MetHb at heme:Na2S varying from 1:1 to 1:6. The conditions were the same as described in A, and each spectrum was recorded 3 min after the addition of Na2S. The initial MetHb spectrum has a peak at 405 nm, and the final spectra (in red) were obtained in the presence of a 4–6-fold excess of Na2S over heme and are superimposable. The inset shows the α/β peaks on an expanded scale. C, change in the absorbance of MetHb (1 μm after mixing) in 100 mm HEPES, pH 7.4, at 405 nm on the total sulfide concentration (0–200 μm after mixing) at 37 °C. The symbols and lines represent the experimental points and hyperbolic fit to the data, respectively. The inset shows the dependence of kobs on total [Na2S]. The data were obtained using stopped-flow spectrometry under anaerobic conditions. D, stopped flow kinetic analysis of the pH dependence of Na2S binding to MetHb. MetHb (2.5 μm) was prepared in buffers with different pH values as described under “Experimental Procedures” and mixed aerobically with 2 mm Na2S (before mixing) prepared in the same buffers at 25 °C. The pH values are indicated on the curves. E, long-term effects of Na2S interaction with MetHb under aerobic conditions. Na2S (60 μm final concentration) was added to MetHb (2.5 μm, black) in 100 mm HEPES, pH 7.4, at 25 °C, and the spectrum was recorded after 15 min (gray) and after 47 h (red), during which time the sample was kept in a sealed cuvette in the dark. The inset shows the α/β peaks on an expanded scale. F, conversion of the 423 nm Hb species to oxyhemoglobin (red) in the presence of recombinant human MSR (0.2 μm) and NADPH (100 μm). The 423 nm Hb species was obtained by treatment of 2.5 μm MetHb with 30 μm Na2S in 100 mm HEPES, pH 7.4, under aerobic conditions for 15 min at 25 °C. The first spectrum was obtained immediately after the addition of NADPH and MSR, and subsequent spectra were recorded after 10, 30, 60, and 120 min and 5 h. The arrows show the direction of spectral changes with time. The inset shows the α/β peaks on an expanded scale.
FIGURE 4.
FIGURE 4.
Effects of 2,3-diphosphoglycerate (2,3-DPG), inositol hexaphosphate (IHP), and the sickle cell mutation, HbS, on the interaction of H2S with MetHb. A and B, kinetics of decrease in MetHb concentration in 100 mm HEPES buffer, pH 7.4, 25 °C (detected at 405 nm) after the addition of 50 μm Na2S to an aerobic solution of 2.5 μm MetHb with (red) or without (black) 5 mm 2,3-diphosphoglycerate (A) or 5 mm inositol hexaphosphate (B). C, clearance of H2S by MetHb (1 mg/ml) in aerobic 100 mm HEPES buffer, pH 7.4, in the absence (○) or presence of 5 mm 2,3-diphosphoglycerate (□) or 5 mm inositol hexaphosphate (▵) at 25 °C. The data represent the average of two experiments. D, H2S clearance by MetHbS (1 mg/ml) in 100 mm HEPES buffer, pH 7.4, at 25 °C. E, spectral changes elicited by binding of 0–60 μm Na2S to 2.5 μm MetHbS in 100 mm HEPES buffer, pH 7.4, 25 °C. The final spectrum is shown in red and does not change with additional Na2S aliquots.
FIGURE 5.
FIGURE 5.
H2S oxidation by MetHb. A and B, kinetics of H2S disappearance (A) and thiosulfate accumulation (B) following the addition of varying initial concentrations of Na2S to 100 mm HEPES buffer, pH 7.4 (filled symbols and dashed lines), or to 25 μm human MetHb at 25 °C (open symbols and solid lines) under aerobic conditions. The heme:Na2S ratios are indicated. C, kinetics of polysulfide accumulation in the reaction mixtures described in A and B. D, kinetics of O2 consumption in a solution containing 25 μm MetHb in 100 mm HEPES buffer, pH 7.4, at 25 °C following the addition of Na2S aliquots (indicated by arrows), resulting in heme:sulfide stoichiometry ranging from 1:1 to 1:3. E and F, H2S concentration remaining after a 1-h incubation of 800 μm Na2S at 25 °C in 100 mm HEPES buffer, pH 7.4, ± 25 μm MetHb (E) and concentration of sulfite and thiosulfate under anaerobic conditions (F).
FIGURE 6.
FIGURE 6.
HPLC and MS analysis of sulfur-containing compounds. A, the upper chromatogram indicates the elution times for the monobromobimane derivatives of sodium sulfite (peak 1), sodium thiosulfate (peak 2), and sodium sulfide (peak 4). Peak 3 corresponds to monobromobimane. The middle chromatogram represents the control reaction mixture containing 100 mm HEPES buffer, pH 7.4, and 1 mm Na2S following a 15-min aerobic incubation at 25 °C. The bottom chromatogram was obtained following incubation of MetHb (25 μm) under the same conditions as the control sample. Note the significant decrease in the sulfide peak (4) and increase in the thiosulfate peak (2) in the presence of MetHb. B and C, ESI-mass spectrometric analysis of low molecular weight fractions of samples in 20 mm ammonium carbonate buffer, pH 7.4, containing 25 μm MetHb alone (B) or MetHb plus 1 mm Na2S (C). The peak with m/z = 112.938 (indicated by an arrow) corresponds to HS2O3. The m/z = 134.92 peak could represent the monosodium salt of HS2O3. The low molecular fractions were obtained by centrifugation using Amicon Ultra 0.5-ml centrifugal filters with a 10-kDa cutoff.
FIGURE 7.
FIGURE 7.
EPR spectra of MetHb treated with sulfide. Shown are EPR spectra of samples containing 50 μm MetHb in 100 mm HEPES, pH 7.4 (A), or after a 5-min incubation with 1200 μm Na2S under aerobic (B) or anaerobic (C) conditions at 25 °C. The EPR settings are described under “Experimental Procedures.”
FIGURE 8.
FIGURE 8.
Scheme showing the postulated mechanism for the MetHb-dependent conversion of H2S to thiosulfate and heme iron-bound polysulfides.

References

    1. Theissen U., Hoffmeister M., Grieshaber M., Martin W. (2003) Single eubacterial origin of eukaryotic sulfide:quinone oxidoreductase, a mitochondrial enzyme conserved from the early evolution of eukaryotes during anoxic and sulfidic times. Mol. Biol. Evol. 20, 1564–1574 - PubMed
    1. Cuevasanta E., Denicola A., Alvarez B., Möller M. N. (2012) Solubility and permeation of hydrogen sulfide in lipid membranes. PloS One 7, e34562. - PMC - PubMed
    1. Riahi S., Rowley C. N. (2014) Why can hydrogen sulfide permeate cell membranes? J Am. Chem. Soc. 136, 15111–15113 - PubMed
    1. Kimura H. (2010) Hydrogen sulfide: from brain to gut. Antioxid. Redox Signal. 12, 1111–1123 - PubMed
    1. Kabil O., Vitvitsky V., Banerjee R. (2014) Sulfur as a signaling nutrient through hydrogen sulfide. Ann. Rev. Nutr. 34, 171–205 - PMC - PubMed

Publication types

LinkOut - more resources