. 2015 Aug 1;523(11):1639-63.
doi: 10.1002/cne.23761. Epub 2015 Apr 2.

Vesicular stomatitis virus enables gene transfer and transsynaptic tracing in a wide range of organisms

Affiliations

Vesicular stomatitis virus enables gene transfer and transsynaptic tracing in a wide range of organisms

Nathan A Mundell et al. J Comp Neurol. .

Abstract

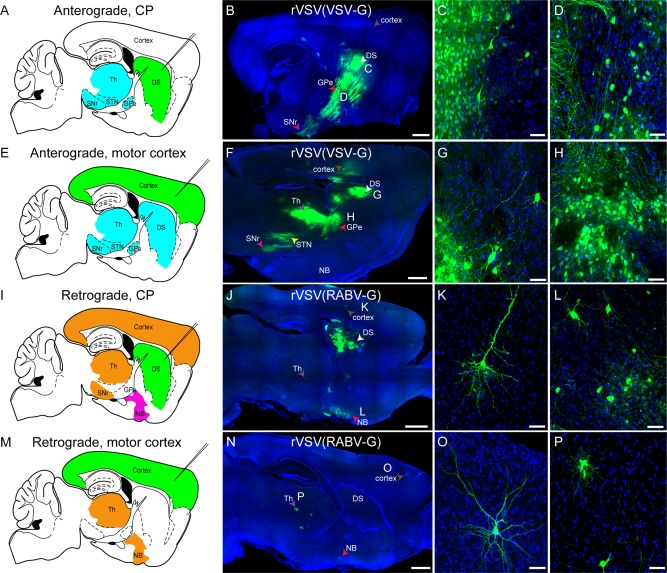
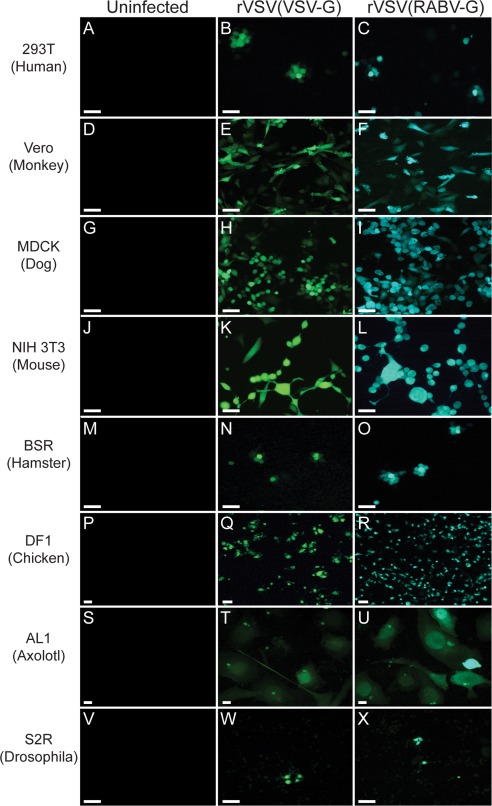
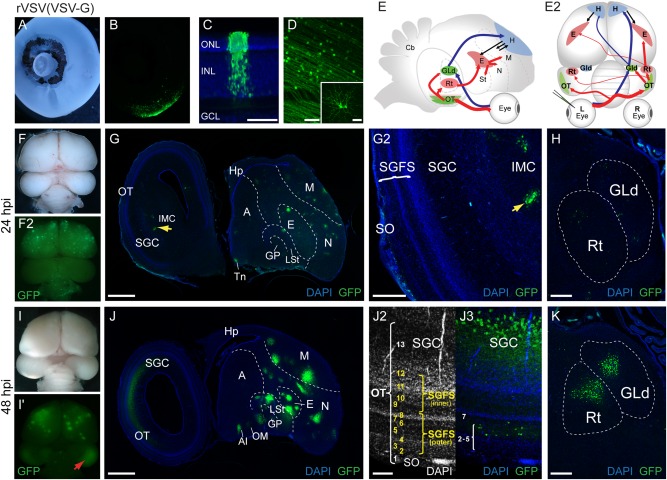
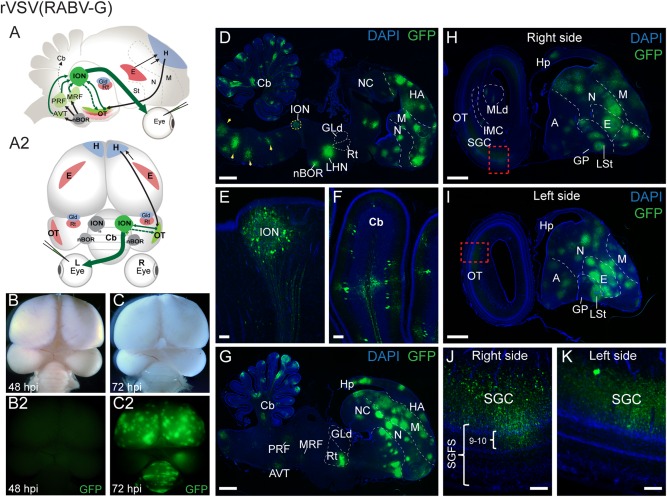
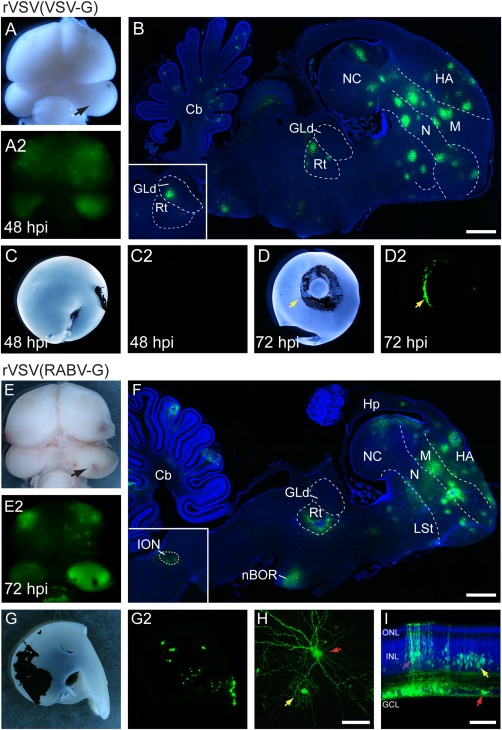
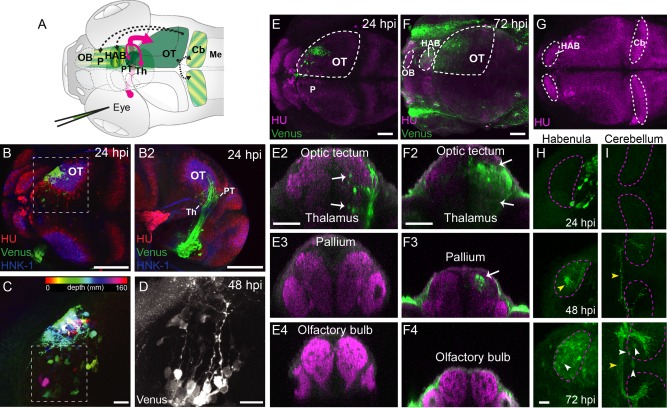
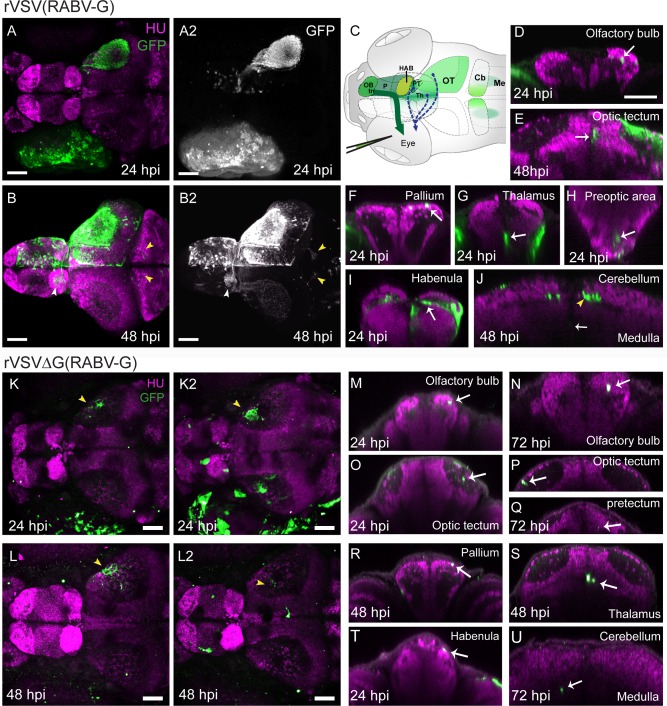
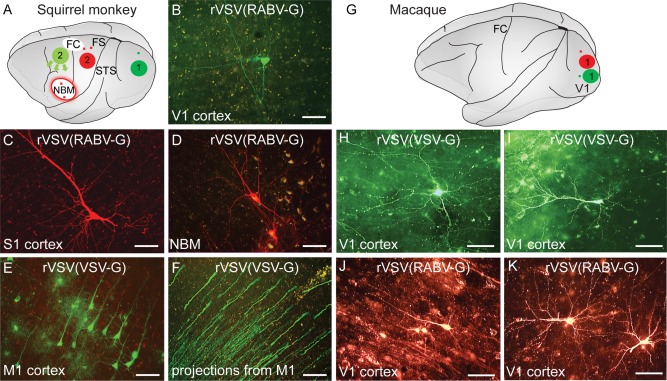
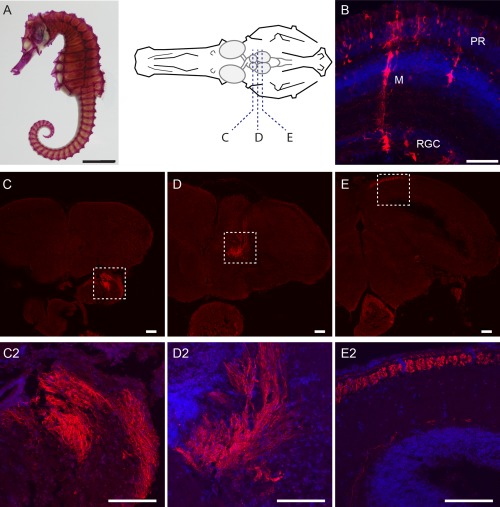
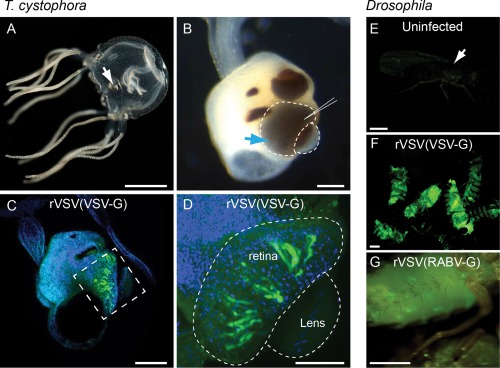
Current limitations in technology have prevented an extensive analysis of the connections among neurons, particularly within nonmammalian organisms. We developed a transsynaptic viral tracer originally for use in mice, and then tested its utility in a broader range of organisms. By engineering the vesicular stomatitis virus (VSV) to encode a fluorophore and either the rabies virus glycoprotein (RABV-G) or its own glycoprotein (VSV-G), we created viruses that can transsynaptically label neuronal circuits in either the retrograde or anterograde direction, respectively. The vectors were investigated for their utility as polysynaptic tracers of chicken and zebrafish visual pathways. They showed patterns of connectivity consistent with previously characterized visual system connections, and revealed several potentially novel connections. Further, these vectors were shown to infect neurons in several other vertebrates, including Old and New World monkeys, seahorses, axolotls, and Xenopus. They were also shown to infect two invertebrates, Drosophila melanogaster, and the box jellyfish, Tripedalia cystophora, a species previously intractable for gene transfer, although no clear evidence of transsynaptic spread was observed in these species. These vectors provide a starting point for transsynaptic tracing in most vertebrates, and are also excellent candidates for gene transfer in organisms that have been refractory to other methods.

Keywords: AB_10562207; AB_531908; AB_591819; RRID: AB_10053281; SciRes_000161; VSV; anterograde; centrifugal; in vivo; polysynaptic; retina; retrograde; transsynaptic; visual pathways.


Figures

Figure 1
Figure 1
rVSV(VSV‐G) transmission shows an anterograde, and rVSV(RABV‐G) shows a retrograde, polysynaptic pattern of transmission among neurons in mice. (A–H) rVSV(VSV‐G) was injected into the dorsal striatum (DS) (A–D) or primary motor cortex (E–H), and animals were sacrificed 3 dpi. (A) Schematic of regions expected to be labeled by anterograde transsynaptic transmission (blue) of a virus from a DS injection (injection needle, green). (B–D) At 3 dpi, DS injections of rVSV(VSV‐G) resulted in patterns of infection consistent with anterograde transsynaptic transmission. Infected cells were observed near the injection site in the DS (white arrowhead), as well as in the GPe (red arrowhead), SNr (pink arrowhead), and the thalamus. The cortex, which projects to the DS, was not labeled (brown arrowhead). Higher‐magnification images of neurons in the DS (C) and GPe (D) are shown. (E) Schematic of regions expected to be labeled by anterograde transsynaptic transmission (blue) of a virus from a primary motor cortex injection (injection needle, green). (F–H) Injection of rVSV(VSV‐G) into the primary motor cortex labeled cells locally in the cortex (brown arrowhead), and the same regions as a direct DS injection, including the DS (white arrowhead), GPe (red arrowhead), STN (yellow arrowhead), SNr (pink arrowhead), and thalamus (purple arrowhead). High‐magnification images of DS neurons (G), and neurons in the GPe (H) are provided. (I) Schematic of regions expected to be labeled by initial infection by retrograde uptake, and/or by retrograde transsynaptic transmission (orange), with the nucleus basalis (NB) predicted to be labeled only by retrograde transmission (magenta) of rVSV(RABV‐G) from a DS injection (injection needle, green). (J–L) rVSV(RABV‐G) was injected into the DS. At 3 dpi, this injection resulted in infected cells in retrograde targets, including local infection in the DS (white arrowhead), cortex (brown arrowhead), NB (red arrowhead), and the thalamus (purple arrowhead). High magnifications of a cortical neuron (K), and NB neurons (L) are shown. (M) Schematic of regions expected to be labeled by initial infection by retrograde uptake, and/or by transsynaptic transmission (orange) of a retrograde virus from a primary motor cortex injection (injection needle, green). (N–P) Injections of rVSV(RABV‐G) into the primary motor cortex labeled neurons at the injection site in the cortex (brown arrowhead), as well as the NB (red arrowhead) and thalamus (purple arrowhead), but not the DS. Higher magnification of a cortical neuron (O) and thalamic neurons (P) are shown. Multiple types of neurons, including glutamatergic (e.g., cortical pyramidal neurons, panels K,O), GABAergic (DS medium spiny neurons, panels C,G), and cholinergic (NB neurons, panel L), were labeled. DS = dorsal striatum, Th = thalamus, STN = subthalamic nucleus, GPe = globus pallidus external segment, SNr = substantia nigra pars reticulata, NB = nucleus basalis. Scale bars = 1 mm in B,F,J,N; 50 μm in C,D,G,H,K,L,O,P.
Figure 2
Figure 2
A variety of cell lines from different organisms were infectable with VSV vectors. Cells were infected with either rVSV(VSV‐G) or rVSV(RABV‐G) and assayed for Venus or GFP fluorescence at 1 dpi. Chamber slides of (A–C) human 293T cells, (D–F) Vero monkey cells, (G–I) dog MDCK cells, (J–L) mouse NIH 3T3 cells, (M–O) hamster BSR cells, (P–R) chick DF1 cells, (S–U) salamander AL1 cells, or (V–X) Drosophila S2R cells were infected with 1 μL of 1 × 105 ffu/mL of either rVSV(VSV‐G) (B,E,H,K,N,Q,T,W), or rVSV(RABV‐G) (C,F,I,L,O,R,U,X). The virus used to infect is indicated above the panels. Negative controls (A,D,G,J,M,P,S,V) were not exposed to virus. Scale bars = 50 μm.
Figure 3
Figure 3
In ovo rVSV(VSV‐G) infection of the chicken eye shows an anterograde transsynaptic pattern of spread. (A–D) Injection of rVSV(VSV‐G) into the left eye of E14 chicken embryos resulted in viral gene expression in the retina (A,B). Transverse section through an infected retina at 48 hpi showing a column of labeled photoreceptor cells and associated GFP‐positive cells. Labeled cells were found in the outer nuclear layer (ONL) and inner nuclear layer (INL), but were absent from RGCs within these columns (C). This columnar transmission pattern was only detected near the injection site. In the posterior area of the retina in C, whole‐mount confocal images show a large number of labeled RGCs with axons directed towards the optic fissure (D). Inset in D shows high magnification of a labeled RGC. (E–E2) Schematic of expected anterograde transsynaptic transmission of rVSV(VSV‐G) through the tectofugal (E,E2, red arrows) and thalamofugal (E,E2, blue arrows) visual pathways illustrated in parasagittal (E) and dorsal (E2) views. (F–K) The pattern of virus infection in whole brains at 24 hpi (F–F2) and 48 hpi (I–I2) after unilateral injection of rVSV(VSV‐G) into the left eye. Red arrow (I2) indicates fluorescent protein expression in the OT. Sagittal sections at 24 hpi show the pattern of rVSV(VSV‐G) transmission within the brain (G). Labeled RGC axons were present in the stratum opticum (SO) of the optic tectum (OT), and sparse labeled cell bodies were detected in the SGFS, IMC (G,G2) and the Rt (H). A few labeled cells were also detected within the GLd (H). At 48 hpi, fluorescent protein expression was greatly increased within primary, secondary, and higher order sites of the visual pathways (J). Higher‐magnification confocal image of the OT with DAPI staining to highlight tectal layers (J2) and detection of viral infection (J3) shows rVSV(VSV‐G) transmission to retinorecipient layers of the SGFS and the SGC output layer of the OT (J3). As compared to expression at 24 hpi (H), fluorescent protein expression was greatly increased within the GLd and the Rt at 48 hpi (K). A = arcopallium, AI = Arcopallium intermedium, E = entopallium, GCL = ganglion cell layer, GLd = dorsal lateral geniculate nucleus, GP = globus pallidus, H = hyperpallium, Hp = hippocampus, IMC = nucleus isthmi pars magnocellularis, INL = inner nuclear layer (of retina), LSt = lateral striatum, M = mesopallium, N = nidopallium, OT = optic tectum, ONL = outer nuclear layer (of retina), Rt = nucleus rotundus, SGC = stratum griseum central (of OT), SGFS = stratum griseum et fibrosum superficiale (of OT), St = striatum, SAC = stratum album central (of OT), SGP = stratum griseum periventriculare (of OT), SO = stratum opticum (of OT), Tn = nucleus teaniae, VL = ventricular layer (of OT). Scale bars = 50 μm in C,D; 1 mm in G,J; 300 μm in G2,H,K; and 100 μm in J2,J3.
Figure 4
Figure 4
In ovo rVSV(RABV‐G) infection of the chicken eye shows a retrograde pattern of spread into the centrifugal visual system. (A–A2) Illustrations of the centrifugal visual system (green arrows) shown in parasagittal (A) and dorsal (A2) views. Centrifugal neurons in the isthmo‐optic nucleus (ION) target amacrine cells in the retina (A–A2, large green arrow) and have collateral axons that transiently project to the OT during development (dashed arrow). Brain regions that provide visual input to the ION include afferents from the OT, mesencephalic reticular formation (MRF), pontine reticular formation (PRF), and the area ventralis of Tsai (AVT).(B–K) GFP expression reveals a retrograde pattern of rVSV(RABV‐G) transsynaptic transmission within the brain following infection of the left retina at E14. GFP expression was not detected in the brain at 24 hpi or 48 hpi (B–B2). However, at 72 hpi widespread GFP expression was observed in the forebrain, right medial midbrain and cerebellum (C–C2). Sagittal sections through the right medial brain show rVSV(RABV‐G) transmission in regions associated with the centrifugal visual pathway and accessory optic system including the ION (D,E), nBOR (D), brainstem (D, yellow arrowheads) and cerebellum (D,F). GFP‐expressing cells also were detected in several putative retrograde targets that project to the ION (and also receive inputs from nBOR) including the MRF, PRF, and AVT (G). Distal sections through the right (H,J) and left (I,K) brain show GFP expression in the contralateral OT, including in the SGC layer and layers 9–10 of the SGFS (J,K). A = arcopallium, AVT = area ventralis of Tsai, Cb = cerebellum, E = entopallium, GLd = dorsal lateral geniculate nucleus, GP = globus pallidus, H = hyperpallium, HA = hyperpallium apicale, Hp = hippocampus, IMC = nucleus isthmi pars magnocellularis, ION = isthmo‐optic nucleus, LHN = lateral hypothalamic nucleus (visual suprachiasmatic nucleus), LSt = lateral striatum, M = mesopallium, MLd = mesencephalicus lateralis pars dorsalis, MRF = mesencephalic reticular formation, nBOR = nucleus of the basal optic root, N = nidopallium, NC = nidopallium caudale, OT = optic tectum, PRF = pontine reticular formation, Rt = nucleus rotundus, SGC = stratum griseum central (of OT), SGFS = stratum griseum et fibrosum superficiale (of OT), St = striatum. Scale bars = 1 mm in D,G,H,I; 100 µm in E,F,J,K.
Figure 5
Figure 5
Infection with rVSV(RABV‐G), but not rVSV(VSV‐G), in the chicken optic tectum results in retrograde transmission from the brain to the retina. (A–D2) Injection of rVSV(VSV‐G) into the right optic tectum (OT) (arrow) resulted in an anterograde transsynaptic pattern of spread in the brain. Whole‐mount dorsal views of brightfield (A) and GFP expression (A2) in the brain at 48 hpi. Sagittal section showing GFP‐positive cells (B) in the Rt, GLd (inset from a semi‐adjacent section), and telencephalon (nidopallium, mesopallium, and hyperpallium) consistent with anterograde labeling from the OT with rVSV(VSV‐G). Brightfield (C,D) and fluorescent protein expression (C2,D2) in posterior (C) and anterior (D) views of retinae after rVSV(VSV‐G) infection of the OT. GFP expression was not detected in the retina at 48 or 72 hpi (n = 7) (C‐D2). In 2/7 embryos, GFP‐positive cells were detected in the ciliary body surrounding the lens (D,D2, yellow arrow) but were absent from the retina. (E–I) Injection of rVSV(RABV‐G) into the OT resulted in retrograde transmission and GFP expression in the retina. Dorsal views of brightfield and fluorescent (GFP) images (E–E2) of the brain at 72 hpi. Sagittal section showing GFP expression in the brain (F) including in the ION (inset), nBOR, cerebellum, Rt, and telencephalon. At 72 hpi, OT injections with rVSV(RABV‐G) resulted in in clusters of GFP‐positive cells throughout the retina (n = 3) (G–G2). Confocal z‐stack projection showing GFP expression in a RGC (H, red arrow) and an adjacent amacrine cell (H, yellow arrow) in a flat‐mount preparation of the left retina. Transverse section through a retina shows GFP expression in several retinal cell types including RGCs (I, red arrow), Müller glia (I, purple arrow), and amacrine cells in the lower half of the INL (I, yellow arrow). GFP‐expressing cells in the INL were only found in locations proximal to GFP‐positive RGCs. Cb = cerebellum, GCL=ganglion cell layer (of retina), GLd = dorsal lateral geniculate nucleus, HA = hyperpallium apicale, Hp = hippocampus, INL = inner nuclear layer (of retina), LSt = lateral striatum, M = mesopallium, nBOR = nucleus of the basal optic root, N = nidopallium, NC = nidopallium caudale, ONL = outer nuclear layer (of retina), Rt = nucleus rotundus. Scale bars = 1 mm in B,F; 50 μm in H,I.
Figure 6
Figure 6
Transsynaptic labeling of the visual pathway in larval zebrafish infected with rVSV(VSV‐G). (A) Diagram of unilateral eye injection. RGC axons (red arrows) project contralaterally to the optic tectum, pretectum, and thalamus. The locations of rVSV(RABV‐G)‐infected cells are indicated by green shaded areas. Putative axonal projections from the OT to the pallium, habenula, and cerebellum are labeled as dashed arrows. (B–D) rVSV(VSV‐G) infection of the OT. Dorsal (B) and lateral (B2) views of a 24 hpi zebrafish stained for Venus (green), HuC/D (red, pan‐neuronal marker), and HNK1 (blue, neuropil). Labeled RGC termini and tectal cell bodies can be seen in the right (contralateral) tectum. Boxed area in B is shown at higher magnification in C. Spectrum of colors represents depth from the dorsal surface of the tectum (red‐yellow) to the ventral surface (blue‐pink) for Venus‐labeled cells. (D) High magnification of contralateral Venus‐labeled tectal cells at 48 hpi, in location similar to C (boxed area). The majority of the labeled tectal neurons had a single process extending medially, consistent with the previously described morphology of retinorecipient neurons (Robles et al., 2011). (E,F) Dorsal views of confocal maximal projections show rVSV(VSV‐G) labeling at 24 hpi (E) and 72 hpi (F). Areas delineated by dashed lines are the OT, habenula, and olfactory bulb. Transverse optical sections from each stage are shown in panels below (E2–E4 for 24 hpi and F2–F4 for 72 hpi). (G–I) Dorsal view of the zebrafish brain (3 dpf), stained with HuC (G). Areas delineated by dashed lines are the habenula and cerebellum, which are shown at higher magnification in H and I, respectively. 24 hpi labeling was restricted to the optic tectum, pretectum, and thalamus. At 72 hpi, labeling broadened and included cells in the pallium (F3), habenula (H), and the cerebellum (I). Labeled cells are indicated by white arrows or arrowheads and axons are labeled with yellow arrowheads). Venus‐expressing cells were not present in the olfactory bulb (E4, F4). CB: cerebellum, HAB = habenula, Me = medulla, OB = olfactory bulb, OT = optic tectum, P = pallium, PT = pretectum, Th = thalamus. Scale bars = 100 μm in B–B2; 20 μm in C,D; 50 μm E–F4; 20 μm in H,I.
Figure 7
Figure 7
Labeling of centrifugal circuits in zebrafish with rVSV(RABV‐G). (A,B) Dorsal view of confocal maximal projections showing rVSV(RABV‐G) labeling (green, GFP) and HU (magenta, pan‐neuronal marker) at 24 hpi (A) and 48 hpi (B). GFP channel from (A,B), with signal enhanced to show cells in the brain, is shown in (A2,B2). Images in (B–B2) were captured after dissection of the brain from surrounding tissues. GFP‐labeled axonal projections from the contralateral to the ipsilateral habenula (white arrowhead) and projections from the OT to the cerebellum (yellow arrowheads) are indicated in (B–B2). (C) Illustration showing injection of rVSV(RABV‐G) into the eye of 3 dpf larval zebrafish. Centrifugal axons in the terminal nerve (tn) originate from the contralateral olfactory bulb (OB) and ventral pallium (P), and project to target cells in the retina (dark green arrow). The locations of rVSV(RABV‐G)‐infected cells after unilateral eye injection is indicated by green shaded areas. Projections from other centrifugal neurons previously reported among teleost fish are indicated by dashed arrows from the thalamus (Th), OT, and pretectum (PT). (D–J) Transverse optical sections from 24 hpi or 48 hpi are shown. At 24 hpi, labeling is restricted to the RGC axons in the neuropil of OT, and cell bodies in the OB (D), OT (E, 48 hpi shown), pallium (F), thalamus (G), preoptic area (H), habenula (I), medulla (J, 48 hpi shown), and pretectum (not shown). At 48 hpi, additional labeling was seen, including GFP‐positive efferent axons (yellow arrowhead) projecting into the contralateral and ipsilateral cerebellum (J). (K–L2) Confocal maximal projections of GFP expression and HU after injection of 1 × 108 ffu/mL (K,L), or 1 × 109 ffu/mL (K2,L2) rVSVΔG(RABV‐G), at 24–48 hpi. Yellow arrowheads in (K–L2) indicate RGC axons in the neuropil of the OT. In zebrafish injected with the higher dose of rVSVΔG(RABV‐G), labeling revealed primary infection in centrifugal neurons. (M–U) Representative transverse optical sections from 24–72 hpi show the results of centrifugal labeling, as sparse GFP‐expressing cells in the OB (M,N), OT (O,P), pretectum (Q), pallium (R), thalamus (S), habenula (T), and medulla (U). GFP‐labeled cells were not detected in the preoptic area (not shown) and labeled axons were not present in the cerebellum (U) following infections with rVSVΔG (RABV‐G). CB = cerebellum, HAB = habenula, Me = medulla, OB = olfactory bulb, OT = optic tectum, P= pallium, PT = pretectum, PO = preoptic area, tn = terminal nerve, Scale bars: = 50 μm.
Figure 8
Figure 8
rVSVs can infect squirrel monkeys and macaques. (A) Schematic drawing of a squirrel monkey brain, indicating location of the injection sites in primary visual cortex of monkey #1 (dark green), in the motor cortex (light green), and in the somatosensory cortex (red) of monkey #2. Arrows indicate projections originating at the site of the motor cortex injection, small red and green dots represent retrogradely labeled neurons from the sites of somatosensory and visual cortex injections, respectively. The area demarcated by the red oval corresponds to the nucleus basalis of Meynert (NBM) (B) A GFP‐expressing neuron in the visual cortex after injection of rVSV(RABV‐G) encoding GFP into the primary visual cortex in monkey #1. This pyramidal neuron is located ∼3 mm dorsal to the injection site and is presumably labeled by retrograde uptake of the primary inoculum. (C,D) Neuronal labeling by presumed retrograde uptake after injection of an mCherry‐encoding rVSV(RABV‐G) into the primary somatosensory cortex in monkey #2. (C) Labeled pyramidal neuron in cerebral cortex ∼3 mm dorsal to the injection site. (D) Presumptive cholinergic neurons in basal forebrain nucleus of Meynert. (E,F) Results of the injection of rVSV(VSV‐G)‐expressing Venus into the primary motor cortex of squirrel monkey #2. (E) Labeled pyramidal neurons and interneurons at the injection site. (F) Venus was seen in the axons originating from the infected neurons at the injection site, projecting away from cortex into the white matter going towards internal capsule. (G–K) Labeling of cortical neurons after rVSV injections into the primary visual area in a macaque monkey. (G) Schematic drawing of a macaque brain showing injection sites of rVSV(VSV‐G) (dark green) and rVSV(RABV‐G) (red) in the primary visual cortex. Small red and green dots represent location of rVSV(VSV‐G) (green) or rVSV(RABV‐G) (red) labeled neurons from the sites of somatosensory and visual cortex injections (H,I) Labeled neurons near the site of injection of rVSV(VSV‐G) encoding Venus into V1. (J,K) Labeled neurons near the site of injection of rVSV(RABV‐G) encoding mCherry into V1. FC = central fissure; FS = Sylvian fissure; NBM = nucleus basalis of Meynert; STS = superior temporal sulcus, V1 = primary visual cortex. Scale bars = 50 μm in B,C,E,G–J; 100 μm in D,F.
Figure 9
Figure 9
rVSV(VSV‐G) can infect seahorse retinae and allows mapping of retinorecipient areas in the brain. (A) Skeletal preparation of a seahorse (Hippocampus erectus) and schematic drawing of a seahorse skull with the brain. Dashed lines indicate approximate brain regions for sections in C–E. (B) Injection of rVSV(VSV‐G) into the retina resulted in infection of various retinal cell types (3 dpi). (C–E) Brain sections depicting labeled RGC arbors throughout the seahorse brain, following injection of rVSV(VSV‐G) into the retina. C2, D2, E2 are higher‐magnification images of RGC axons in C–E. A small number of infected cell bodies were detected in the brain. Red = GFP, blue = DAPI. PR = photoreceptors, M = Müller glia, RGC = retinal ganglion cells. Scale bars = 50 μm.
Figure 10
Figure 10
Recombinant VSV vectors can infect invertebrate organisms. (A,B) Image of the box jellyfish, Tripedalia cystophora (A). The visual system is comprised of four sensory structures, or rhopalia (white arrow in (A). Image in (B) shows higher magnification of rhopalium in (A). There are six eyes located on each rhopalium, two of which are camera‐type lens eyes (blue arrow, B). The vitreous space of the lower lens eye was injected with rVSV(VSV‐G) (injection site indicated by needle in B) and the infection was monitored for a total of 7 dpi. (C,D) Photoreceptors in all 10 injected animals expressed Venus by 2 dpi. (C) Lateral view of entire rhopalium, with orientation as in (B), shows Venus expression in the photoreceptors of the lower lens eye (C, boxed area). Green = Venus, blue = DAPI. (D) Higher magnification of boxed region in C showing rVSV(VSV‐G) infection in retinal photoreceptors of the everted lens eye (dashed lines). Images taken at 2 dpi. (E–G) Recombinant VSV vectors could also infect Drosophila melanogaster. (E) Uninfected flies were nonfluorescent, while those infected with rVSV‐Venus(VSV‐G) (F) or rVSV‐GFP(RABV‐G) (G) showed fluorescent protein expression. Images taken 1 dpi. Scale bars = 5 mm in A; 100 μm in B,C; 50 μm in D; 0.5 mm in E–G.

Similar articles

Cited by

References

    1. Albin RL, Young AB, Penney JB. 1995. The functional anatomy of disorders of the basal ganglia. Trends Neurosci 18: 63–64. - PubMed
    1. Alford SC, Wu J, Zhao Y, Campbell RE, Knopfel T. 2013. Optogenetic reporters. Biol Cell 105: 14–29. - PubMed
    1. Amirache F, Levy C, Costa C, Mangeot PE, Torbett BE, Wang CX, Negre D, Cosset FL, Verhoeyen E. 2014. Mystery solved: VSV‐G‐LVs do not allow efficient gene transfer into unstimulated T cells, B cells, and HSCs because they lack the LDL receptor. Blood 123: 1422–1424. - PubMed
    1. Astic L, Saucier D, Coulon P, Lafay F, Flamand A. 1993. The CVS strain of rabies virus as transneuronal tracer in the olfactory system of mice. Brain Res 619: 146–156. - PubMed
    1. Baskerville A, Lloyd G. 1977. Experimental infection of monkeys with Herpesvirus suis (Aujeszky's‐disease virus). J Med Microbiol 10: 139–144. - PubMed

Publication types

MeSH terms