. 2015 Feb 17;10(2):e0117943.
doi: 10.1371/journal.pone.0117943. eCollection 2015.

Microbial community dynamics during the bioremediation process of chlorimuron-ethyl-contaminated soil by Hansschlegelia sp. strain CHL1

Affiliations

Microbial community dynamics during the bioremediation process of chlorimuron-ethyl-contaminated soil by Hansschlegelia sp. strain CHL1

Liqiang Yang et al. PLoS One. .

Abstract

Long-term and excessive application of chlorimuron-ethyl has led to a series of environmental problems. Strain Hansschlegelia sp. CHL1, a highly efficient chlorimuron-ethyl degrading bacterium isolated in our previous study, was employed in the current soil bioremediation study. The residues of chlorimuron-ethyl in soils were detected, and the changes of soil microbial communities were investigated by phospholipid fatty acid (PLFA) analysis. The results showed that strain CHL1 exhibited significant chlorimuron-ethyl degradation ability at wide range of concentrations between 10μg kg-1 and 1000μg kg-1. High concentrations of chlorimuron-ethyl significantly decreased the total concentration of PLFAs and the Shannon-Wiener indices and increased the stress level of microbes in soils. The inoculation with strain CHL1, however, reduced the inhibition on soil microbes caused by chlorimuron-ethyl. The results demonstrated that strain CHL1 is effective in the remediation of chlorimuron-ethyl-contaminated soil, and has the potential to remediate chlorimuron-ethyl contaminated soils in situ.


Conflict of interest statement

Competing Interests: The authors have declared that no competing interests exist.

Figures

Fig 1
Fig 1. Values of total PLFAs biomass in treated soils inoculation with strain CHL1 (b) or not (a).
Symbols represent the mean of triplicate samples and error bars indicate the standard deviation. S10, S30, S50, S100, S1000 mean 10, 30, 50, 100, 1000μg kg-1 chlorimuron-ethyl treatment group, respectively. ‘-’ indicates without strain CHL1 inoculation; ‘+’ indicates inoculation with strain CHL1.
Fig 2
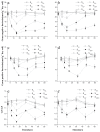
Fig 2. Values of Gram negative bacteria (GN), Gram positive bacteria (GP) and the rate of GN and GP in treated soils inoculation with strain CHL1 (b, d, f) or not (a, c, e).
Symbols represent the mean of triplicate samples and error bars indicate the standard deviation. S10, S30, S50, S100, S1000 mean 10, 30, 50, 100, 1000μg kg-1 chlorimuron-ethyl treatment group, respectively. ‘-’ indicates without strain CHL1 inoculation; ‘+’ indicates inoculation with strain CHL1.
Fig 3
Fig 3. Values of bacteria, fungi and the rate of bacteria and fungi in treated soils inoculation with strain CHL1 (b, d, f) or not (a, c, e).
Symbols represent the mean of triplicate samples and error bars indicate the standard deviation. S10, S30, S50, S100, S1000 mean 10, 30, 50, 100, 1000μg kg-1 chlorimuron-ethyl treatment group, respectively. ‘-’ indicates without strain CHL1 inoculation; ‘+’ indicates inoculation with strain CHL1.
Fig 4
Fig 4. Values of the stress level of microbes in treated soils inoculation with strain CHL1 (b) or not (a).
Symbols represent the mean of triplicate samples and error bars indicate the standard deviation. S10, S30, S50, S100, S1000 mean 10, 30, 50, 100, 1000μg kg-1 chlorimuron-ethyl treatment group, respectively. ‘-’ indicates without strain CHL1 inoculation; ‘+’ indicates inoculation with strain CHL1.
Fig 5
Fig 5. Values of the Shannon-Wiener index of microbes in treated soils inoculation with strain CHL1 (b) or not (a).
Symbols represent the mean of triplicate samples and error bars indicate the standard deviation. S10, S30, S50, S100, S1000 mean 10, 30, 50, 100, 1000μg kg-1 chlorimuron-ethyl treatment group, respectively. ‘-’ indicates without strain CHL1 inoculation; ‘+’ indicates inoculation with strain CHL1.
Fig 6
Fig 6. PCA plot of the microbial community structure of all treatments on days 7, 30 and 60.
S0, S10, S30, S50, S100 and S1000 mean 0, 10, 30, 50, 100 and 1000μg kg-1 chlorimuron-ethyl treatment group, respectively. ‘-’ indicates without strain CHL1 inoculation; ‘+’ indicates inoculation with strain CHL1.

References

    1. Tan H, Xu M, Li X, Zhang H, Zhang C (2013) Effects of chlorimuron-ethyl application with or without urea fertilization on soil ammonia-oxidizing bacteria and archaea. Journal of hazardous materials 260: 368–374. 10.1016/j.jhazmat.2013.05.043 - DOI - PubMed
    1. Zhang H, Zhang X, Mu W, Wang J, Pan H, et al. (2010) Biodegradation of chlorimuron-ethyl by the bacterium Klebsiella jilinsis 2N3. Journal of environmental science and health Part B, Pesticides, food contaminants, and agricultural wastes 45: 501–507. 10.1080/03601234.2010.493473 - DOI - PubMed
    1. Lamoureux GL, Rusness DG, Tanaka FS (1991) Chlorimuron ethyl metabolism in corn. Pesticide biochemistry and physiology 41: 66–81.
    1. Zawoznik MS, Tomaro ML (2005) Effect of chlorimuron‐ethyl on Bradyrhizobium japonicum and its symbiosis with soybean. Pest management science 61: 1003–1008. - PubMed
    1. Zhang X, Li X, Zhang C, Li X, Zhang H (2011) Ecological risk of long-term chlorimuron-ethyl application to soil microbial community: an in situ investigation in a continuously cropped soybean field in Northeast China. Environmental science and pollution research international 18: 407–415. 10.1007/s11356-010-0381-4 - DOI - PubMed

Publication types

MeSH terms

LinkOut - more resources