

Simulating the dynamic effect of land use and transport policies on the health of populations
- PMID: 25689177
- PMCID: PMC4355720
- DOI: 10.2105/AJPH.2014.302303
Simulating the dynamic effect of land use and transport policies on the health of populations
Abstract
Objectives: We identified the features of a land use-transportation system that optimizes the health and well-being of the population.
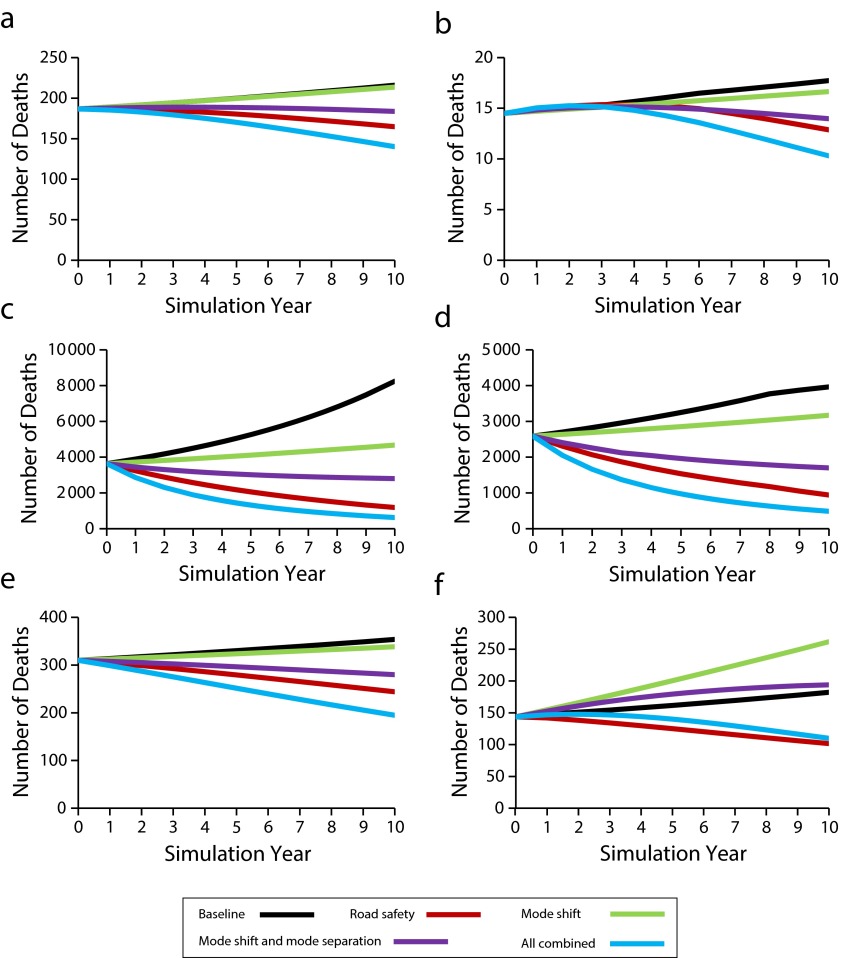
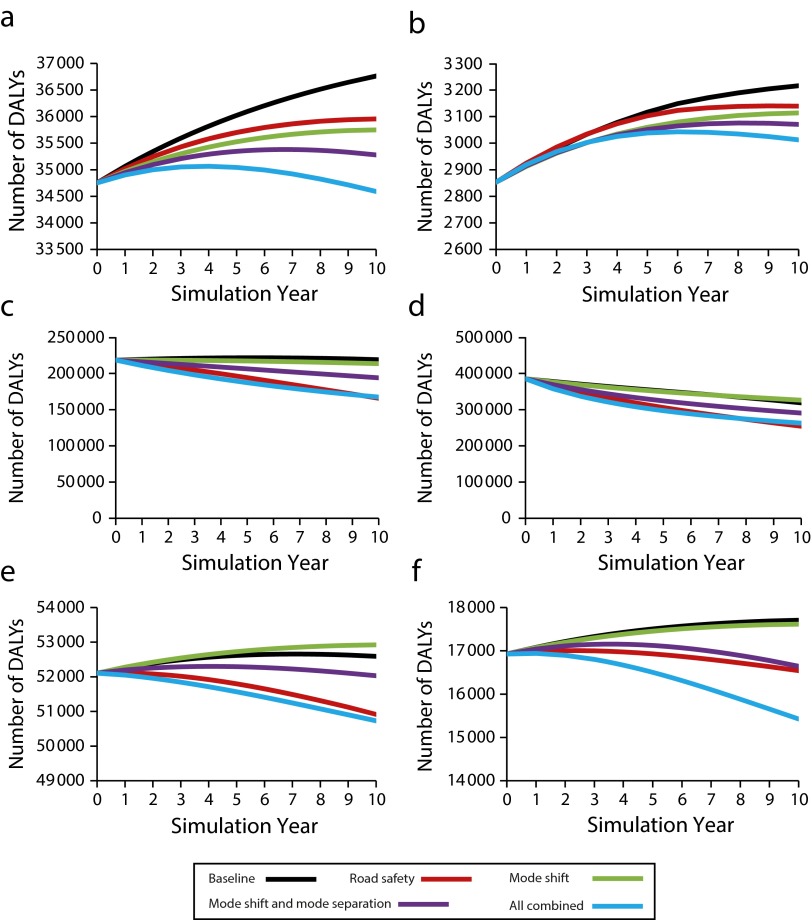
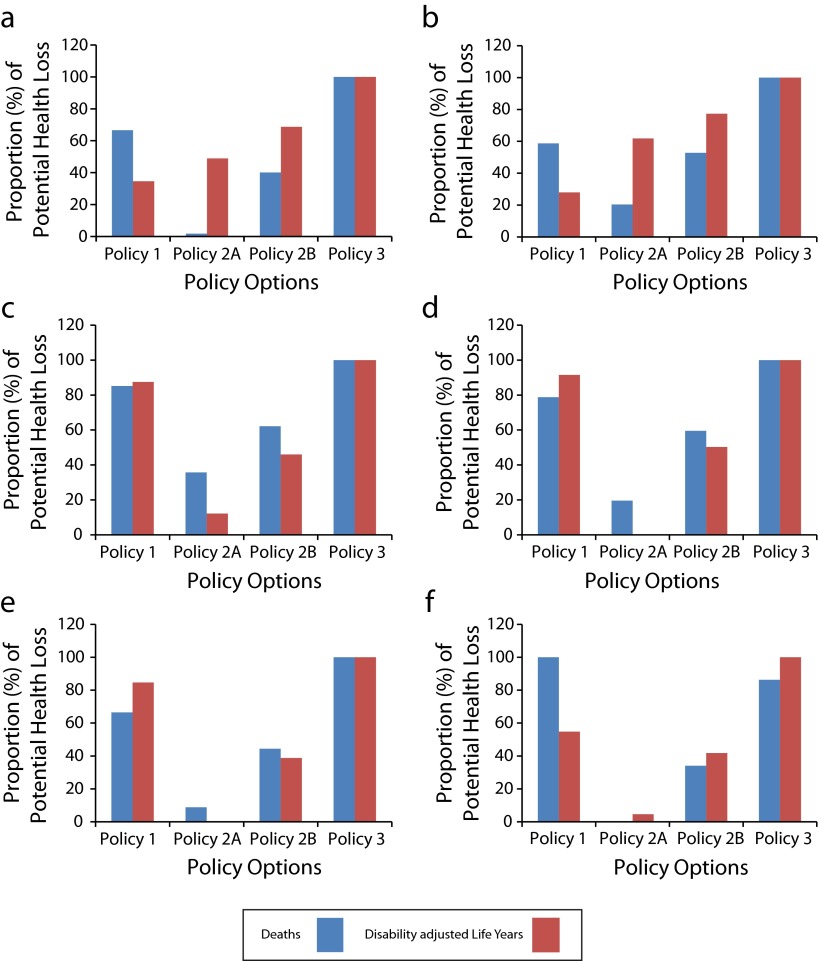
Methods: We developed a quantitative system dynamics model to represent relationships among land use, transport, economic development, and population health. Simulation experiments were conducted over a 10-year simulation period to compare the effect of different baseline conditions and land use-transport policies on the number of motor vehicle crash deaths and disability-adjusted life years lost.
Results: Optimal reduction in the public health burden attributable to land transport was demonstrated when transport safety risk reduction policies were combined with land use and transport polices that minimized reliance on individual motorized transport and maximized use of active transport modes. The model's results were particularly sensitive to the level of development that characterized each city at the start of the simulation period.
Conclusions: Local, national, and international decision-makers are encouraged to address transport, land use, and health as an integrated whole to achieve the desired societal benefits of traffic safety, population health, and social equity.
Figures
References
-
- World Health Organization. Second global status report on road safety. Available at: http://www.who.int/entity/violence.../global_status_report/flyer_en.pdf. Accessed March 31, 2014.
-
- van Beeck EF, Borsboom GJJ, Mackenbach JP. Economic development and traffic accident mortality in the industrialized world, 1962–1990. Int J Epidemiol. 2000;29(3):503–509. - PubMed
-
- Dargay J, Gately D, Sommer M. Vehicle ownership and income growth, worldwide: 1960-2030. Energy J. 2007;28(4):143–170.
-
- Fan S, Chan-Kang C. Washington, DC: International Food Policy Research Institute; Road Development, Economic Growth, and Poverty Reduction in China. Research report 138. Available at: http://books.google.com/books?id=f3c-l4qIYtoC&dq=world+bank+spending+on+.... Accessed March 31, 2014.
MeSH terms
LinkOut - more resources
Full Text Sources
Medical
