. 2015 Feb 17;10(2):e0112655.
doi: 10.1371/journal.pone.0112655. eCollection 2015.

Identification of modulators of the nuclear receptor peroxisome proliferator-activated receptor α (PPARα) in a mouse liver gene expression compendium

Affiliations

Identification of modulators of the nuclear receptor peroxisome proliferator-activated receptor α (PPARα) in a mouse liver gene expression compendium

Keiyu Oshida et al. PLoS One. .

Erratum in

Abstract

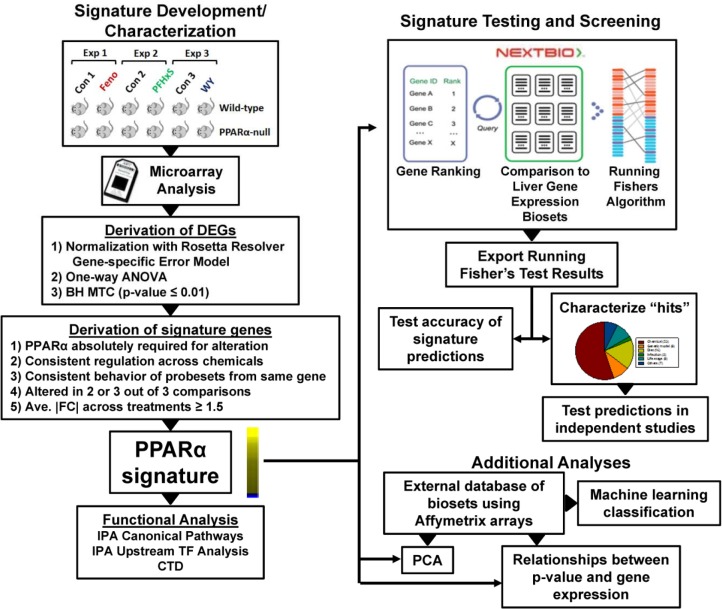
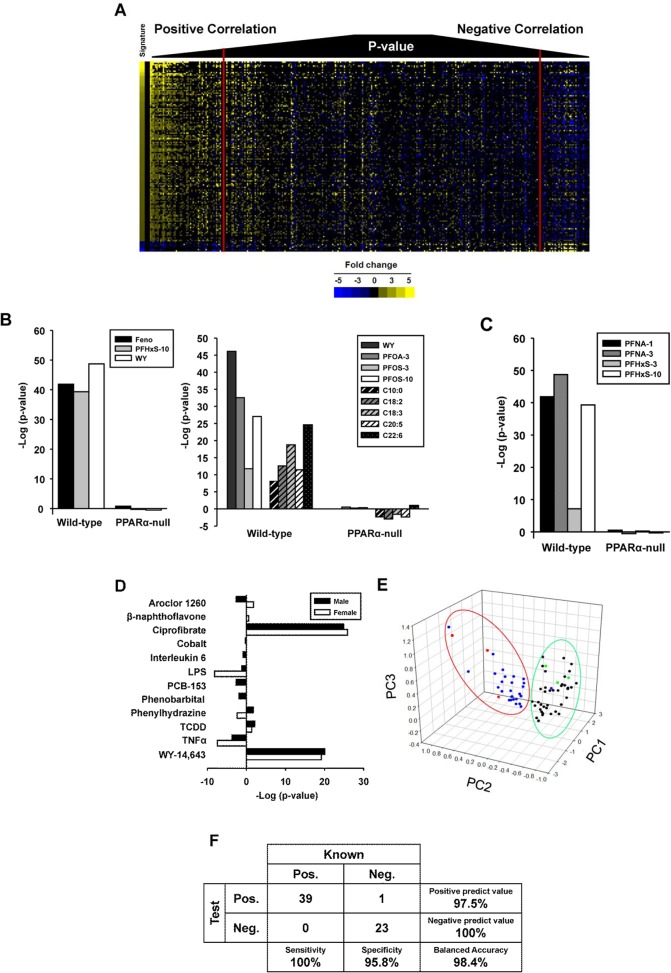
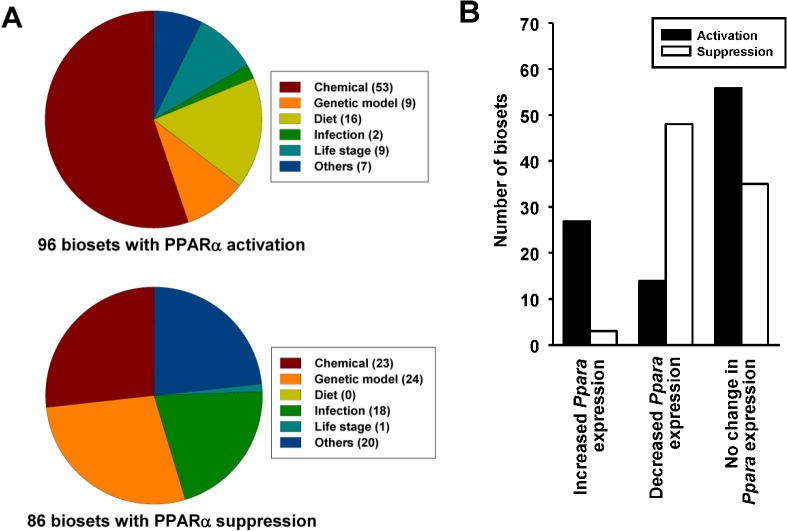
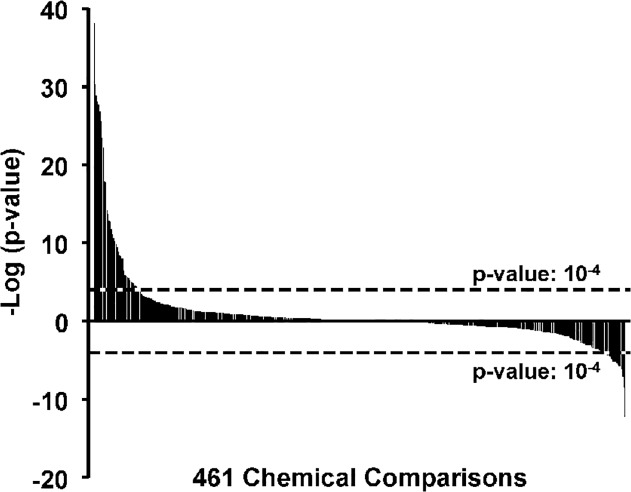
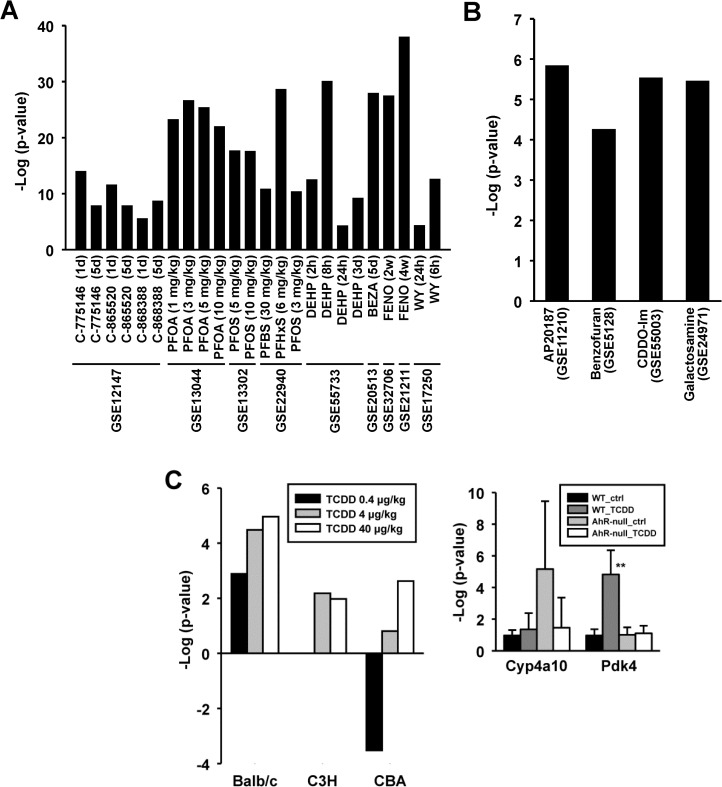
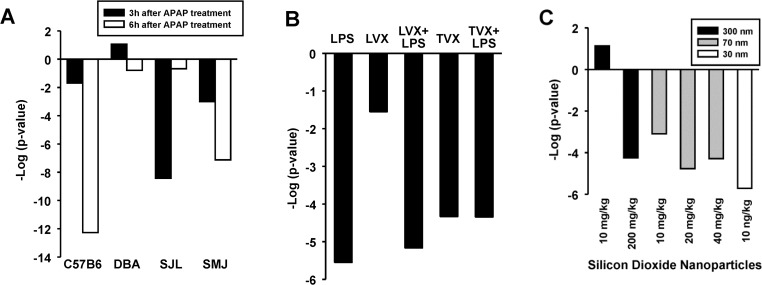
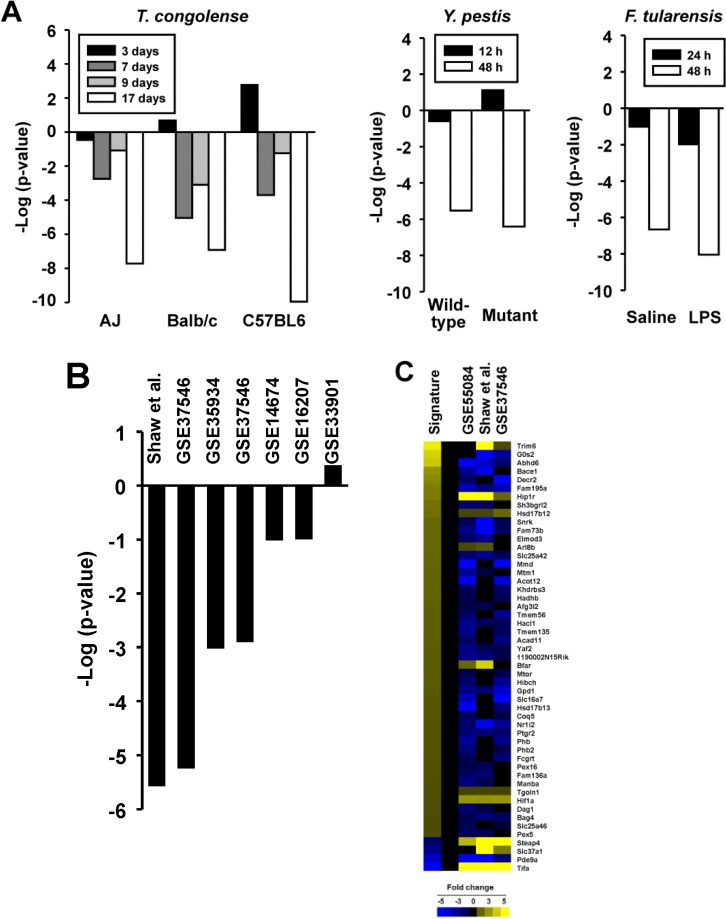
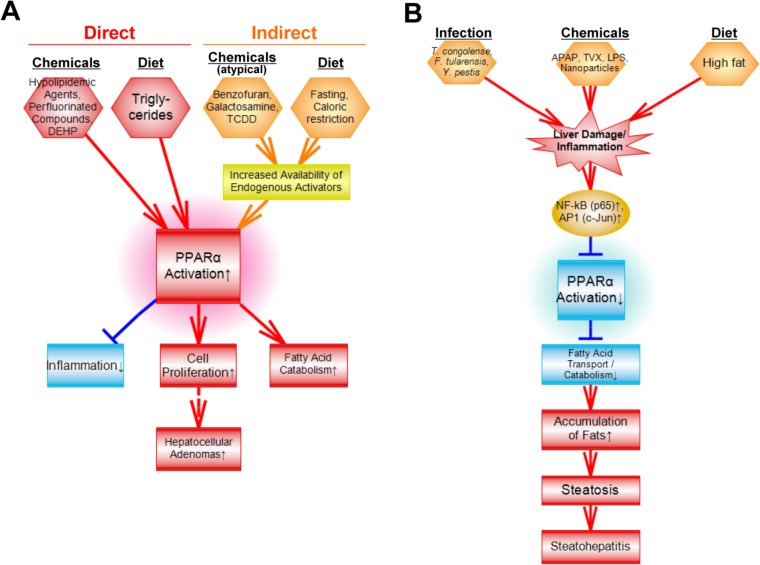
The nuclear receptor family member peroxisome proliferator-activated receptor α (PPARα) is activated by therapeutic hypolipidemic drugs and environmentally-relevant chemicals to regulate genes involved in lipid transport and catabolism. Chronic activation of PPARα in rodents increases liver cancer incidence, whereas suppression of PPARα activity leads to hepatocellular steatosis. Analytical approaches were developed to identify biosets (i.e., gene expression differences between two conditions) in a genomic database in which PPARα activity was altered. A gene expression signature of 131 PPARα-dependent genes was built using microarray profiles from the livers of wild-type and PPARα-null mice after exposure to three structurally diverse PPARα activators (WY-14,643, fenofibrate and perfluorohexane sulfonate). A fold-change rank-based test (Running Fisher's test (p-value ≤ 10(-4))) was used to evaluate the similarity between the PPARα signature and a test set of 48 and 31 biosets positive or negative, respectively for PPARα activation; the test resulted in a balanced accuracy of 98%. The signature was then used to identify factors that activate or suppress PPARα in an annotated mouse liver/primary hepatocyte gene expression compendium of ~1850 biosets. In addition to the expected activation of PPARα by fibrate drugs, di(2-ethylhexyl) phthalate, and perfluorinated compounds, PPARα was activated by benzofuran, galactosamine, and TCDD and suppressed by hepatotoxins acetaminophen, lipopolysaccharide, silicon dioxide nanoparticles, and trovafloxacin. Additional factors that activate (fasting, caloric restriction) or suppress (infections) PPARα were also identified. This study 1) developed methods useful for future screening of environmental chemicals, 2) identified chemicals that activate or suppress PPARα, and 3) identified factors including diets and infections that modulate PPARα activity and would be hypothesized to affect chemical-induced PPARα activity.


Conflict of interest statement

Competing Interests: The authors note that two coauthors are employed by commercial entities including Keiyu Oshida (Toray Industries) and Dawn Applegate (Regenemed). Russell Thomas was recently employed by Hamner Institute but is now at the US-EPA. For these and the other authors there are no other relevant declarations relating to employment, consultancy, patents, products in development or marketed products, etc. that should be declared. The authors would like to emphasize that this does not alter adherence to PLOS ONE policies on sharing data and materials.

Figures

Fig 1
Fig 1. PPARα signature development/characterization and screening of a mouse liver gene expression compendium.
Left, signature development and characterization. Wild-type and PPARα-null mice were treated with fenofibrate (Feno) [21], perfluorohexanesulfonate (PFHxS) (GSE55756), or WY-14,643 (WY) [22] in separate experiments carried out in three different labs. Differentially expressed genes (DEGs) were identified using Rosetta Resolver as indicated. Signature genes were identified from the DEGs after applying a number of filtering steps. Genes in the signature were evaluated by Ingenuity Pathway Analysis (IPA) for canonical pathway enrichment and potential transcription factor regulators and by the Comparative Toxicogenomics Database (CTD) to evaluate literature evidence for consistent regulation of signature genes by PPARα activators. Right, signature testing and screening. The PPARα signature was imported into the NextBio environment in which internal protocols rank ordered the genes based on their fold-change. Screening was carried out by comparison of the signature to each bioset using a pair-wise rank-based enrichment analysis (the Running Fishers algorithm). The results of the test including the direction of correlation and p-value for each bioset in the compendium were exported and used to populate a master table containing bioset experimental details. A test of the accuracy of the signature predictions was carried out with treatments that are known positives and negatives for PPARα activation. Screening “hits” were characterized, and a number of predictions were tested in independent studies. Additionally, an external gene expression database of experiments using Affymetrix gene chips was used in a machine learning classification analysis by BRB Array Tools, principal components analysis (PCA), and examination of the relationships between p-value and gene behavior. Part of the figure was adapted from a figure in [27].
Fig 2
Fig 2. Characterization of the PPARα signature.
A. Expression behavior of genes in the final signature. The heat map shows the expression of the 147 probe sets after exposure to fenofibrate (F), PFHxS (P), and WY-14,643 (W) in wild-type and PPARα-null mice compared to the signature (Sig). B. Expression behavior of the PPARα signature genes from the Comparative Toxicogenomics Database (CTD). Expression is shown as increased (yellow) or decreased (blue). If two or more references indicate expression in both directions, the gene is represented by green. The intensity of the signature was determined by fold-change, whereas the intensity of the genes in the 9 chemical comparisons reflects the number of publications that found the gene to be altered. C. Top canonical pathways significantly enriched by the genes in the PPARα signature. Genes were examined by Ingenuity Pathways Analysis. D. Transcription factors predicted to regulate the genes in the PPARα signature as determined by Ingenuity Pathways Analysis. The 10 most significant transcription factors are shown.
Fig 3
Fig 3. Prediction of PPARα activation using the Running Fisher’s algorithm.
A. Heat map showing the expression of genes in the PPARα signature across 332 biosets. Biosets were ordered based on their similarity to the PPARα signature using the p-value from the Running Fisher’s algorithm. Biosets with positive correlation are on the left and biosets with negative correlation are on the right. The red vertical lines denote the position of biosets with a p-value = 10-4. B. (Left) Correlation of the PPARα signature to contrasts from the three chemicals used to derive the signature in wild-type but not PPARα-null mice. All p-values were converted to –log10 values. Those comparisons which exhibited negative correlation to the signature were converted to a negative value. (Right) Correlation of the PPARα signature to chemical and synthetic triglyceride activators of PPARα from wild-type but not PPARα-null mice. The compounds were WY-14,643 (WY) (GSE8396), PFOA at 3 mg/kg/day (PFOA-3) (GSE9786), PFOS at 3 or 10 mg/kg/day (PFOS-3, -10) (GSE22871) or synthetic triglycerides composed of the indicated fatty acids (GSE8396). C. The PPARα signature correctly identifies PFNA and PFHxS as PPARα activators in wild-type but not PPARα-null mice. Exposure to the indicated chemicals is described in Study 1 (Methods). D. The PPARα signature correctly identifies the two known PPARα activators (WY and ciprofibrate) in male and female mice exposed to 12 diverse treatments. See Study 3 in Methods for details of exposure conditions. E. The signature genes separate known positives and negatives for PPARα activation using principal components analysis. The first three principal components are shown, derived from the unfiltered expression changes of the signature genes. Red and green, the three chemical treatments in wild-type or PPARα-null mice used to derive the signature, respectively. Blue and black, chemicals or synthetic triglycerides in wild-type or PPARα-null mice, respectively. F. Summary of the sensitivity and specificity of the test for PPARα activation. The signature was compared to chemicals in wild-type or PPARα-null mice that were known positives or negatives for PPARα activation.
Fig 4
Fig 4. Expression of Cyp4a10 and Pdk4 genes in the livers of mice exposed to reference compound activators of CAR, FXR, Nrf2, PPARα, and PXR.
Expression was examined in the livers from the indicated wild-type or nullizygous mice after exposure to a prototypical activator of that transcription factor. A. Expression behavior in wild-type and PPARα-null mice exposed to WY, PFNA or AGN194,204 (AGN). B. Expression behavior in wild-type and the indicated null mice after exposure to phenobarbital (PB), GW4064 (GW), oltipraz, or PCN. Significantly different from corresponding control: * p < 0.05, **p < 0.01. Significantly different between controls in wild-type and nullizygous mice: # p < 0.05, ## p < 0.01.
Fig 5
Fig 5. PPARα activation or suppression in a mouse liver compendium.
A. Summary of PPARα activation or suppression. The PPARα signature was compared to ~1850 biosets using the Running Fisher’s test. The number of biosets with a p-value ≤ 10-4 for either activation or suppression in the indicated categories is shown. B. Relationships between Ppara expression changes and predictions of PPARα activity. The biosets were divided into those in which Ppara mRNA expression was increased, decreased or exhibited no change (∣fold-change∣ ≥ 1.2). Predictions of the number of biosets for PPARα activation or suppression are shown for the three groups.
Fig 6
Fig 6. Chemical activation or suppression of PPARα.
Distribution of chemical effects on PPARα activation or suppression. The Running Fisher’s test –log(p-values) for the 461 chemical comparisons are shown. The cutoff values for significance are shown.
Fig 7
Fig 7. Activation of PPARα by diverse chemicals.
A. Known activators of PPARα. B. Activation of PPARα by novel chemicals. Novel activators of PPARα identified in the screen are shown. C. Activation of PPARα by TCDD. (Left) Activation of PPARα by TCDD in Balb/c but not C3H or CBA mice at 4 or 40 μg/kg TCDD (from [47]). (Right) Expression behavior of PPARα-regulated genes in wild-type and AhR-null mice after exposure to TCDD. Significantly different from corresponding control: * p < 0.05, **p < 0.01. Significantly different between controls in wild-type and nullizygous mice: # p < 0.05, ## p < 0.01.
Fig 8
Fig 8. Suppression of PPARα by chemical exposure.
A. Suppression of PPARα by acetaminophen. Effects of acetaminophen treatment were examined at either 3 or 6 hrs of exposure in four strains of mice [49]. B. Suppression of PPARα by LPS and trovafloxacin. Suppression of PPARα by LPS, LPS + lovafloxacin (LVX), trovafloxacin (TVX), and TVX + LPS but not by LVX only [51]. C. Suppression of PPARα by silicon dioxide nanoparticles. In general, suppression of PPARα was more significant with smaller particle size at equivalent dose levels [54].
Fig 9
Fig 9. Suppression of PPARα by infections.
A. Effect of infections on PPARα. (Left) Effect of T. congolense infection on PPARα. Different strains of mice were infected with T. congolense and examined for liver gene expression at 3, 7, 9, and 17d after infection [63]. (Middle) Effect of Y. pestis infection on PPARα. Mice were infected with 5 times the lethal dose 50 of wild-type or mutant form of Y. pestis and profiled either 12 or 48 hrs later [64]. (Right) Effect of F. tularensis infection on PPARα. Mice were infected with F. tularensis after LPS or saline pretreatment and profiled 24 or 48hrs later [57]. B. Suppression of PPARα by LPS. Seven biosets which examined effects of LPS on the liver transcriptome are shown. One bioset was not from GEO (Shaw et al., 2009; [51]). C. Heatmap showing the expression of genes after LPS exposure. Those biosets which exhibited significant suppression of PPARα are shown. The expression of genes that exhibited consistent expression (2 or 3 out of 3) are shown.
Fig 10
Fig 10. Summary of factors which affect PPARα.
A. Summary of factors that activate PPARα. Although many chemicals and fatty acids (derived from hydrolysis of triglycerides) bind to and activate PPARα directly, some chemicals and diets likely activate PPARα indirectly by increasing the availability of endogenous PPARα activators. Downstream effects of PPARα activation include short-term responses of hepatocyte proliferation, activation of fatty acid transport and catabolism, and suppression of inflammatory responses. Under chronic exposure conditions, hepatocellular adenomas and carcinomas can develop. B. Summary of factors that suppress PPARα. A number of factors may suppress PPARα by increasing the activation of NF-kB and AP1 which physically interfere with the ability of PPARα to bind to DNA and regulate gene expression. Suppression of PPARα can lead to decreases in fatty acid catabolism and steatosis. Chronic suppression can lead to steatohepatitus.

Similar articles

Cited by

References

    1. Ankley GT, Bennett RS, Erickson RJ, Hoff DJ, Hornung MW, et al. (2010) Adverse outcome pathways: a conceptual framework to support ecotoxicology research and risk assessment. Environ Toxicol Chem 29: 730–741. 10.1002/etc.34 - DOI - PubMed
    1. Pery AR, Schuurmann G, Ciffroy P, Faust M, Backhaus T, et al. (2013) Perspectives for integrating human and environmental risk assessment and synergies with socio-economic analysis. Sci Total Environ 456–457: 307–316. 10.1016/j.scitotenv.2013.10.001 - DOI - PubMed
    1. Pyper SR, Viswakarma N, Yu S, Reddy JK (2010) PPARalpha: energy combustion, hypolipidemia, inflammation and cancer. Nucl Recept Signal 8: e002 10.1621/nrs.08002 - DOI - PMC - PubMed
    1. Corton JC, Cunningham ML, Hummer BT, Lau C, Meek B, et al. (2014) Mode of action framework analysis for receptor-mediated toxicity: The peroxisome proliferator-activated receptor alpha (PPARα) as a case study. Crit Rev Toxicol. Jan;44(1):1–49. 10.3109/10408444.2013.835784 - DOI - PubMed
    1. Peters JM, Cattley RC, Gonzalez FJ (1997) Role of PPAR alpha in the mechanism of action of the nongenotoxic carcinogen and peroxisome proliferator Wy-14,643. Carcinogenesis 18: 2029–2033. - PubMed

Publication types

Associated data

LinkOut - more resources