

Contrasting population genetic structure among freshwater-resident and anadromous lampreys: the role of demographic history, differential dispersal and anthropogenic barriers to movement
- PMID: 25689694
- PMCID: PMC4413359
- DOI: 10.1111/mec.13112
Contrasting population genetic structure among freshwater-resident and anadromous lampreys: the role of demographic history, differential dispersal and anthropogenic barriers to movement
Abstract
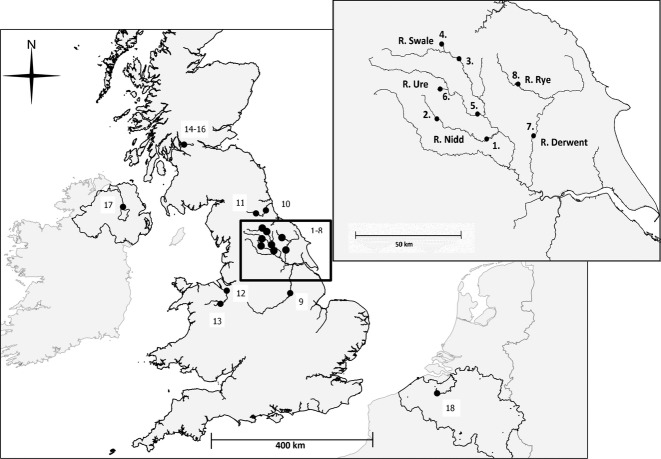
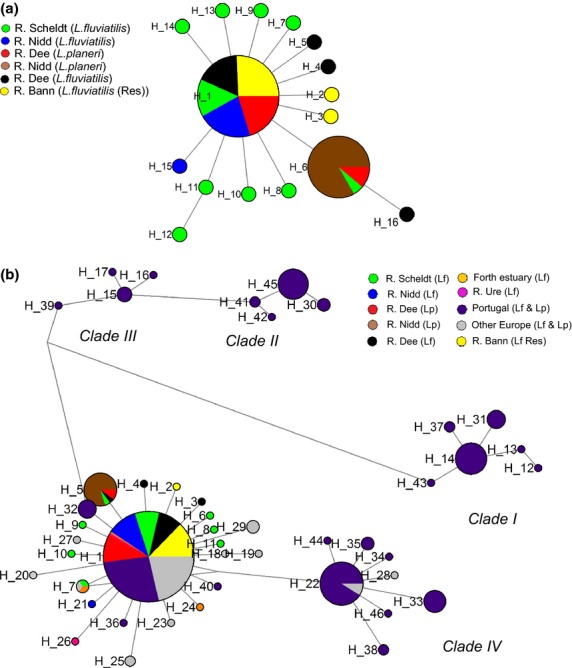
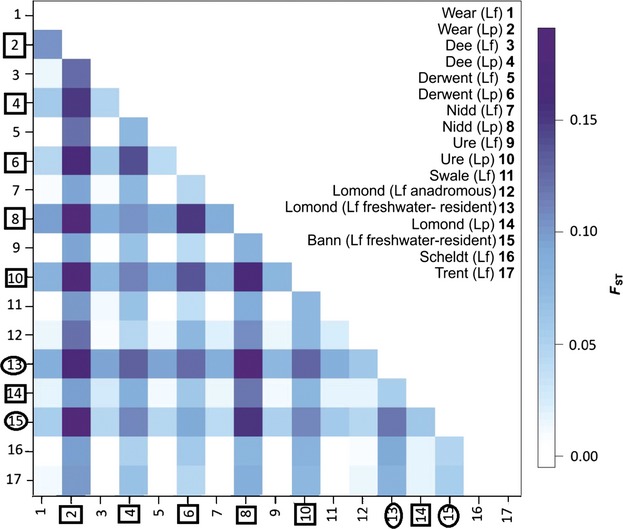
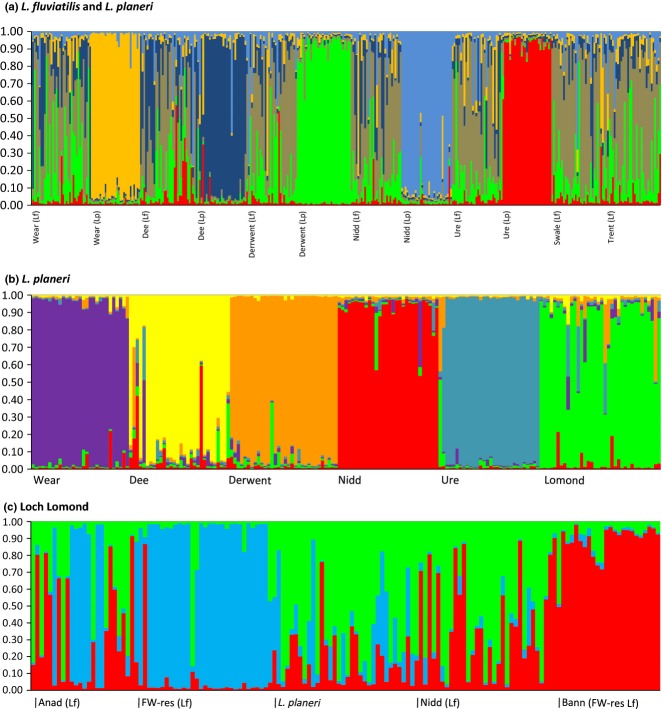
The tendency of many species to abandon migration remains a poorly understood aspect of evolutionary biology that may play an important role in promoting species radiation by both allopatric and sympatric mechanisms. Anadromy inherently offers an opportunity for the colonization of freshwater environments, and the shift from an anadromous to a wholly freshwater life history has occurred in many families of fishes. Freshwater-resident forms have arisen repeatedly among lampreys (within the Petromyzontidae and Mordaciidae), and there has been much debate as to whether anadromous lampreys, and their derived freshwater-resident analogues, constitute distinct species or are divergent ecotypes of polymorphic species. Samples of 543 European river lamprey Lampetra fluviatilis (mostly from anadromous populations) and freshwater European brook lamprey Lampetra planeri from across 18 sites, primarily in the British Isles, were investigated for 13 polymorphic microsatellite DNA loci, and 108 samples from six of these sites were sequenced for 829 bp of mitochondrial DNA (mtDNA). We found contrasting patterns of population structure for mtDNA and microsatellite DNA markers, such that low diversity and little structure were seen for all populations for mtDNA (consistent with a recent founder expansion event), while fine-scale structuring was evident for nuclear markers. Strong differentiation for microsatellite DNA loci was seen among freshwater-resident L. planeri populations and between L. fluviatilis and L. planeri in most cases, but little structure was evident among anadromous L. fluviatilis populations. We conclude that postglacial colonization founded multiple freshwater-resident populations with strong habitat fidelity and limited dispersal tendencies that became highly differentiated, a pattern that was likely intensified by anthropogenic barriers.
Keywords: Lampetra; anadromy; barriers to migration; life history; microsatellite; speciation.
© 2015 The Authors. Molecular Ecology Published by John Wiley & Sons Ltd.
Figures
Similar articles
-
Riverscape genetics in brook lamprey: genetic diversity is less influenced by river fragmentation than by gene flow with the anadromous ecotype.Heredity (Edinb). 2021 Feb;126(2):235-250. doi: 10.1038/s41437-020-00367-9. Epub 2020 Sep 28. Heredity (Edinb). 2021. PMID: 32989279 Free PMC article.
-
European Lampreys: New Insights on Postglacial Colonization, Gene Flow and Speciation.PLoS One. 2016 Feb 12;11(2):e0148107. doi: 10.1371/journal.pone.0148107. eCollection 2016. PLoS One. 2016. PMID: 26871930 Free PMC article.
-
Evolutionary history of lamprey paired species Lampetra fluviatilis (L.) and Lampetra planeri (Bloch) as inferred from mitochondrial DNA variation.Mol Ecol. 2007 May;16(9):1909-24. doi: 10.1111/j.1365-294X.2007.03279.x. Mol Ecol. 2007. PMID: 17444901
-
[Life Forms of Lampreys (Petromyzontidae) as a Manifestation of Intraspecific Diversity of Ontogenesis].Ontogenez. 2015 Jul-Aug;46(4):240-51. Ontogenez. 2015. PMID: 26480483 Review. Russian.
-
Using genetics to understand the dynamics of wild primate populations.Primates. 2009 Apr;50(2):105-20. doi: 10.1007/s10329-008-0124-z. Epub 2009 Jan 28. Primates. 2009. PMID: 19172380 Free PMC article. Review.
Cited by
-
Reconstructing the demographic history of divergence between European river and brook lampreys using approximate Bayesian computations.PeerJ. 2016 Apr 7;4:e1910. doi: 10.7717/peerj.1910. eCollection 2016. PeerJ. 2016. PMID: 27077007 Free PMC article.
-
Evolutionary patterns of diadromy in fishes: more than a transitional state between marine and freshwater.BMC Evol Biol. 2019 Aug 14;19(1):168. doi: 10.1186/s12862-019-1492-2. BMC Evol Biol. 2019. PMID: 31412761 Free PMC article.
-
Riverscape genetics in brook lamprey: genetic diversity is less influenced by river fragmentation than by gene flow with the anadromous ecotype.Heredity (Edinb). 2021 Feb;126(2):235-250. doi: 10.1038/s41437-020-00367-9. Epub 2020 Sep 28. Heredity (Edinb). 2021. PMID: 32989279 Free PMC article.
-
Genetic and environmental drivers of migratory behavior in western burrowing owls and implications for conservation and management.Evol Appl. 2023 Nov 15;16(12):1889-1900. doi: 10.1111/eva.13600. eCollection 2023 Dec. Evol Appl. 2023. PMID: 38143900 Free PMC article.
-
European Lampreys: New Insights on Postglacial Colonization, Gene Flow and Speciation.PLoS One. 2016 Feb 12;11(2):e0148107. doi: 10.1371/journal.pone.0148107. eCollection 2016. PLoS One. 2016. PMID: 26871930 Free PMC article.
References
-
- Almada VC, Pereira JI, Fonseca JP, Levy A, Maia C, Valenta A. Mitochondrial DNA fails to reveal genetic structure in sea lampreys along European shores. Molecular Phylogenetics and Evolution. 2008;46:391–396. - PubMed
-
- Amos B, Hoelzel AR. Long-term preservation of whale skin for DNA analysis. Report of the International Whaling Commission Special Issue. 1991;13:99–103.
-
- Bandelt HJ, Forster P, Rohl A. Median-joining networks for inferring intraspecific phylogenies. Molecular Biology and Evolution. 1999;16:37–48. - PubMed
Publication types
MeSH terms
Substances
Associated data
- Dryad/10.5061/dryad.V105S
- Actions
- Actions
- Actions
- Actions
- Actions
- Actions
- Actions
- Actions
- Actions
- Actions
- Actions
- Actions
- Actions
- Actions
- Actions
- Actions
LinkOut - more resources
Full Text Sources
Other Literature Sources
