. 2015 Feb 17;8(364):ra17.
doi: 10.1126/scisignal.2005824.

A molecular signature in the pannexin1 intracellular loop confers channel activation by the α1 adrenoreceptor in smooth muscle cells

Affiliations

A molecular signature in the pannexin1 intracellular loop confers channel activation by the α1 adrenoreceptor in smooth muscle cells

Marie Billaud et al. Sci Signal. .

Abstract

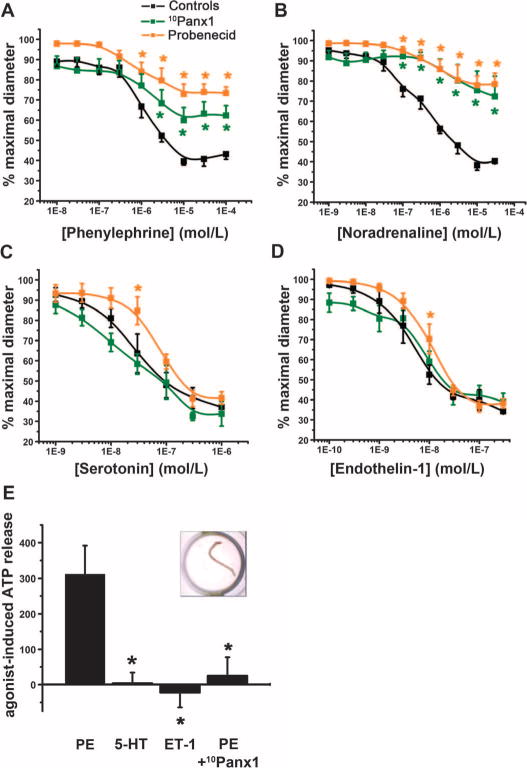
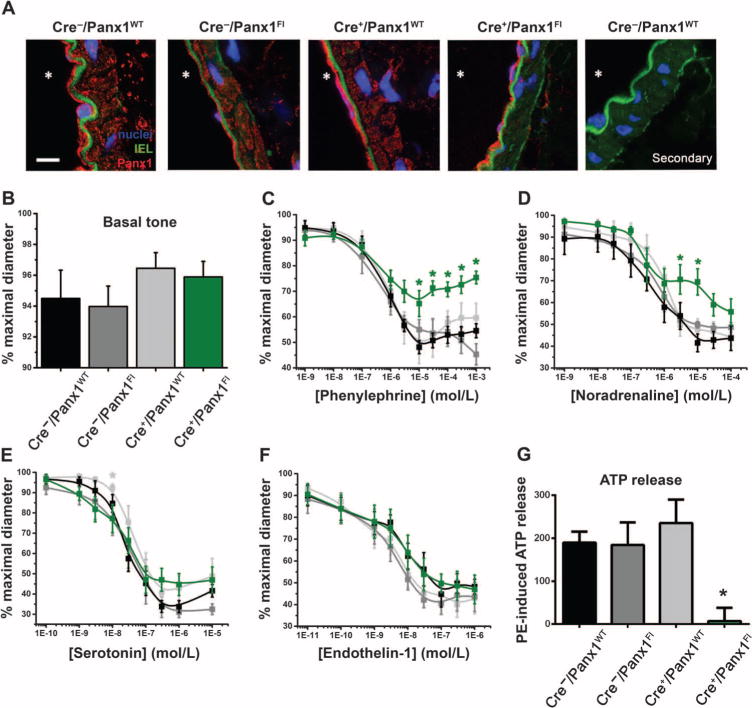
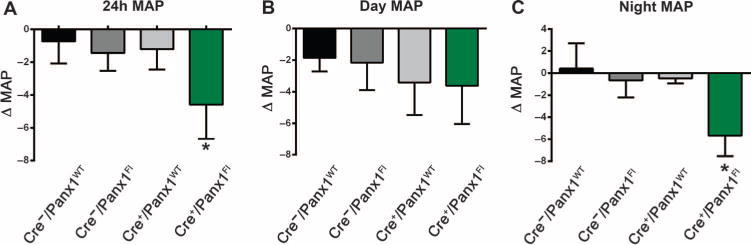
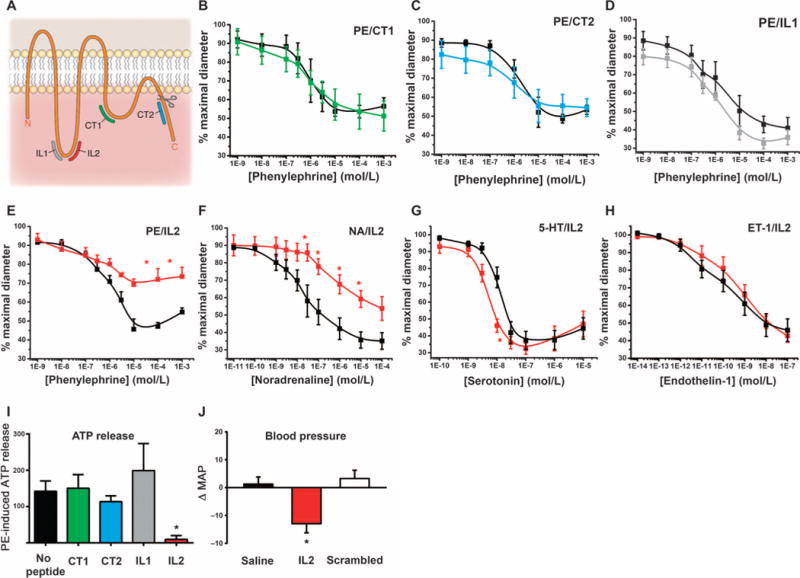
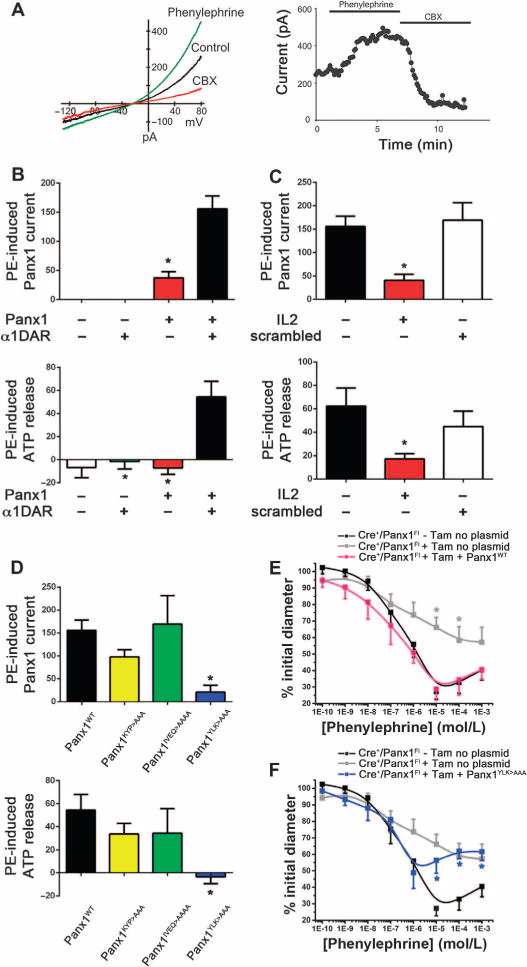
Both purinergic signaling through nucleotides such as ATP (adenosine 5'-triphosphate) and noradrenergic signaling through molecules such as norepinephrine regulate vascular tone and blood pressure. Pannexin1 (Panx1), which forms large-pore, ATP-releasing channels, is present in vascular smooth muscle cells in peripheral blood vessels and participates in noradrenergic responses. Using pharmacological approaches and mice conditionally lacking Panx1 in smooth muscle cells, we found that Panx1 contributed to vasoconstriction mediated by the α1 adrenoreceptor (α1AR), whereas vasoconstriction in response to serotonin or endothelin-1 was independent of Panx1. Analysis of the Panx1-deficient mice showed that Panx1 contributed to blood pressure regulation especially during the night cycle when sympathetic nervous activity is highest. Using mimetic peptides and site-directed mutagenesis, we identified a specific amino acid sequence in the Panx1 intracellular loop that is essential for activation by α1AR signaling. Collectively, these data describe a specific link between noradrenergic and purinergic signaling in blood pressure homeostasis.


Conflict of interest statement

Competing interests: The authors declare that they have no competing interests.

Figures

Fig. 1
Fig. 1. Pharmacological inhibition of Panx1 reduces vasoconstriction and ATP release selectively upon activation of α1AR
(A to D) Effect of 10Panx1 (300 μM) and probenecid (2 mM) on contractile response of pressurized TDAs stimulated with the indicated concentrations of agonists. n = 5to7. *P < 0.05 compared to untreated response (black curves) using two-way analysis of variance (ANOVA). (E) Relative ATP released from intact TDAs in response to phenylephrine (PE) in the presence or absence of 10Panx1 (300 μM), serotonin (5-HT), or endothelin-1 (ET-1). Data are presented as a percent increase in ATP concentration from unstimulated conditions. The insert shows an image of a TDA in a well of a 96-well dish. n = 5 to 11. *P < 0.05 compared to phenylephrine using a Kruskal-Wallis test.
Fig. 2
Fig. 2. Inducible SMC deletion of Panx1 selectively inhibits vasoconstriction and ATP release upon α1AR stimulation
(A) Representative immunofluorescence micrographs showing Panx1 labeling (red) on cross sections of TDAs isolated from mice of the indicated genotypes. All mice had been injected with tamoxifen for 10 days. The far right panel shows a negative control (secondary antibody only) on a cross section of a TDA isolated from Cre/Panx1WT mice. The autofluorescence of the internal elastic lamina (IEL) appears in green, and the nuclei were labeled with DAPI (4′,6-diamidino-2-phenylindole) (blue). * indicates the lumen. Scale bar, 10 μm. (B) Basal tone exhibited by TDAs from each genotype (exposed to tamoxifen for 10 days). (C to F) Contraction of pressurized TDAs isolated from Cre/Panx1WT mice (black curves), Cre/Panx1Fl mice (dark gray curves), Cre+/Panx1WT mice (light gray curves), and Cre+/Panx1Fl (green curves) all injected with tamoxifen for 10 days and stimulated with cumulative concentrations of phenylephrine (n = 6 to 16), noradrenaline (n = 4 to 8), serotonin (n = 5 to 10), or endothelin-1 (n = 4 to 8). *P < 0.05 compared to Cre/Panx1WT using a two-way ANOVA. (G) Histogram showing the phenylephrine (PE)–induced ATP release from intact TDAs isolated from mice of the indicated genotypes, all injected with tamoxifen for 10 days. Data are presented as a percent increase in ATP concentration from unstimulated conditions. *P < 0.05 compared to Cre/Panx1WT using a Kruskal-Wallis test. n = 4 to 8.
Fig. 3
Fig. 3. Inducible SMC deletion of Panx1 reduces blood pressure in freely moving mice
(A) Difference in the 24-hour mean arterial pressure (MAP) of mice of the indicated genotypes before and after tamoxifen injections. (B) Difference in the MAP during the day cycle (12-hour light: 6:00 a.m. to 6:00 p.m.) of mice of the indicated genotypes before and after tamoxifen injections. (C) Difference in the MAP during the night cycle (12-hour no light: 6:00 p.m. to 6:00 a.m.) of mice of the indicated genotypes before and after tamoxifen injections. *P < 0.05 comparing the MAP before and after tamoxifen injection using a nonparametric paired t test (Wilcoxon). n = 4 to 7.
Fig. 4
Fig. 4. A peptide analog to a Panx1 intracellular loop sequence inhibits vasoconstriction and ATP release upon α1AR stimulation and reduces blood pressure
(A) Diagram showing the position of each of the four peptides on mPanx1. The scissors indicate a caspase cleavage site. (B to H) Effects of the indicated peptide inhibitor on phenylephrine-induced constriction of pressurized TDAs (B to E), and effect of IL2 peptide on constriction of pressurized TDAs induced by the indicated concentrations of agonists (E to H). The black curves represent constriction in the absence of peptide. n = 4 to 7. *P< 0.05 compared to constriction in the absence of peptide using a two-way ANOVA. (I) Effect of the indicated peptide on phenylephrine (PE)–induced ATP release. Data are presented as a percent increase in ATP concentration from unstimulated conditions. n = 3 to 8. *P< 0.05 compared to no peptide using a Kruskal-Wallis test. (J) Difference between the MAPs (ΔMAP) measured before and after injection of saline, IL2 peptide, or its scrambled IL2 peptide in C57BL/6 mice. *P< 0.05 comparing before and after vehicle and peptide injections using a nonparametric paired t test (Wilcoxon). n = 7 to 9.
Fig. 5
Fig. 5. Characterization of α1DAR-mediated ATP release by Panx1 using a heterologous system
(A) Left panel: Representative current-voltage (I–V) curve obtained from whole-cell patch clamp recording of HEK293 cells cotransfected with Panx1 and α1DAR before (control, black curve) and after stimulation with phenylephrine (green curve), and upon application of CBX (red curve). Right panel: Representative time course of whole-cell current recorded from cotransfected HEK293 cell showing the effect of phenylephrine and CBX. (B) Phenylephrine-induced Panx1 current (top panel) and phenylephrine-induced ATP release (bottom panel) in untransfected HEK293 cells or HEK293 cells transfected with the indicated constructs. (C) Effect of the IL2 peptide and scrambled IL2 peptide on phenylephrine-induced Panx1 current (top panel) and phenylephrine-induced ATP release (bottom panel). (D) Phenylephrine-induced Panx1 current (top panel) and phenylephrine-induced ATP release (bottom panel) in HEK293 cells cotransfected with α1DAR and the indicated Panx1 construct. Panx1 current data [(B) to (D), top panels] are presented as a percent increase of CBX-sensitive current at +80 mV, or as a percent increase of ATP concentration from unstimulated conditions [(B) to (D), bottom panels]. (B to D) *P < 0.05 compared to cotransfected conditions (B), no peptide (C), or wild-type Panx1 (Panx1WT) (D) using a Kruskal-Wallis test. (E) Phenylephrine-induced contraction of pressurized TDAs isolated from Cre+/Panx1Fl mice not injected with tamoxifen and electroporated without plasmid (black curve), Cre+/Panx1Fl mice after injection with tamoxifen for 10 days and then electroporated without plasmid (gray curve), or Cre+/Panx1Fl mice after injection with tamoxifen for 10 days and then electroporated with Panx1WT (pink curve). (F) Phenylephrine-induced contraction of pressurized TDAs from control mice as indicated in (E) (black and gray curves) and Cre+/Panx1Fl mice after injection with tamoxifen for 10 days and then electroporated with Panx1YLK>AAA (blue curve). (E and F) *P < 0.05 compared to control Cre+/Panx1Fl (black curve) using a two-way ANOVA. n = 6 mice.

Comment in

References

    1. Burnstock G, Ralevic V. Purinergic signaling and blood vessels in health and disease. Pharmacol Rev. 2014;66:102–192. - PubMed
    1. Burnstock G. Dual control of vascular tone and remodelling by ATP released from nerves and endothelial cells. Pharmacol Rep. 2008;60:12–20. - PubMed
    1. Lohman AW, Billaud M, Isakson BE. Mechanisms of ATP release and signalling in the blood vessel wall. Cardiovasc Res. 2012;95:269–280. - PMC - PubMed
    1. Billaud M, Lohman AW, Straub AC, Looft-Wilson R, Johnstone SR, Araj CA, Best AK, Chekeni FB, Ravichandran KS, Penuela S, Laird DW, Isakson BE. Pannexin1 regulates α1-adrenergic receptor-mediated vasoconstriction. Circ Res. 2011;109:80–85. - PMC - PubMed
    1. Panchin Y, Kelmanson I, Matz M, Lukyanov K, Usman N, Lukyanov S. A ubiquitous family of putative gap junction molecules. Curr Biol. 2000;10:R473–R474. - PubMed

Publication types

MeSH terms