

Trends in worker hearing loss by industry sector, 1981-2010
- PMID: 25690583
- PMCID: PMC4557728
- DOI: 10.1002/ajim.22429
Trends in worker hearing loss by industry sector, 1981-2010
Abstract
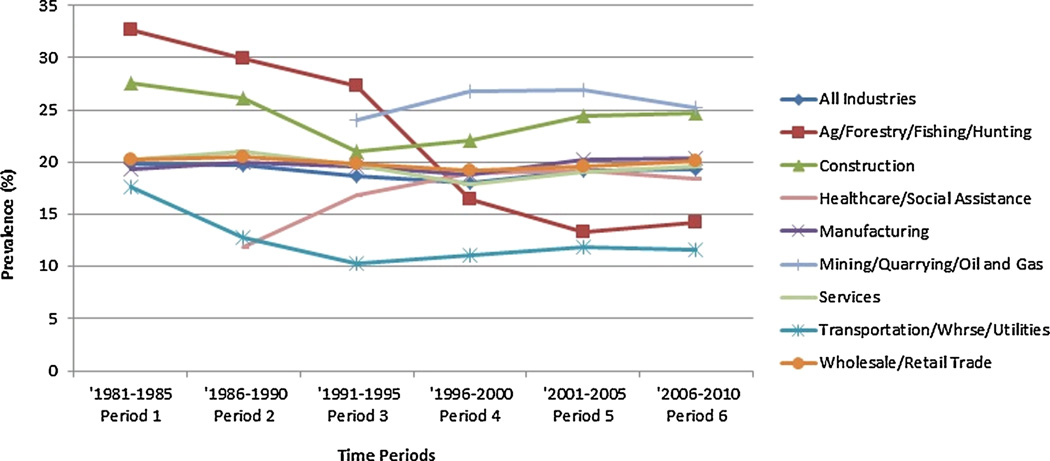
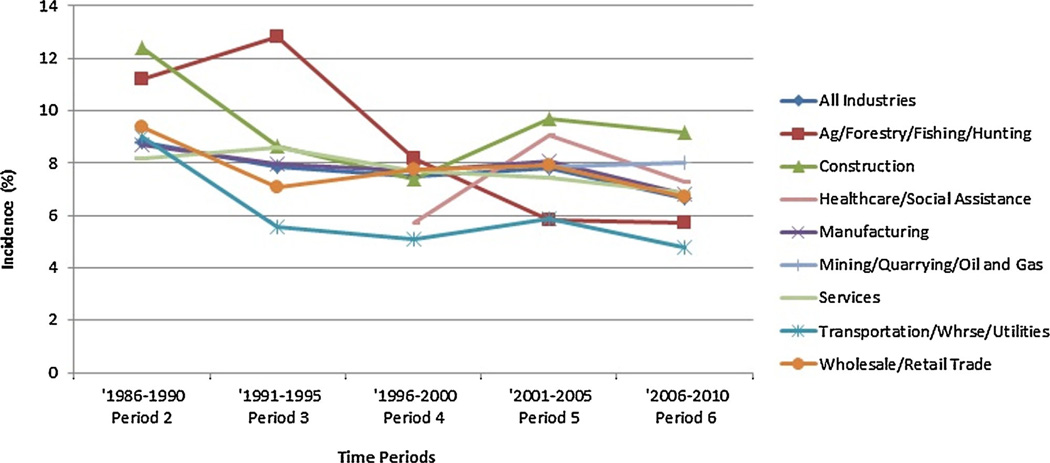
Background: The purpose of this study was to estimate the incidence and prevalence of hearing loss for noise-exposed U.S. workers by industry sector and 5-year time period, covering 30 years.
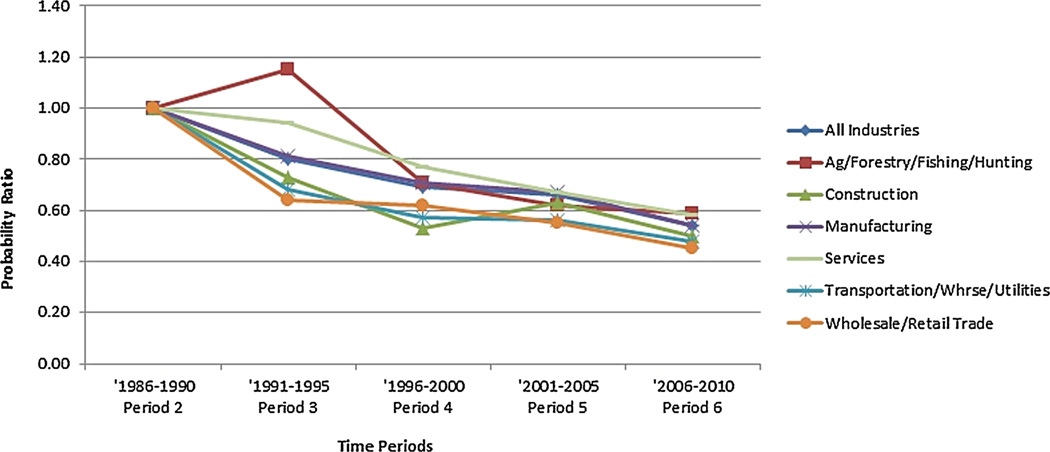
Methods: Audiograms for 1.8 million workers from 1981-2010 were examined. Incidence and prevalence were estimated by industry sector and time period. The adjusted risk of incident hearing loss within each time period and industry sector as compared with a reference time period was also estimated.
Results: The adjusted risk for incident hearing loss decreased over time when all industry sectors were combined. However, the risk remained high for workers in Healthcare and Social Assistance, and the prevalence was consistently high for Mining and Construction workers.
Conclusions: While progress has been made in reducing the risk of incident hearing loss within most industry sectors, additional efforts are needed within Mining, Construction and Healthcare and Social Assistance.
Keywords: hazardous noise; incidence; material hearing impairment; noise-induced hearing loss; occupational hearing loss; prevalence; surveillance; trends.
© 2015 Wiley Periodicals, Inc.
Conflict of interest statement
Conflict of interest statement: The authors have no conflicts of interest to declare.
Figures
References
-
- Agrawal Y, Platz EA, Niparko JK. Risk factors for hearing loss in US adults: Data from the National Health and Nutrition Examination Survey, 1999 to 2002. Otol Neurotol. 2009;30(2):139–145. - PubMed
-
- Arslan E, Orzan E. Audiological management of noise induced hearing loss. Scand Audiol Suppl. 1998;48:131–145. - PubMed
-
- Daniell WE, Fulton-Kehoe D, Cohen M, Swan SS, Franklin GM. Increased reporting of occupational hearing loss: Workers’ compensation in Washington State, 1984–1998. Am J Ind Med. 2002;42(6):502–510. - PubMed
-
- Deddens JA, Petersen MR. Approaches for estimating prevalence ratios. Occup Environ Med. 2008;65(481):501–486. - PubMed
MeSH terms
Grants and funding
LinkOut - more resources
Full Text Sources
Other Literature Sources
Medical
