

DXD motif-dependent and -independent effects of the chlamydia trachomatis cytotoxin CT166
- PMID: 25690695
- PMCID: PMC4344646
- DOI: 10.3390/toxins7020621
DXD motif-dependent and -independent effects of the chlamydia trachomatis cytotoxin CT166
Abstract
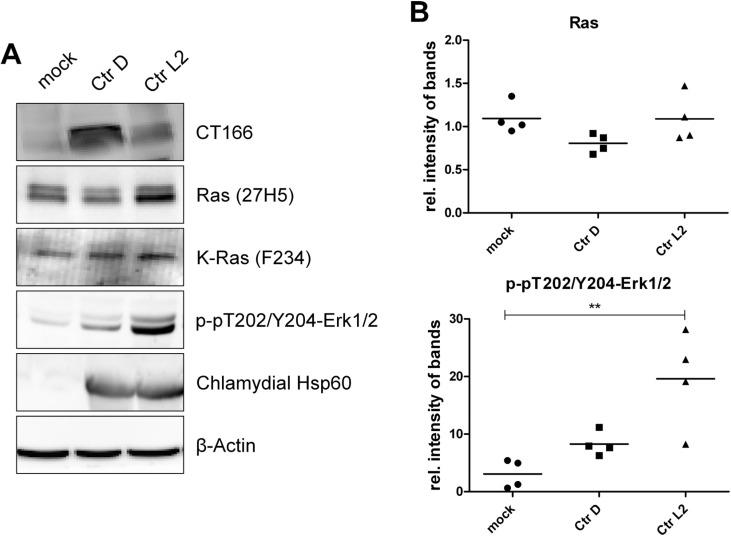
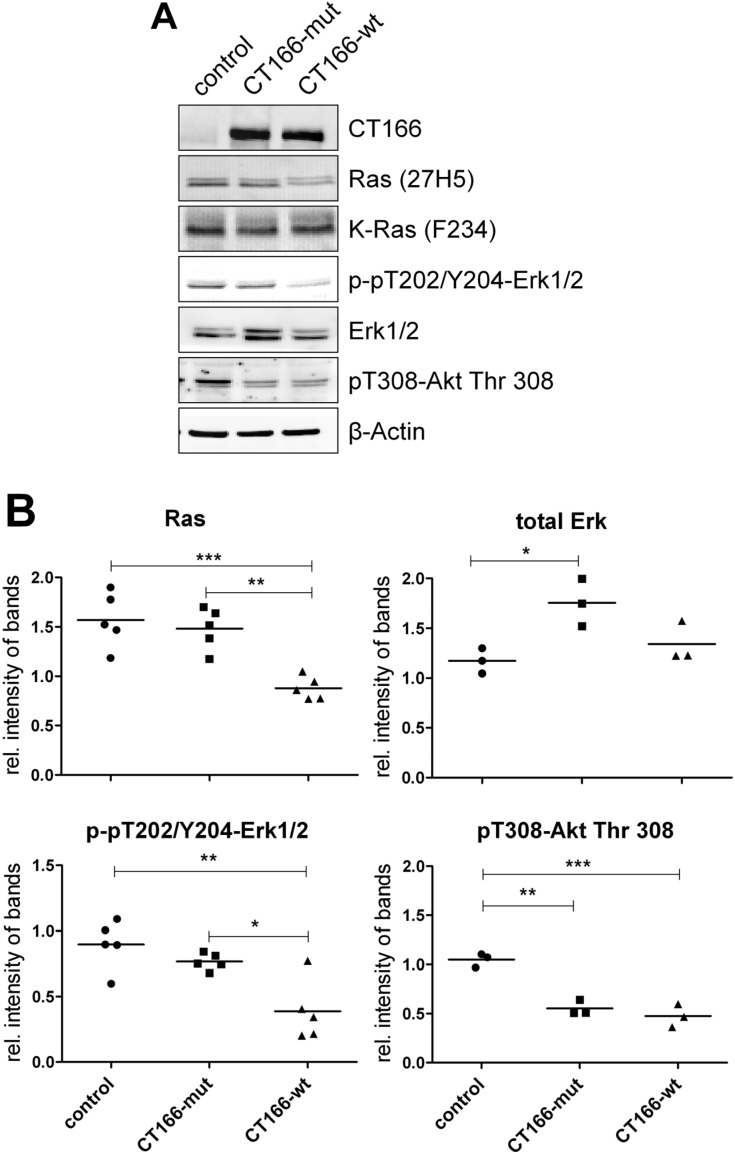
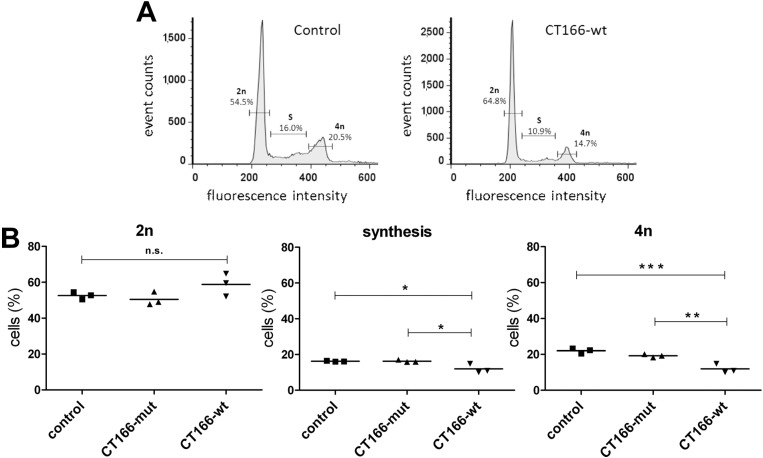
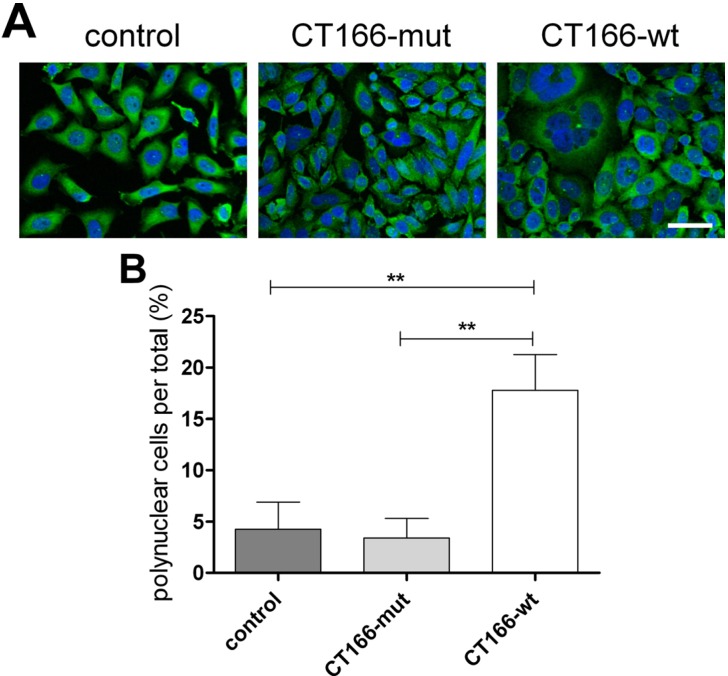
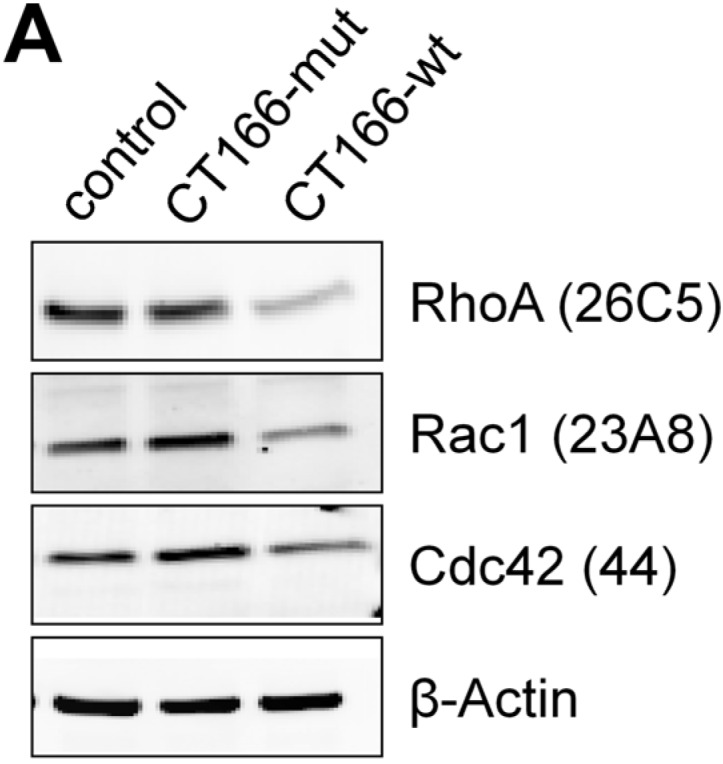
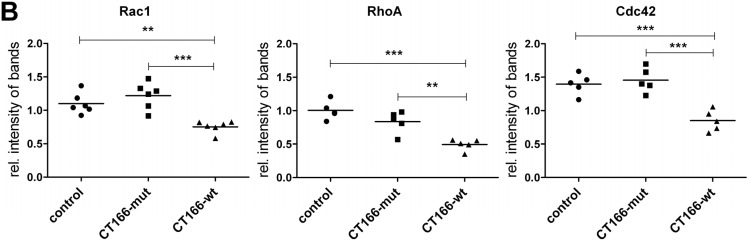
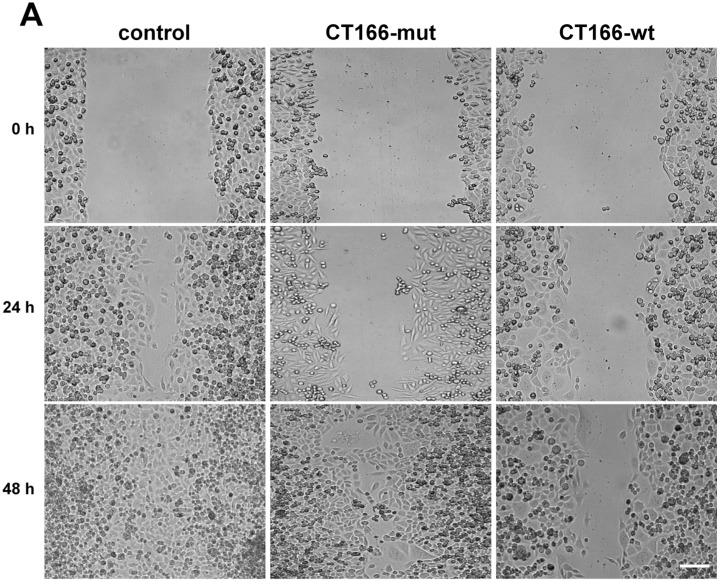
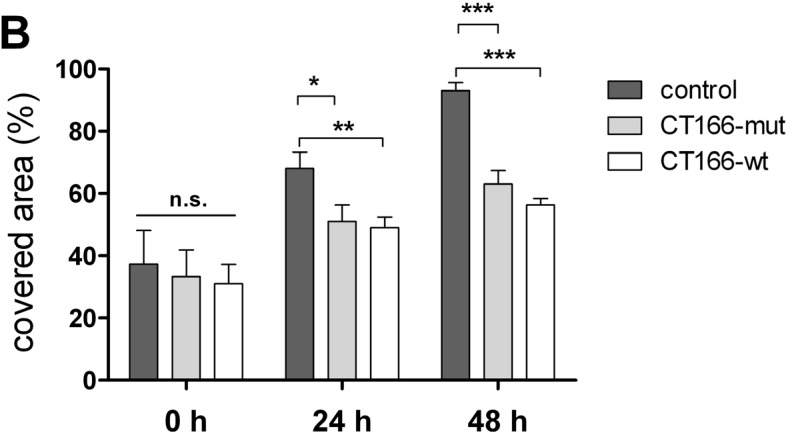
The Gram-negative, intracellular bacterium Chlamydia trachomatis causes acute and chronic urogenital tract infection, potentially leading to infertility and ectopic pregnancy. The only partially characterized cytotoxin CT166 of serovar D exhibits a DXD motif, which is important for the enzymatic activity of many bacterial and mammalian type A glycosyltransferases, leading to the hypothesis that CT166 possess glycosyltransferase activity. CT166-expressing HeLa cells exhibit actin reorganization, including cell rounding, which has been attributed to the inhibition of the Rho-GTPases Rac/Cdc42. Exploiting the glycosylation-sensitive Ras(27H5) antibody, we here show that CT166 induces an epitope change in Ras, resulting in inhibited ERK and PI3K signaling and delayed cell cycle progression. Consistent with the hypothesis that these effects strictly depend on the DXD motif, CT166 with the mutated DXD motif causes neither Ras-ERK inhibition nor delayed cell cycle progression. In contrast, CT166 with the mutated DXD motif is still capable of inhibiting cell migration, suggesting that CT166 with the mutated DXD motif cannot be regarded as inactive in any case. Taken together, CT166 affects various fundamental cellular processes, strongly suggesting its importance for the intracellular survival of chlamydia.
Figures
Similar articles
-
Actin re-organization induced by Chlamydia trachomatis serovar D--evidence for a critical role of the effector protein CT166 targeting Rac.PLoS One. 2010 Mar 25;5(3):e9887. doi: 10.1371/journal.pone.0009887. PLoS One. 2010. PMID: 20360858 Free PMC article.
-
Pseudomonas aeruginosa exoenzyme S, a bifunctional type-III secreted cytotoxin.Int J Med Microbiol. 2000 Oct;290(4-5):381-7. doi: 10.1016/S1438-4221(00)80047-8. Int J Med Microbiol. 2000. PMID: 11111915 Review.
-
Effects of sustained antibiotic bactericidal treatment on Chlamydia trachomatis-infected epithelial-like cells (HeLa) and monocyte-like cells (THP-1 and U-937).Int J Antimicrob Agents. 2006 Apr;27(4):316-24. doi: 10.1016/j.ijantimicag.2005.11.010. Epub 2006 Mar 9. Int J Antimicrob Agents. 2006. PMID: 16527461
-
Polymorphisms in the Chlamydia trachomatis cytotoxin locus associated with ocular and genital isolates.Infect Immun. 2004 Dec;72(12):7063-72. doi: 10.1128/IAI.72.12.7063-7072.2004. Infect Immun. 2004. PMID: 15557630 Free PMC article.
-
[Infections with Chlamydia trachomatis].Med Monatsschr Pharm. 2012 Jun;35(6):209-22; quiz 223-4. Med Monatsschr Pharm. 2012. PMID: 22808665 Review. German.
Cited by
-
Inter-species lateral gene transfer focused on the Chlamydia plasticity zone identifies loci associated with immediate cytotoxicity and inclusion stability.Mol Microbiol. 2021 Dec;116(6):1433-1448. doi: 10.1111/mmi.14832. Epub 2021 Nov 16. Mol Microbiol. 2021. PMID: 34738268 Free PMC article.
-
Chlamydia trachomatis In Vivo to In Vitro Transition Reveals Mechanisms of Phase Variation and Down-Regulation of Virulence Factors.PLoS One. 2015 Jul 24;10(7):e0133420. doi: 10.1371/journal.pone.0133420. eCollection 2015. PLoS One. 2015. PMID: 26207372 Free PMC article.
-
The molecular mechanism of induction of unfolded protein response by Chlamydia.Biochem Biophys Res Commun. 2019 Jan 8;508(2):421-429. doi: 10.1016/j.bbrc.2018.11.034. Epub 2018 Nov 28. Biochem Biophys Res Commun. 2019. PMID: 30503337 Free PMC article.
-
Pathogenic Puppetry: Manipulation of the Host Actin Cytoskeleton by Chlamydia trachomatis.Int J Mol Sci. 2019 Dec 21;21(1):90. doi: 10.3390/ijms21010090. Int J Mol Sci. 2019. PMID: 31877733 Free PMC article. Review.
-
cpsA regulates mycotoxin production, morphogenesis and cell wall biosynthesis in the fungus Aspergillus nidulans.Mol Microbiol. 2017 Jul;105(1):1-24. doi: 10.1111/mmi.13682. Epub 2017 Apr 24. Mol Microbiol. 2017. PMID: 28370587 Free PMC article.
References
-
- Genth H., Pauillac S., Schelle I., Bouvet P., Bouchier C., Varela-Chavez C., Just I., Popoff M.R. Haemorrhagic toxin and lethal toxin from Clostridium sordellii strain vpi9048: Molecular characterization and comparative analysis of substrate specificity of the large clostridial glucosylating toxins. Cell. Microbiol. 2014;16:1706–1721. doi: 10.1111/cmi.12321. - DOI - PubMed
Publication types
MeSH terms
Substances
LinkOut - more resources
Full Text Sources
Other Literature Sources
Molecular Biology Databases
Miscellaneous
