

Physics-based potentials for the coupling between backbone- and side-chain-local conformational states in the UNited RESidue (UNRES) force field for protein simulations
- PMID: 25691834
- PMCID: PMC4327884
- DOI: 10.1021/ct500736a
Physics-based potentials for the coupling between backbone- and side-chain-local conformational states in the UNited RESidue (UNRES) force field for protein simulations
Abstract
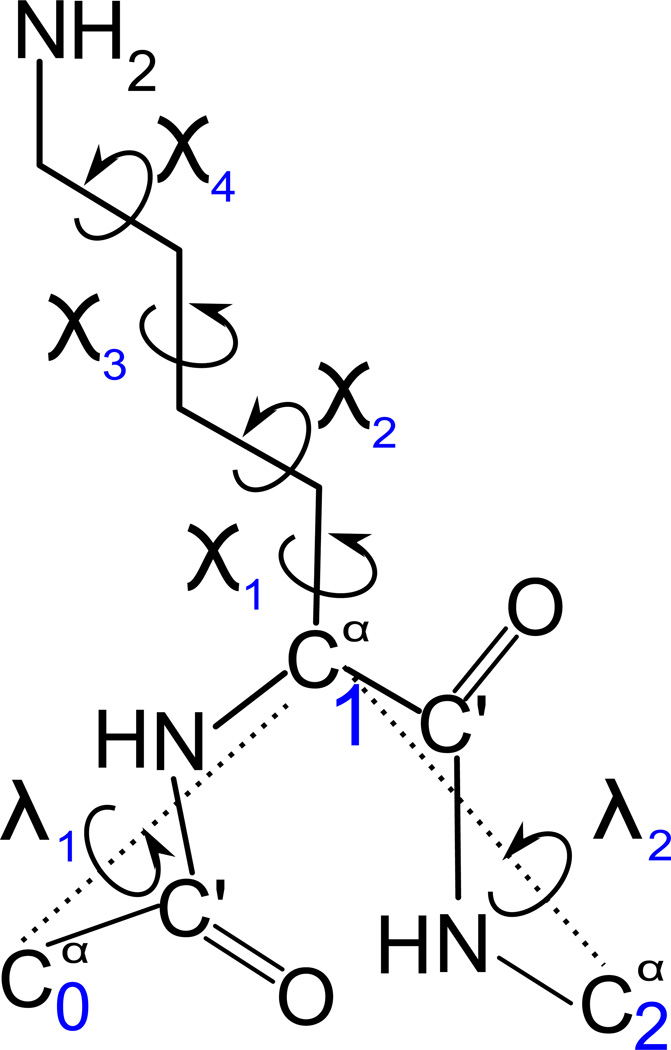
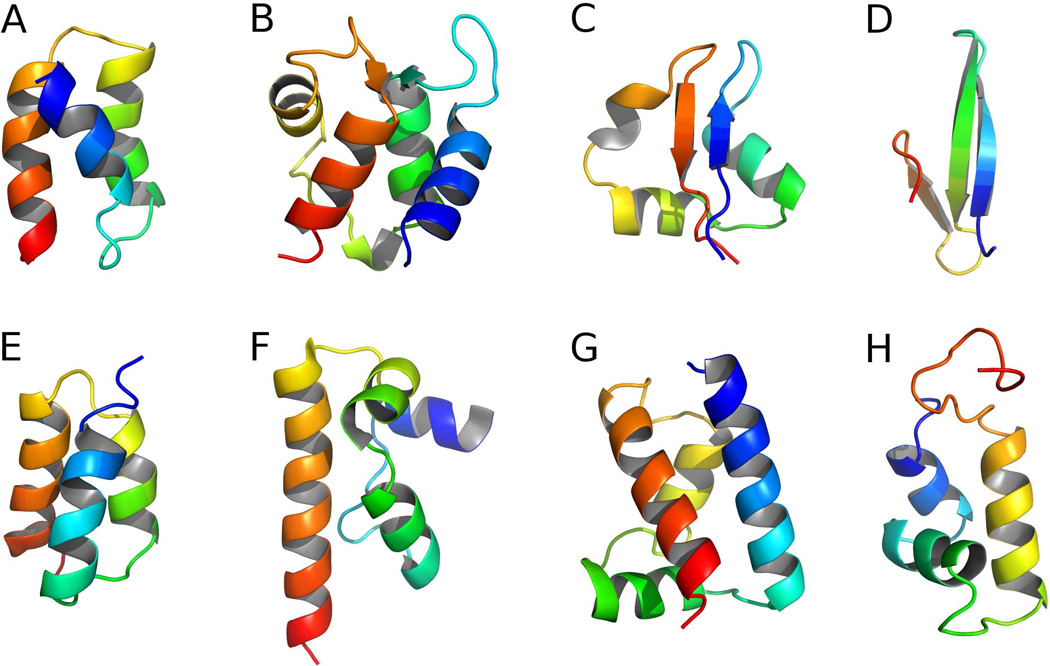
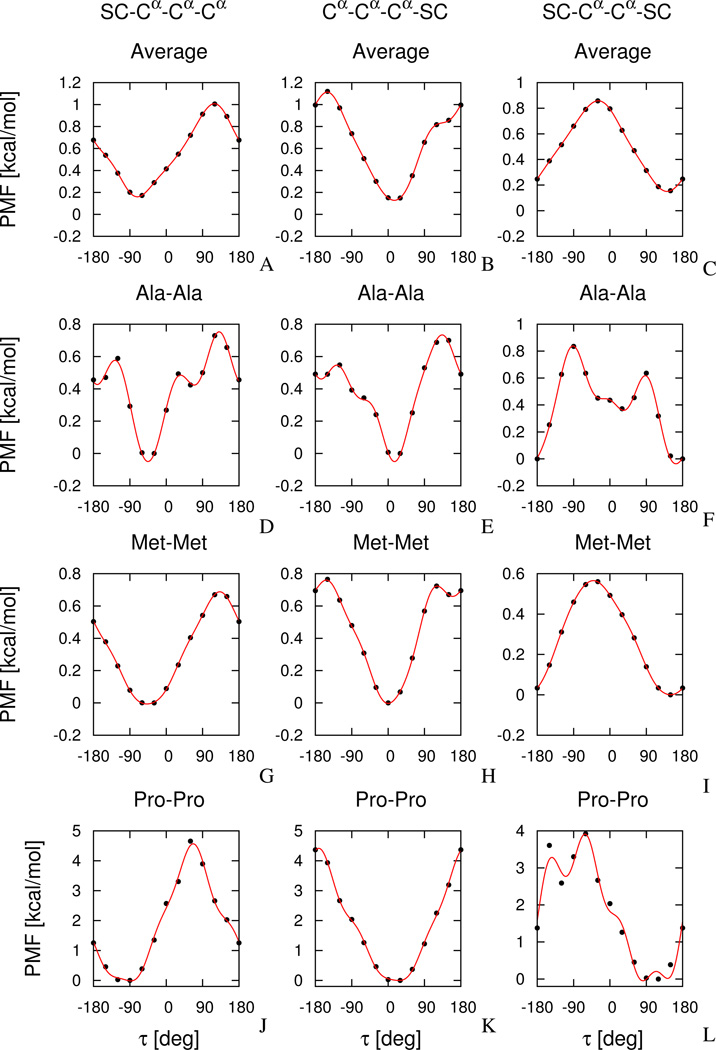
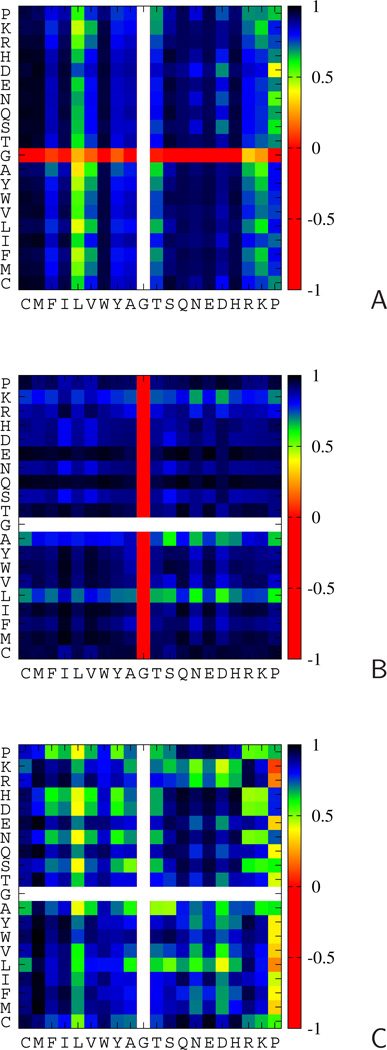
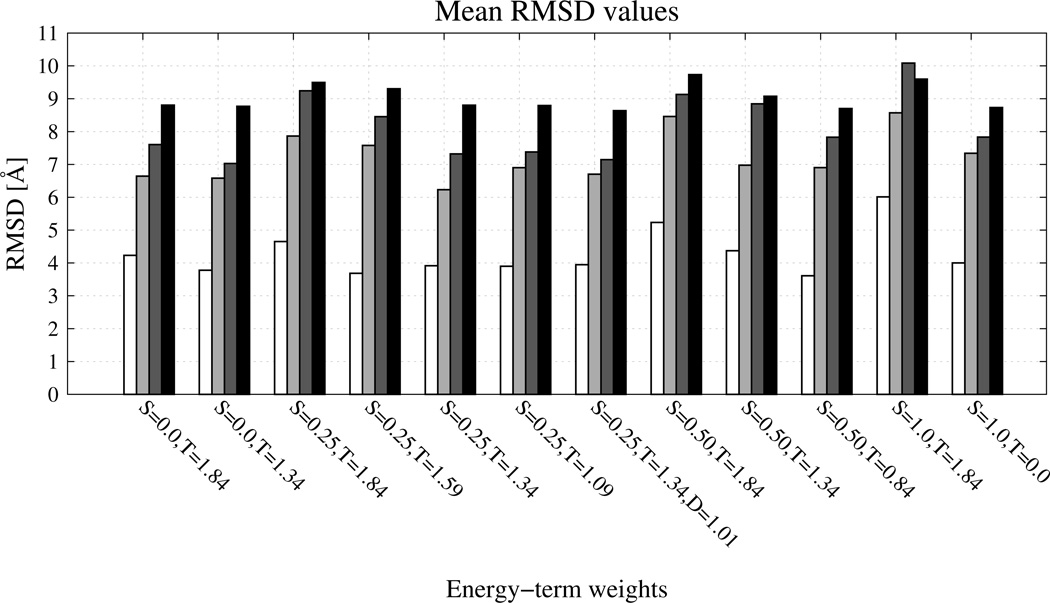
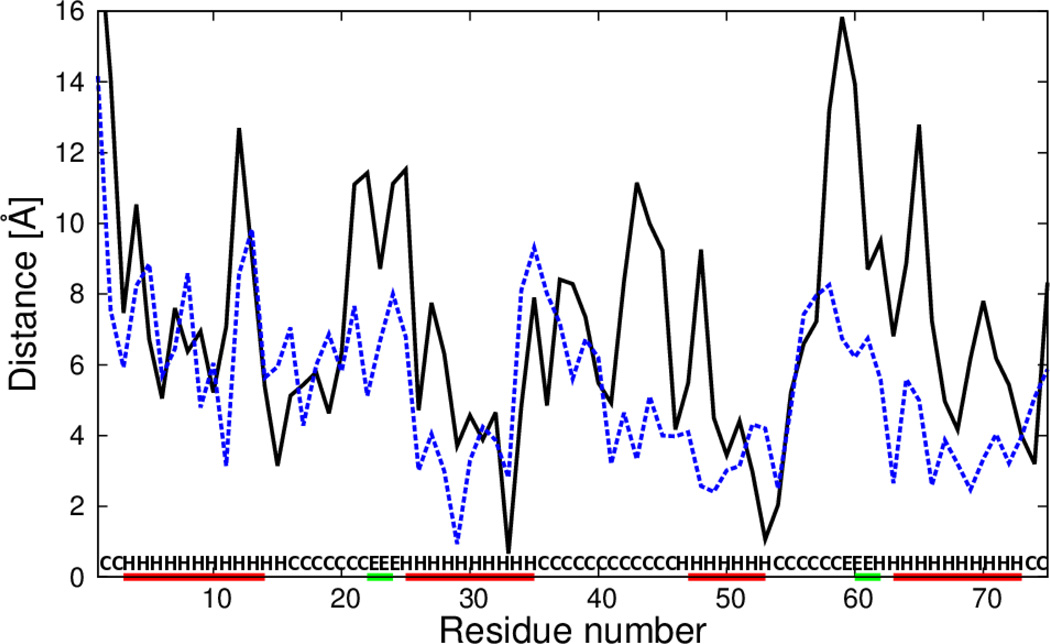
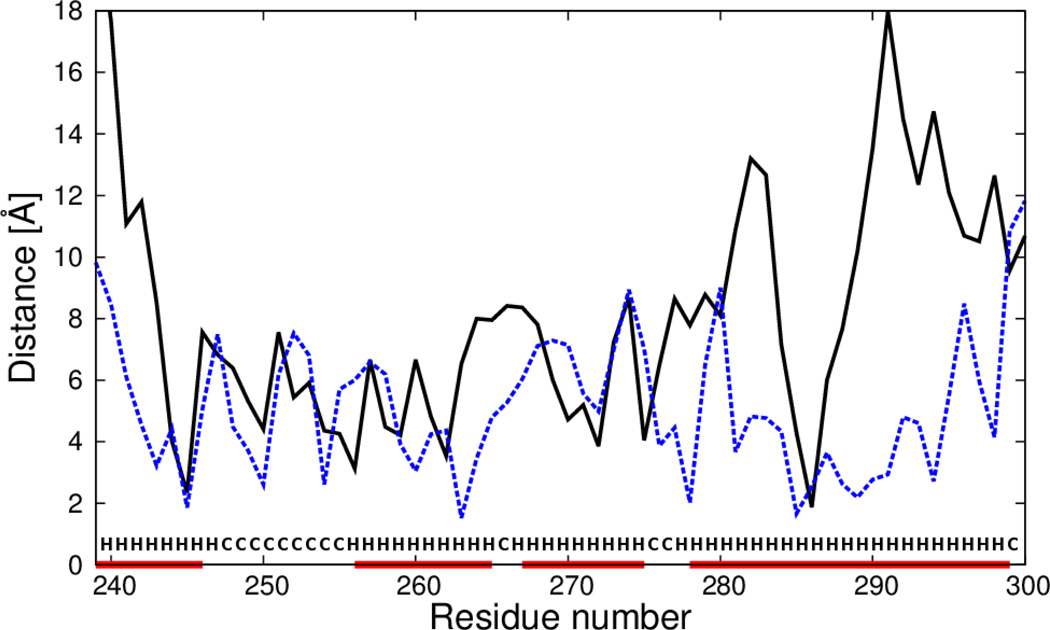
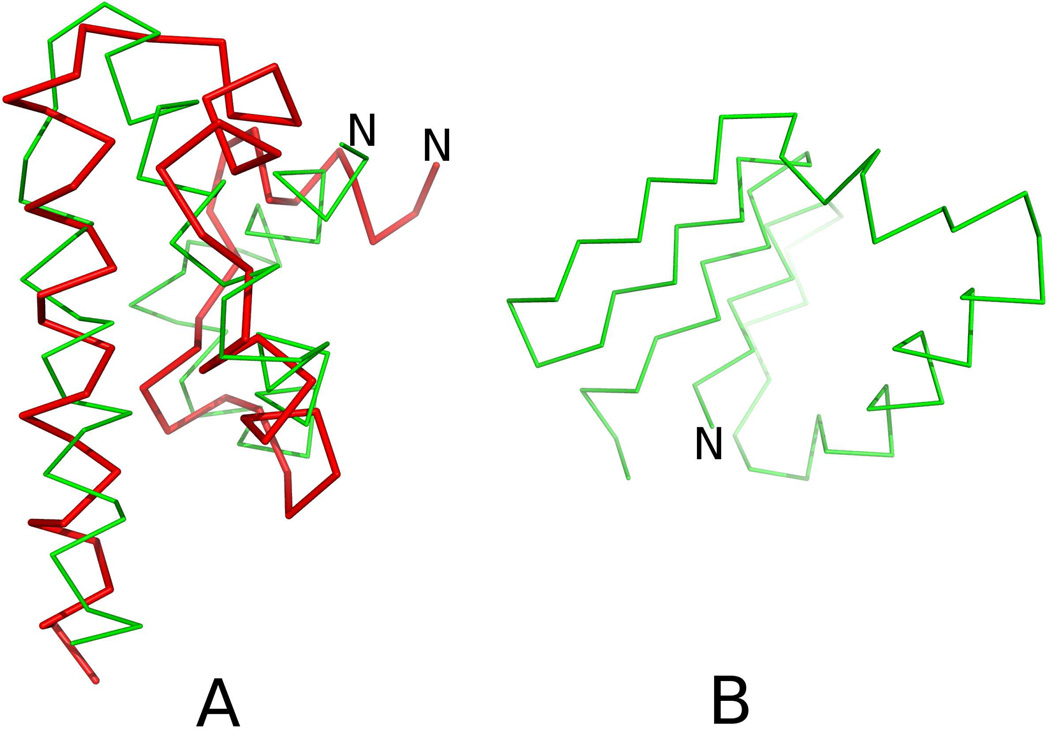
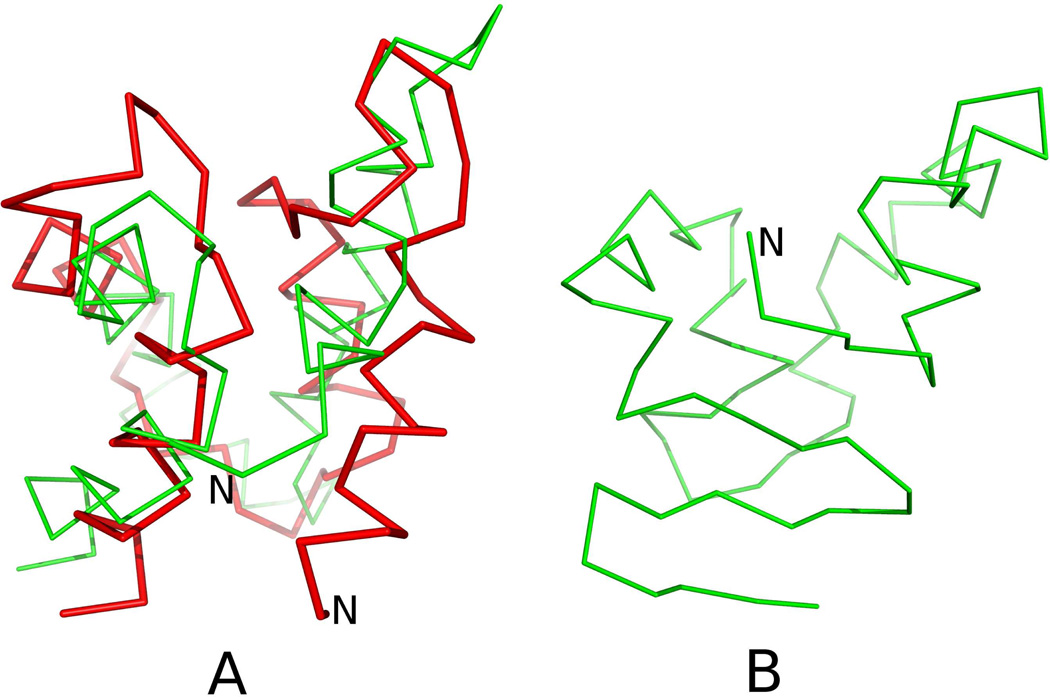
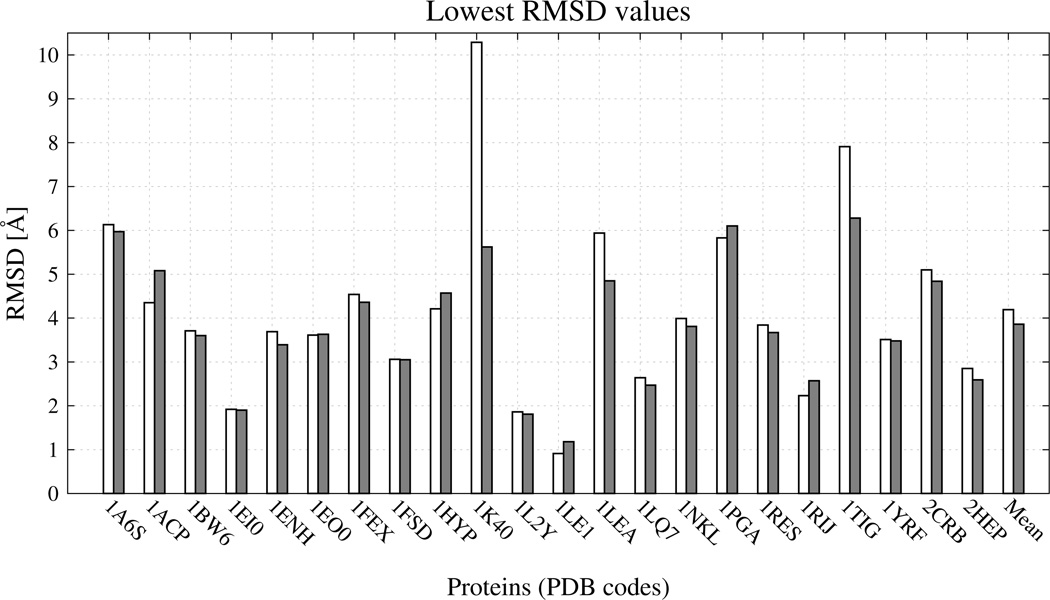
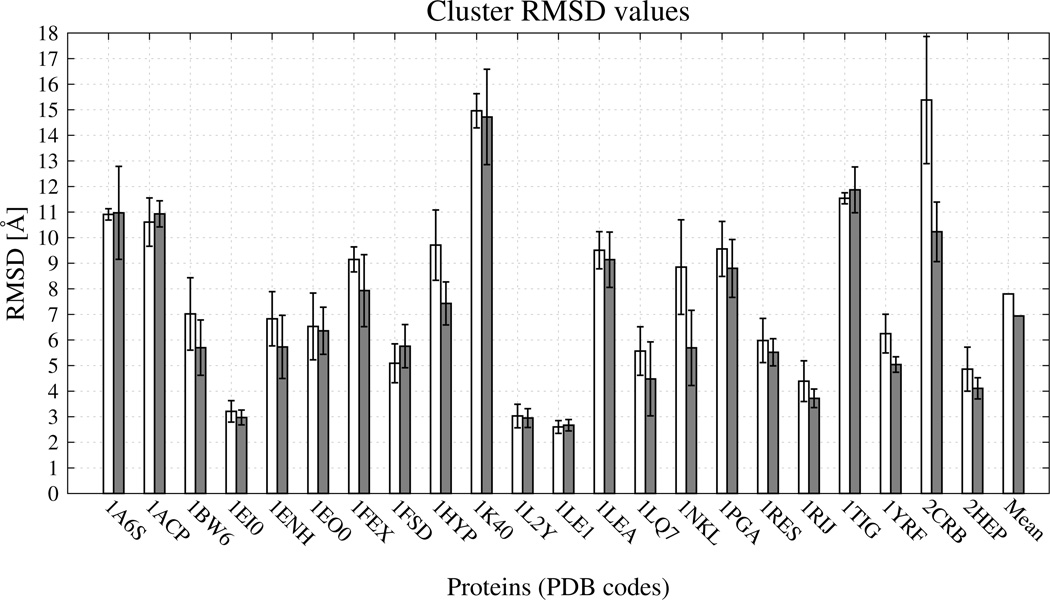
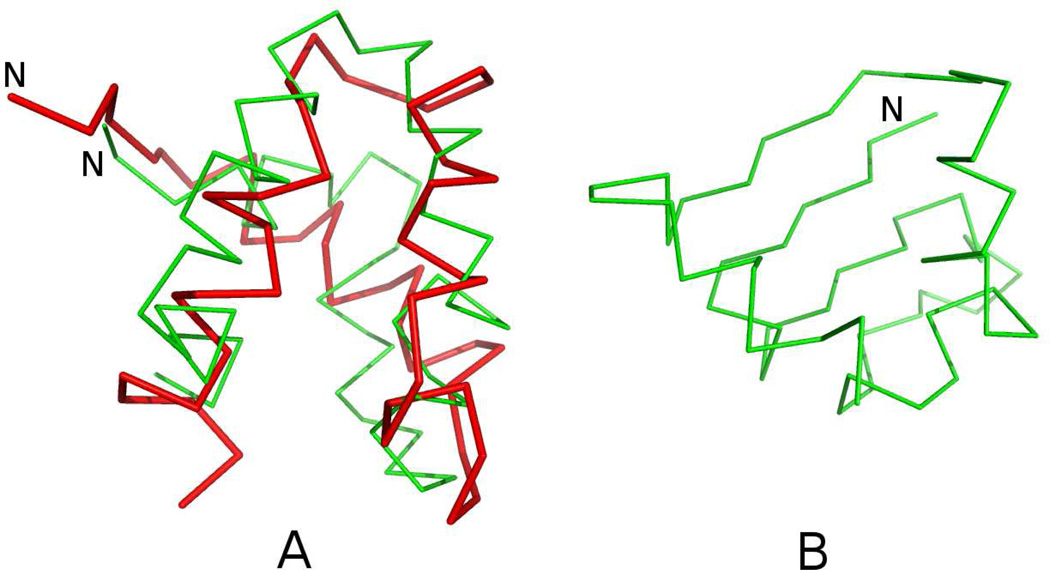
The UNited RESidue (UNRES) model of polypeptide chains is a coarse-grained model in which each amino-acid residue is reduced to two interaction sites, namely, a united peptide group (p) located halfway between the two neighboring α-carbon atoms (Cαs), which serve only as geometrical points, and a united side chain (SC) attached to the respective Cα. Owing to this simplification, millisecond molecular dynamics simulations of large systems can be performed. While UNRES predicts overall folds well, it reproduces the details of local chain conformation with lower accuracy. Recently, we implemented new knowledge-based torsional potentials (Krupa et al. J. Chem. Theory Comput. 2013, 9, 4620–4632) that depend on the virtual-bond dihedral angles involving side chains: Cα···Cα···Cα···SC (τ(1)), SC···Cα···Cα···Cα (τ(2)), and SC···Cα···Cα···SC (τ(3)) in the UNRES force field. These potentials resulted in significant improvement of the simulated structures, especially in the loop regions. In this work, we introduce the physics-based counterparts of these potentials, which we derived from the all-atom energy surfaces of terminally blocked amino-acid residues by Boltzmann integration over the angles λ(1) and λ(2) for rotation about the Cα···Cα virtual-bond angles and over the side-chain angles χ. The energy surfaces were, in turn, calculated by using the semiempirical AM1 method of molecular quantum mechanics. Entropy contribution was evaluated with use of the harmonic approximation from Hessian matrices. One-dimensional Fourier series in the respective virtual-bond-dihedral angles were fitted to the calculated potentials, and these expressions have been implemented in the UNRES force field. Basic calibration of the UNRES force field with the new potentials was carried out with eight training proteins, by selecting the optimal weight of the new energy terms and reducing the weight of the regular torsional terms. The force field was subsequently benchmarked with a set of 22 proteins not used in the calibration. The new potentials result in a decrease of the root-mean-square deviation of the average conformation from the respective experimental structure by 0.86 Å on average; however, improvement of up to 5 Å was observed for some proteins.
Figures


Similar articles
-
Revised Backbone-Virtual-Bond-Angle Potentials to Treat the l- and d-Amino Acid Residues in the Coarse-Grained United Residue (UNRES) Force Field.J Chem Theory Comput. 2014 May 13;10(5):2194-2203. doi: 10.1021/ct500119r. Epub 2014 Apr 15. J Chem Theory Comput. 2014. PMID: 24839411 Free PMC article.
-
Determination of side-chain-rotamer and side-chain and backbone virtual-bond-stretching potentials of mean force from AM1 energy surfaces of terminally-blocked amino-acid residues, for coarse-grained simulations of protein structure and folding. I. The method.J Comput Chem. 2010 Apr 30;31(6):1143-53. doi: 10.1002/jcc.21399. J Comput Chem. 2010. PMID: 20073062 Free PMC article.
-
An improved functional form for the temperature scaling factors of the components of the mesoscopic UNRES force field for simulations of protein structure and dynamics.J Phys Chem B. 2009 Jun 25;113(25):8738-44. doi: 10.1021/jp901788q. J Phys Chem B. 2009. PMID: 19480420 Free PMC article.
-
Coarse-grained force field: general folding theory.Phys Chem Chem Phys. 2011 Oct 14;13(38):16890-901. doi: 10.1039/c1cp20752k. Epub 2011 Jun 3. Phys Chem Chem Phys. 2011. PMID: 21643583 Free PMC article. Review.
-
Toward Consistent Physics-Based Modeling of Local Backbone Structures and Chirality Change of Proteins in Coarse-Grained Approaches.J Phys Chem Lett. 2023 Nov 9;14(44):9824-9833. doi: 10.1021/acs.jpclett.3c01988. Epub 2023 Oct 27. J Phys Chem Lett. 2023. PMID: 37889895 Free PMC article. Review.
Cited by
-
Probing Protein Aggregation Using the Coarse-Grained UNRES Force Field.Methods Mol Biol. 2022;2340:79-104. doi: 10.1007/978-1-0716-1546-1_5. Methods Mol Biol. 2022. PMID: 35167071
-
Molecular dynamics of protein A and a WW domain with a united-residue model including hydrodynamic interaction.J Chem Phys. 2016 May 14;144(18):184110. doi: 10.1063/1.4948710. J Chem Phys. 2016. PMID: 27179474 Free PMC article.
-
Mean-Field Coupling Between Local Interactions in Proteins in Relation to Chirality, Secondary, and Supersecondary Structure Formation, and Allostery.Methods Mol Biol. 2025;2870:267-288. doi: 10.1007/978-1-0716-4213-9_14. Methods Mol Biol. 2025. PMID: 39543040
-
Modeling the Structure, Dynamics, and Transformations of Proteins with the UNRES Force Field.Methods Mol Biol. 2022;2376:399-416. doi: 10.1007/978-1-0716-1716-8_23. Methods Mol Biol. 2022. PMID: 34845623
-
Disulfide-Linked Peptides for Blocking BTLA/HVEM Binding.Int J Mol Sci. 2020 Jan 18;21(2):636. doi: 10.3390/ijms21020636. Int J Mol Sci. 2020. PMID: 31963646 Free PMC article.
References
Publication types
MeSH terms
Substances
Grants and funding
LinkOut - more resources
Full Text Sources
Other Literature Sources