. 2015 Feb 3:9:27.
doi: 10.3389/fncel.2015.00027. eCollection 2015.

A use-dependent increase in release sites drives facilitation at calretinin-deficient cerebellar parallel-fiber synapses

Affiliations

A use-dependent increase in release sites drives facilitation at calretinin-deficient cerebellar parallel-fiber synapses

Simone Brachtendorf et al. Front Cell Neurosci. .

Abstract

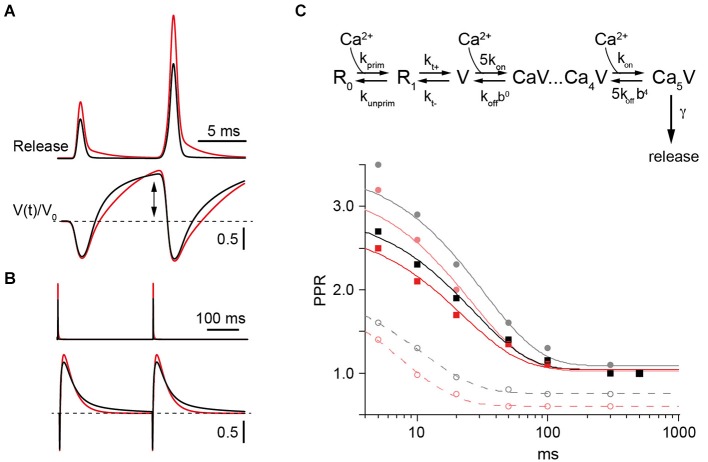
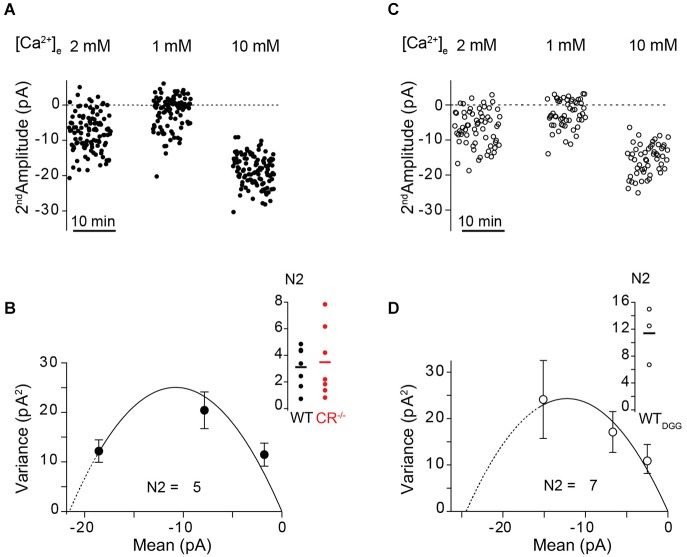
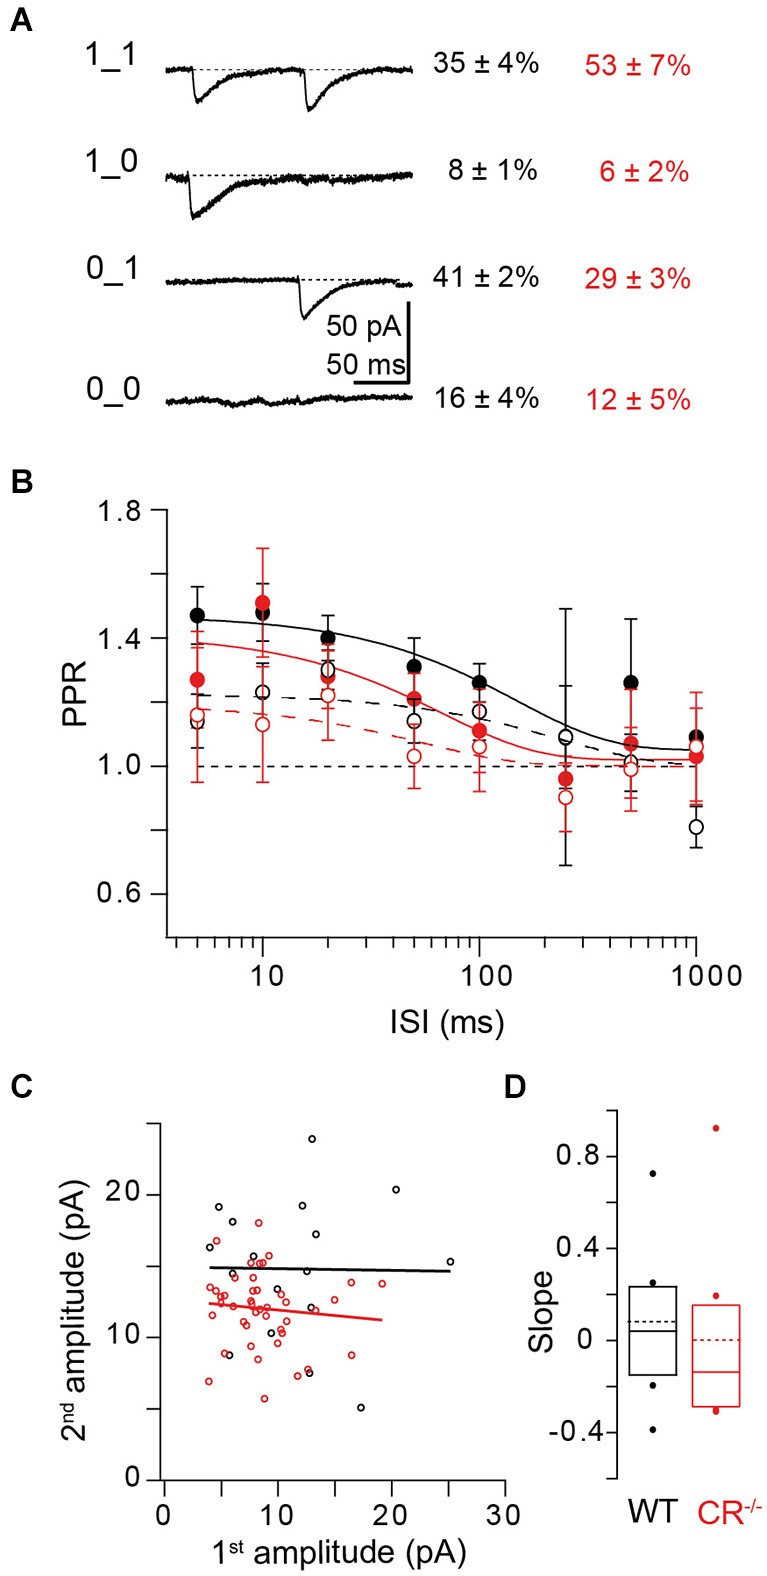
Endogenous Ca(2+)-binding proteins affect synaptic transmitter release and short-term plasticity (STP) by buffering presynaptic Ca(2+) signals. At parallel-fiber (PF)-to-Purkinje neuron (PN) synapses in the cerebellar cortex loss of calretinin (CR), the major buffer at PF terminals, results in increased presynaptic Ca(2+) transients and an almost doubling of the initial vesicular releases probability (p r). Surprisingly, however, it has been reported that loss of CR from PF synapses does not alter paired-pulse facilitation (PPF), while it affects presynaptic Ca(2+) signals as well as p r. Here, we addressed this puzzling observation by analyzing the frequency- and Ca(2+)-dependence of PPF at unitary PF-to-PN synapses of wild-type (WT) and CR-deficient (CR(-/-)) mice using paired recordings and computer simulations. Our analysis revealed that PPF in CR(-/-) is indeed smaller than in the WT, to a degree, however, that indicates that rapid vesicle replenishment and recruitment of additional release sites dominate the synaptic efficacy of the second response. These Ca(2+)-driven processes operate more effectively in the absence of CR, thereby, explaining the preservation of robust PPF in the mutants.

Keywords: calretinin; granule cells; paired recordings; paired-pulse facilitation; ready-releasable pool; short-term plasticity.


Figures

Figure 1
Figure 1
Identification of unitary GC–PN connections. (A,B) Schemes of experimental approaches. (A) Top: PNs were held in the whole-cell configuration. GCs were stimulated via puffs of K+-containing pipette solution applied to the granule cell layer (GCL). Example recordings from a PN during K+-application to different regions of the GCL are shown below. Middle: no activation of connected GCs; bottom: inward currents recorded in response to activation of connected GCs. Triangles indicate times of K+-application to the GLC. (B) Top: Single GCs were stimulated in the loose-cell attached configuration within the region that responded to K+-puffs. Bottom: Example recording from a not connected (1) and a connected (2) GC-PN pair. Action currents (ACs) (gray) elicited in the GC and the corresponding postsynaptic response (black). (C) Presynaptic ACs were reversibly inhibited by bath application of 1 μM TTX. Currents from GC (gray; stars denote ACs; initial peaks are capacitive currents) and the corresponding current traces (black) recorded from the connected PN.
Figure 2
Figure 2
Properties of connected GC-PN pairs in the WT. (A) Example of a paired-pulse experiment at denoted ISI from a unitary GC-PN connection (individual traces in gray; average, including failures, in black). Inset: EPSC amplitudes (black arrows) were determined by fitting products of two exponentials (dashed black lines) to the currents, allowing for subtracting the decay of the first EPSC (A1) from the peak of the second EPSC (A2). (B) PPRs plotted against the indicated ISI (mean ± SE, n = 12). The solid line represents an exponential fit to the data (τ = 96 ms; χ2 = 1.435). (C) Fraction of synaptic failures in the second response (F2) plotted vs. the indicated ISI (mean ± SE, n = 12). The fraction of synaptic failure in the first response (F1 = 0.57 ± 0.04, n = 16) is plotted at the interval between successive recordings (5 s). Solid line represents exponential fit to the data (τ = 85 ms; χ2 = 0.621).
Figure 3
Figure 3
PPF at unitary CR−/− synapses. (A) Example of paired-pulse stimulation at indicated ISI from a unitary CR−/− GC-PN connection (individual traces in gray; average, including failures, in black). (B) Comparison of PPRs vs. ISI in WT (cf. Figure 2B) and CR−/− (red, mean ± SE, n = 6). Solid lines represent exponential fits to the data (CR−/−: τ = 100 ms; χ2 = 0.73). PPF was significantly reduced in CR−/− compared to WT (PPR = 2.4 ± 0.6 at 5 ms and 2.1 ± 0.3 at 10 ms; *P = 0.038 with a two-way ANOVA for the complete frequency range; P < 0.01 with Kruskal-Wallis (K-W) ANOVA). Inset: Average first EPSC amplitude (including failures) in WT and CR KO (mean ± SE, n = 16 and 11, respectively; P = 0.059, t-test). (C) Comparison of the frequency dependence of synaptic failures in the second response (F2) in WT (black; cf. Figure 2C) and CR−/− (red; mean ± SE, n = 6; *P = 0.022 two-way ANOVA, P < 0.01 with K-W ANOVA) terminals. The initial failure rate (F1) was determined at the interval between successive recordings (CR−/−: n = 11, *P = 0.027, t-test). Solid lines represent exponential fits to the data (CR−/−: τ = 101 ms; χ2 = 0.156).
Figure 4
Figure 4
Rapid replenishment and overfilling contribute to PPF. (A) Examples of EPSCs recorded at an ISI of 10 ms at different extracellular Ca2+-concentrations from a representative WT (black) and CR−/− (red) unitary connection. (B) PPR vs. Ca2+-concentration from individual pairs at an ISI of 10 ms for WT (black; solid circles, solid line indicates the average; n = 10), CR−/− (red; n = 8), and WT in the presence of γ-DGG (5 mM, WTDGG; open circles; dashed line indicates average; n = 4). For all [Ca2+]e concentrations tested, PPR in the mutant was significantly smaller than in WT (*P < 0.01, K-W ANOVA). (C) Plot of PPR vs. pr for all [Ca2+]e revealing a decline in PPR with increasing pr in WT and CR−/− (PPR: mean ± SE (cf. Panel B), pr: median ± SE; WT (black): n = 10; CR−/− (red): n = 8). Shaded areas indicate the maximum theoretical values of PPR (PPRmax for pr2 = 1) in presence (top line) and in absence (bottom line) of full vesicle replenishment. PPR values at high pr are close to the theoretical PPRmax with full vesicle replenishment for mutant and WT. PPR values determined in the presence of γ-DGG (open squares, WTDGG: n = 4) exceed the theoretical PPRmax with full vesicle replenishment.
Figure 5
Figure 5
Model of PPF in WT and CR−/− synapses. (A) Upper: Simulated transmitter release rates during a pair of synaptic activations at an ISI of 10 ms in WT (black) or CR−/− synapses (red) normalized to the first release process in the WT. Lower: Temporal variation of Ca2+-free release sensor sites (V(t)) normalized to their value prior to the first stimulus (V0) during 100 Hz activation in WT (black) or KO synapses (red). Note the increase (arrow) above V0 (dashed line) between pulses. (B) Same as in (A) but for two activations with an ISI of 300 ms. (C) Upper: Scheme of the model which includes a release sensor with 5 Ca2+ binding sites (V) and a two-step replenishment (R0, R1) with the first step being Ca2+ dependent and the second step indirectly Ca2+ dependent (Millar et al., ; Sakaba, 2008). Lower: Paired pulse ratios (PPRs) calculated as the ratio of release probabilities between the second and the first pulse plotted against the ISI. Lines represent exponential fits. Curves for the WT are in gray and black and those for the CR−/− in red. Solid gray and light red curves represent simulations with koff set to 1000 s−1 (Millar et al., 2005). The corresponding PPRs result from the combined action of Ca2+ remaining bound to the release sensor (active Ca2+) between stimuli at small ISI (dashed lines) and overfilling of the pool V (cf. (A)). Increasing koff to 3500 s−1 eliminated facilitation due to active Ca2+ and resulted in the black and red curves for the frequency dependence of PPR in WT and KO, respectively. Irrespective of model details only slightly decreased facilitation is predicted for the KO in comparison to the WT.
Figure 6
Figure 6
Use dependent increase in N quantified by MPFA. (A,C) Fluctuation analysis of second EPSC amplitudes recorded at an ISI of 10 ms at the indicated [Ca2+]e from an unitary WT GC-PN connection in the absence ((A), closed circles) and in the presence of γ-DGG ((C), open circles), respectively. (B,D) Corresponding variance–mean relationships of the noise-corrected second EPSC amplitudes. Error bars show the variance of the variance. The solid lines represent the parabolic MPFA fit ((B), χ2 = 3.709; (D), χ2 = 0.665), which yielded the binominal parameter N for the second pulse (N2). Line dashing indicates the region over which the fit has been extrapolated. Inset: Summary of the estimated N2 values in absence (B) and presence of γ-DGG (D). Solid lines: Mean of N2 (WT: 3.2 ± 0.5, n = 7; CR−/−: 3.5 ± 1, n = 7; WTDGG: 11 ± 3, n = 3).
Figure 7
Figure 7
Relationship between release and replenishment. (A) Binary group analysis of the four possible synaptic responses in paired-pulse experiments. Left: Averaged traces from an example cell of successes on both trials (1_1), of failures on both trials (0_0) and of 1_0; 0_1 responses. Right: Percentages (mean ± SE) of the different synaptic responses in WT (black; n = 16) and CR−/− synapses (red; n = 12). (B) ISI dependency of PPR1_1/1_1 (open circles and dashed lines representing exponential fits; mean ± SE) in WT (black; n = 12; χ2 = 4.603) and CR−/− synapses (red; n = 12; χ2 = 0.272). Note that in both genotypes the amplitude of the second EPSC is increased at short ISI rather than depressed. The solid circles and lines show the frequency dependence of PPR0_1/1_x for WT (black; χ2 = 0.32) and CR−/− (red; χ2 = 0.378). Lines represent exponential fits to the data. (C) Second EPSC amplitudes of 1_1 events at ISI 10 ms plotted against their corresponding first amplitudes for an individual WT (black) or CR−/− (red) synapse. Lines indicate linear fits to the data (black: slope = −0.01, Pearson’s R (Pr) = −0.013, r2 = 0.0002; red: slope = −0.08, Pr = −0.1, r2 = 0.01). (D) Summary of all slopes obtained from plots as those shown in (C). Solid lines and boxes indicate median and IQR (see text), dots outlier, dashed lines the mean values for WT (black; 0.08 ± 0.11, mean ± SE; n = 8) and CR−/− (red; 0 ± 0.14; n = 8; P = 0.442; Mann-Whitney rank sum test).

Similar articles

Cited by

References

    1. Abbott L. F., Regehr W. G. (2004). Synaptic computation. Nature 431, 796–803. 10.1038/nature03010 - DOI - PubMed
    1. Arendt O., Schwaller B., Brown E. B., Eilers J., Schmidt H. (2013). Restricted diffusion of calretinin in cerebellar granule cell dendrites implies Ca2+-dependent interactions via its EF-hand 5 domain. J. Physiol. 591, 3887–3899. 10.1113/jphysiol.2013.256628 - DOI - PMC - PubMed
    1. Atluri P. P., Regehr W. G. (1996). Determinants of the time course of facilitation at the granule cell to Purkinje cell synapse. J. Neurosci. 16, 5661–5671. - PMC - PubMed
    1. Baur D., Bornschein G., Althof D., Watanabe M., Kulik A., Eilers J., et al. (in press). Developmental tightening of cerebellar cortical synaptic influx-release coupling. J. Neurosci. - PMC - PubMed
    1. Bertram R., Sherman A., Stanley E. F. (1996). Single-domain/bound calcium hypothesis of transmitter release and facilitation. J. Neurophysiol. 75, 1919–1931. - PubMed

LinkOut - more resources