

Contribution of parvalbumin and somatostatin-expressing GABAergic neurons to slow oscillations and the balance in beta-gamma oscillations across cortical layers
- PMID: 25691859
- PMCID: PMC4315041
- DOI: 10.3389/fncir.2015.00006
Contribution of parvalbumin and somatostatin-expressing GABAergic neurons to slow oscillations and the balance in beta-gamma oscillations across cortical layers
Abstract
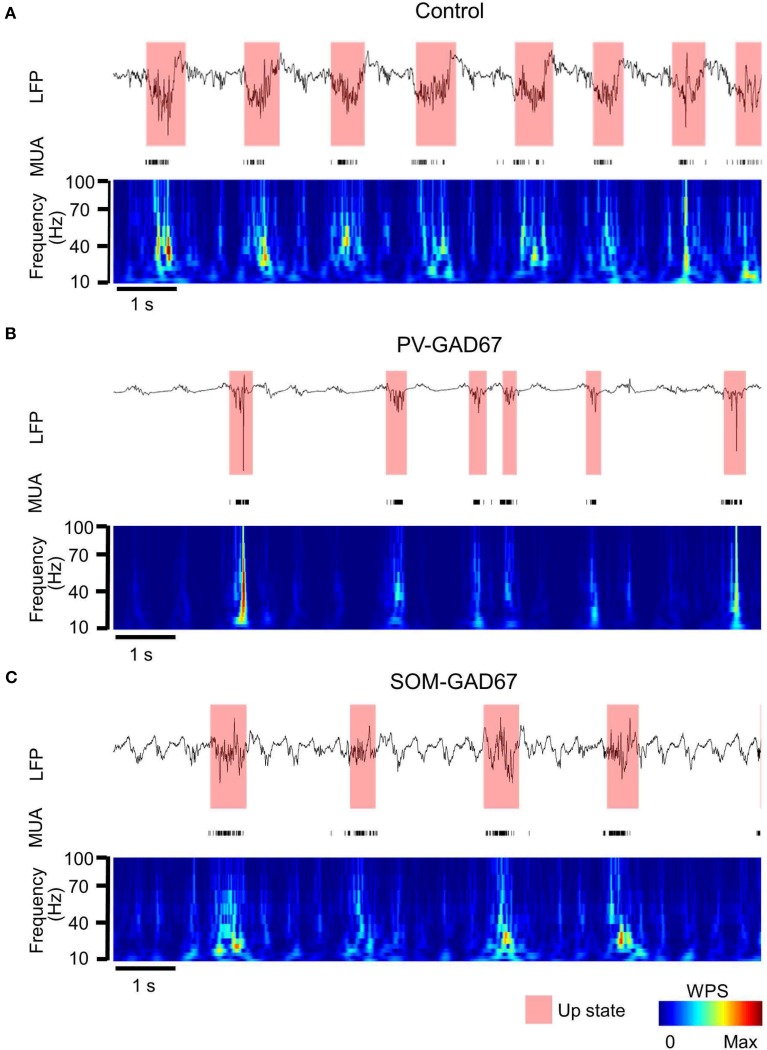
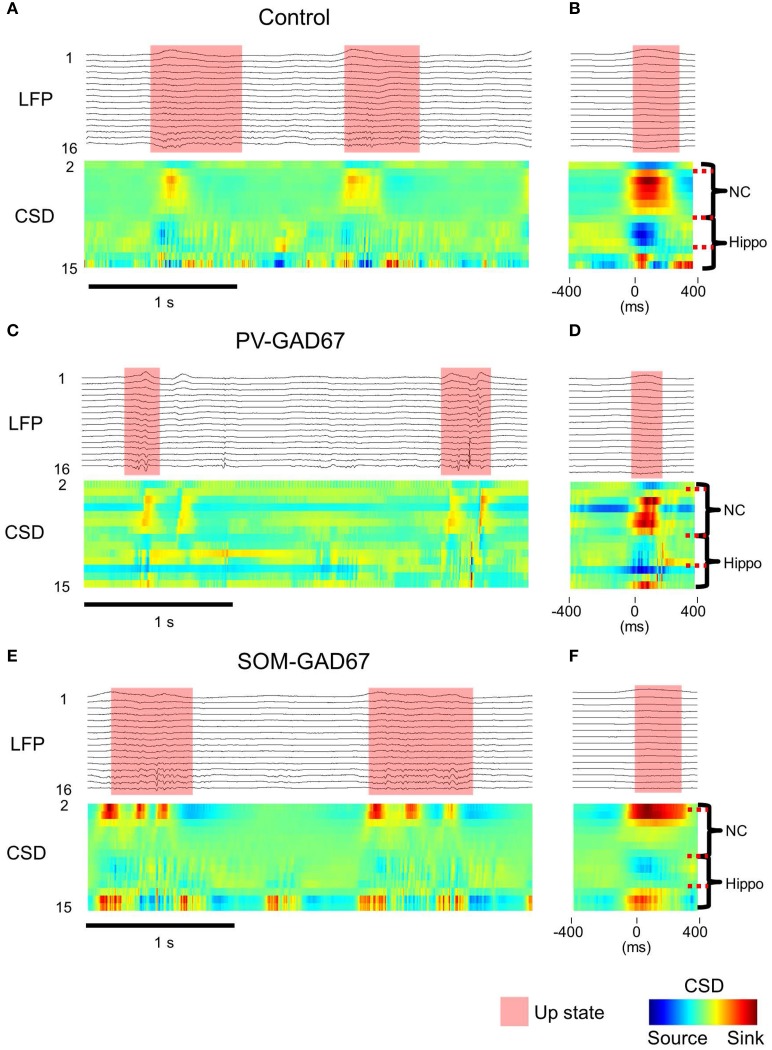
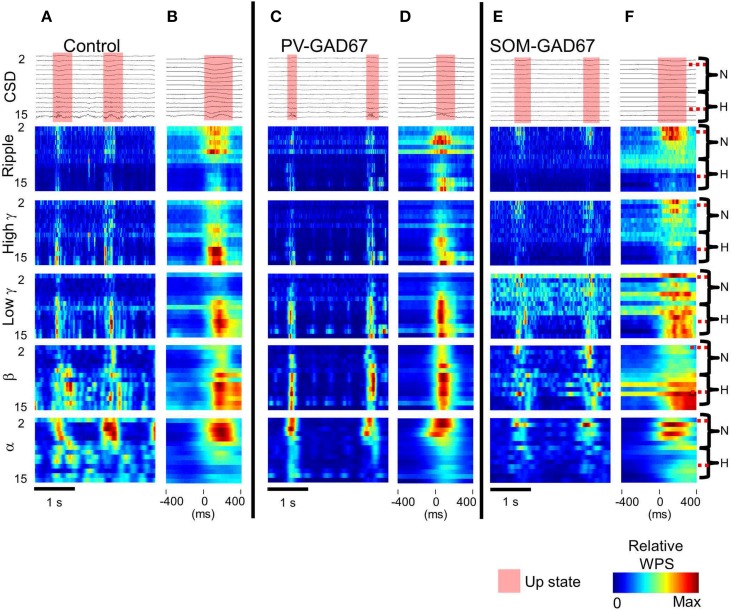
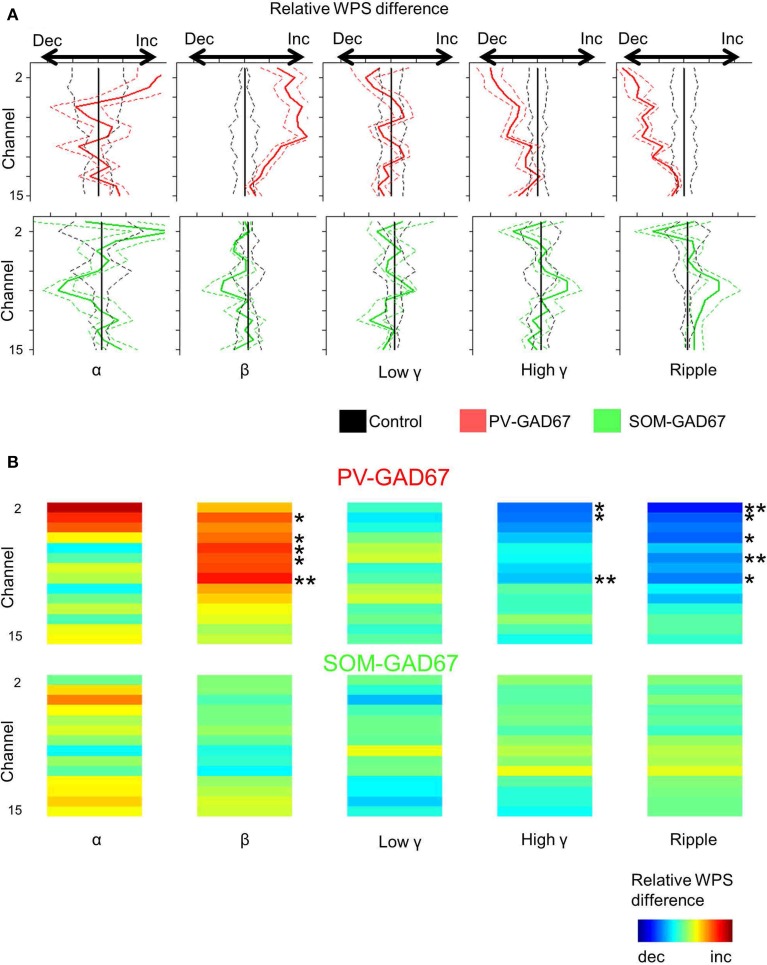
Cortical interneurons are classified into several subtypes that contribute to cortical oscillatory activity. Parvalbumin (PV)-expressing cells, a type of inhibitory interneuron, are involved in the gamma oscillations of local field potentials (LFPs). Under ketamine-xylazine anesthesia or sleep, mammalian cortical circuits exhibit slow oscillations in which the active-up state and silent-down state alternate at ~1 Hz. The up state is composed of various high-frequency oscillations, including gamma oscillations. However, it is unclear how PV cells and somatostatin (SOM) cells contribute to the slow oscillations and the high-frequency oscillations nested in the up state. To address these questions, we used mice lacking glutamate decarboxylase 67, primarily in PV cells (PV-GAD67 mice) or in SOM cells (SOM-GAD67 mice). We then compared LFPs between PV-GAD67 mice and SOM-GAD67 mice. PV cells target the proximal regions of pyramidal cells, whereas SOM cells are dendrite-preferring interneurons. We found that the up state was shortened in duration in the PV-GAD67 mice, but tended to be longer in SOM-GAD67 mice. Firing rate tended to increase in PV-GAD67 mice, but tended to decrease in SOM-GAD67 mice. We also found that delta oscillations tended to increase in SOM-GAD67 mice, but tended to decrease in PV-GAD67 mice. Current source density and wavelet analyses were performed to determine the depth profiles of various high-frequency oscillations. High gamma and ripple (60-200 Hz) power decreased in the neocortical upper layers specifically in PV-GAD67 mice, but not in SOM-GAD67. In addition, beta power (15-30 Hz) increased in the deep layers, specifically in PV-GAD67 mice. These results suggest that PV cells play important roles in persistence of the up state and in the balance between gamma and beta bands across cortical layers, whereas SOM and PV cells may make an asymmetric contribution to regulate up-state and delta oscillations.
Keywords: CSD; PV cells; beta oscillation; gamma oscillation; mouse; neocortex; slow oscillation; wavelet analysis.
Figures

Similar articles
-
Parvalbumin and Somatostatin Interneurons Contribute to the Generation of Hippocampal Gamma Oscillations.J Neurosci. 2020 Sep 30;40(40):7668-7687. doi: 10.1523/JNEUROSCI.0261-20.2020. Epub 2020 Aug 28. J Neurosci. 2020. PMID: 32859716 Free PMC article.
-
Postnatal development of GABAergic interneurons in the neocortical subplate of mice.Neuroscience. 2016 May 13;322:78-93. doi: 10.1016/j.neuroscience.2016.02.023. Epub 2016 Feb 15. Neuroscience. 2016. PMID: 26892297
-
Excitatory Inputs Determine Phase-Locking Strength and Spike-Timing of CA1 Stratum Oriens/Alveus Parvalbumin and Somatostatin Interneurons during Intrinsically Generated Hippocampal Theta Rhythm.J Neurosci. 2016 Jun 22;36(25):6605-22. doi: 10.1523/JNEUROSCI.3951-13.2016. J Neurosci. 2016. PMID: 27335395 Free PMC article.
-
A role for GABAergic interneuron diversity in circuit development and plasticity of the neonatal cerebral cortex.Curr Opin Neurobiol. 2017 Apr;43:149-155. doi: 10.1016/j.conb.2017.03.011. Epub 2017 Apr 8. Curr Opin Neurobiol. 2017. PMID: 28399421 Review.
-
Inhibitory circuits in fear memory and fear-related disorders.Front Neural Circuits. 2023 Mar 23;17:1122314. doi: 10.3389/fncir.2023.1122314. eCollection 2023. Front Neural Circuits. 2023. PMID: 37035504 Free PMC article. Review.
Cited by
-
Somatostatin neuron contributions to cortical slow wave dysfunction in adult mice exposed to developmental ethanol.Front Neurosci. 2023 Mar 20;17:1127711. doi: 10.3389/fnins.2023.1127711. eCollection 2023. Front Neurosci. 2023. PMID: 37021136 Free PMC article.
-
Voltage-independent GluN2A-type NMDA receptor Ca2+ signaling promotes audiogenic seizures, attentional and cognitive deficits in mice.Commun Biol. 2021 Jan 8;4(1):59. doi: 10.1038/s42003-020-01538-4. Commun Biol. 2021. PMID: 33420383 Free PMC article.
-
Targeting Gamma-Related Pathophysiology in Autism Spectrum Disorder Using Transcranial Electrical Stimulation: Opportunities and Challenges.Autism Res. 2020 Jul;13(7):1051-1071. doi: 10.1002/aur.2312. Epub 2020 May 28. Autism Res. 2020. PMID: 32468731 Free PMC article.
-
Neural Oscillations in the Somatosensory and Motor Cortex Distinguish Dexmedetomidine-Induced Anesthesia and Sleep in Rats.CNS Neurosci Ther. 2025 Feb;31(2):e70262. doi: 10.1111/cns.70262. CNS Neurosci Ther. 2025. PMID: 39963924 Free PMC article.
-
Phase Coupled Firing of Prefrontal Parvalbumin Interneuron With High Frequency Oscillations.Front Cell Neurosci. 2020 Nov 25;14:610741. doi: 10.3389/fncel.2020.610741. eCollection 2020. Front Cell Neurosci. 2020. PMID: 33324170 Free PMC article.
References
Publication types
MeSH terms
Substances
LinkOut - more resources
Full Text Sources
Other Literature Sources
Molecular Biology Databases