Review
. 2015 Feb 3:9:3.
doi: 10.3389/fnana.2015.00003. eCollection 2015.

Patterns of hypothalamic regionalization in amphibians and reptiles: common traits revealed by a genoarchitectonic approach

Affiliations
Review

Patterns of hypothalamic regionalization in amphibians and reptiles: common traits revealed by a genoarchitectonic approach

Laura Domínguez et al. Front Neuroanat. .

Abstract

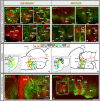
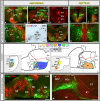
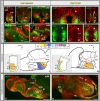
Most studies in mammals and birds have demonstrated common patterns of hypothalamic development highlighted by the combination of developmental regulatory genes (genoarchitecture), supporting the notion of the hypothalamus as a component of the secondary prosencephalon, topologically rostral to the diencephalon. In our comparative analysis we have summarized the data on the expression patterns of different transcription factors and neuroactive substances, used as anatomical markers, in the developing hypothalamus of the amphibian Xenopus laevis and the juvenile turtle Pseudemys scripta. This analysis served to highlight the organization of the hypothalamus in the anamniote/amniotic transition. We have identified supraoptoparaventricular and the suprachiasmatic regions (SCs) in the alar part of the hypothalamus, and tuberal and mammillary regions in the basal hypothalamus. Shared features in the two species are: (1) The supraoptoparaventricular region (SPV) is defined by the expression of Otp and the lack of Nkx2.1/Isl1. It is subdivided into rostral, rich in Otp and Nkx2.2, and caudal, only Otp-positive, portions. (2) The suprachiasmatic area contains catecholaminergic cell groups and lacks Otp, and can be further divided into rostral (rich in Nkx2.1 and Nkx2.2) and a caudal (rich in Isl1 and devoid of Nkx2.1) portions. (3) Expression of Nkx2.1 and Isl1 define the tuberal hypothalamus and only the rostral portion expresses Otp. (4) Its caudal boundary is evident by the lack of Isl1 in the adjacent mammillary region, which expresses Nkx2.1 and Otp. Differences in the anamnio-amniote transition were noted since in the turtle, like in other amniotes, the boundary between the alar hypothalamus and the telencephalic preoptic area shows distinct Nkx2.2 and Otp expressions but not in the amphibian (anamniote), and the alar SPV is defined by the expression of Otp/Pax6, whereas in Xenopus only Otp is expressed.

Keywords: development; evolution; forebrain patterning; hypothalamus; prosencephalon.


Figures
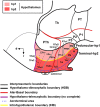
Figure 1
Figure 1
Schematic representation of the mammalian hypothalamic organization according to the prosomeric model. Note that the coordinate system for the hypothalamus rotates 90° because the longitudinal axis of the brain bends in the diencephalon. For abbreviations, see list. (Modified from Puelles et al., and Morales-Delgado et al., 2014).
Figure 2
Figure 2
Comparative aspects of the preoptic-hypothalamic (POH) boundary between amphibians and reptiles. Photomicrographs of transverse sections through the developing preoptic-hypothalamic territory of Xenopus (A–C) and Pseudemys (E–G) illustrating its molecular profile based on the combinatorial expression of different transcription factors and neuropeptides indicated in each photomicrograph. The developmental stage in the cases of Xenopus is also marked. (D) and (H) are summarizing schemes of lateral views of the brains in which the main molecular features of the POH are illustrated according to the color code indicated. In both schemes, a transverse section through the level indicated on the lateral view of the brain is illustrated. Note that the coordinate system for the hypothalamus rotates 90° because the longitudinal axis of the brain bends in the diencephalon, and this is also the case for all photomicrographs of sagittal sections in all figures. For abbreviations, see list. Scale bars = 50 μm (A,B), 100 μm (C,F,G), 200 μm (E).
Figure 3
Figure 3
Comparative aspects of the supraoptoparaventricular (SPV) region between amphibians and reptiles. Photomicrographs of transverse (A,B,E,F,H’,I–M,O’) and sagittal (C,D,H,O) sections through the developing SPV territory of Xenopus (A–H’) and Pseudemys (I–O’) illustrating its molecular profile based on the combinatorial expression of different transcription factors and neuropeptides indicated in each figure. The developmental stage in the cases of Xenopus is also marked. (G) and (N) are summarizing schemes of lateral views of the brains in which the main molecular features of the SPV are illustrated according to the color code indicated. In both schemes, a transverse section through the level indicated on the lateral view of the brain is illustrated. Scale bars = 50 μm (A–F), 100 μm (H’), 200 μm (H,L,O,O’), 500 μm (I–K,M).
Figure 4
Figure 4
Comparative aspects of the suprachiasmatic (SC) territory between amphibians and reptiles. Photomicrographs of transverse (C,F,I–K) and sagittal (A,B,D,E,H,M) sections through the developing SC territory of Xenopus (A–H) and Pseudemys (I–M) illustrating its molecular profile based on the combinatorial expression of different transcription factors and neuropeptides indicated in each figure. The developmental stage in the cases of Xenopus is also marked. (G) and (L) are summarizing schemes of lateral views of the brains in which the main molecular features of the SC region are illustrated according to the color code indicated. In both schemes, a transverse section through the level indicated on the lateral view of the brain is illustrated. Scale bars = 25 μm (D,H), 50 μm (B,C,E,F), 100 μm (A,K), 200 μm (I,J,M).
Figure 5
Figure 5
Comparative aspects of the tuberal (Tub) territory between amphibians and reptiles. Photomicrographs of transverse (A–C,H–L) and sagittal (D,E,G,N) sections through the developing Tub territory of Xenopus (A–G) and Pseudemys (H–N) illustrating its molecular profile based on the combinatorial expression of different transcription factors and neuropeptides indicated in each figure. The developmental stage in the cases of Xenopus is also marked. (F) and (M) are summarizing schemes of lateral views of the brains in which the main molecular features of the Tub region are illustrated according to the color code indicated. In both schemes, a transverse section through the level indicated on the lateral view of the brain is illustrated. Scale bars = 100 μm (A–E,G,J–L,N), 200 μm (H), 500 μm (I).
Figure 6
Figure 6
Comparative aspects of the mammillary (M) territory between amphibians and reptiles. Photomicrographs of transverse (A–F,I,J,L,M,P) and sagittal (H,K,N,Q,Q’) sections through the developing tuberal territory of Xenopus (A–I) and Pseudemys (J–Q’) illustrating its molecular profile based on the combinatorial expression of different transcription factors and neuropeptides indicated in each figure. The developmental stage in the cases of Xenopus is also marked. (G) and (O) are summarizing schemes of lateral views of the brains in which the main molecular features of the M region are illustrated according to the color code indicated. In both schemes, a transverse section through the level indicated on the lateral view of the brain is illustrated. Scale bars = Scale bars: 100 μm (A–F,H,I,K’,M), 200 μm (L,N,P,Q,Q’), 500 μm (J,K).
Figure 7
Figure 7
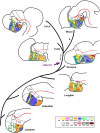
Phylogenetic diagram representing the regionalization of the hypothalamus based on molecular criteria. Representative species of different vertebrate groups are considered, including an agnathan fish (lamprey), a teleost fish (zebrafish), a dipnoi (lunghfish), an anuran amphibian (Xenopus), a reptile (turtle), a bird (chicken), and a mammal (mouse). In all species, the hypothalamus includes comparable molecular compartments, and each compartment shows a tendency to a common organization regarding its molecular expression profile. However, there are some remarkable differences in the expression patterns during evolution, such as the lack of Pax6 expression in the SPV of lamprey, lunghfish and Xenopus; the SC in mammals virtually does not express Shh/Nkx2.1 that are expressed in non mammalian amniotes and in anamniotes; Otp is expressed in the mammillary region of all vertebrates analyzed (no data in the lamprey are available). However, most differences in the scheme are due to the absence of data in the literature. The numbers 1–4 in the scheme represent the main evolutionary events regarding to the hypothalamic organization, as follows: (1) Nkx2.1 expression restriction in SC. (2) POH Nkx2.2 expression. (3) Pax6 expression in SPV for the first time. (4) Pallial and thalamic expansion at the expense of the alar hypothalamic reduction. Note that the developmental stages used in the scheme are not equivalent for all species.
Figure 8
Figure 8
Schematic comparison of the different forces during ontogeny that lead to the different hypothalamic anatomy. In this hypothetic scheme the situation between mammals and non-mammals (mainly based on our results in the development of the amphibian hypothalamus) are represented. Three main forces are supposed to act in a sequential manner and differently in each vertebrate group. The first force (1) to act is the flexure of the neural tube (A). In mammals, the longitunal axis bends almost 90° forming a sharp flexure and the rostral tube is moved to a “ventral” position (B), whereas in non-mammals this angle seems to be less pronounced (C). Then, a second morphological force acts over this longitudinal axis that is already partially bent, which is produced by the telencephalic evagination (2). In the case of mammals this second force acts equally on the caudal (hp1) and rostral (hp2) hypothalamic domains, so its main effect would be the flattening of the hypothalamic territory. However, in the case of non-mammals, the strength caused by the telencephalic evagination would be mainly pushing the rostral (hp2) hypothalamic domain, which helps to turn more “ventrally” the hypothalamus. Finally, a third force is the hypothalamic evagination (3). In mammals this third strength is contributing to the elongation of the hypothalamic territory and, in the case of non-mammals this force is also contributing to pronounced hypothalamic modification.

Similar articles

Cited by

References

    1. Abellán A., Medina L. (2009). Subdivisions and derivatives of the chicken subpallium based on expression of LIM and other regulatory genes and markers of neuron subpopulations during development. J. Comp. Neurol. 515, 465–501. 10.1002/cne.22083 - DOI - PubMed
    1. Abellán A., Vernier B., Rétaux S., Medina L. (2010). Similarities and differences in the forebrain expression of Lhx1 and Lhx5 between chicken and mouse: insights for understanding telencephalic development and evolution. J. Comp. Neurol. 518, 3512–3528. 10.1002/cne.22410 - DOI - PubMed
    1. Acampora D., Postiglione M. P., Avantaggiato V., Di Bonito M., Vaccarino F. M., Michaud J., et al. . (1999). Progressive impairment of developing neuroendocrine cell lineages in the hypothalamus of mice lacking the Orthopedia gene. Genes Dev. 13, 2787–2800. 10.1101/gad.13.21.2787 - DOI - PMC - PubMed
    1. Alunni A., Blin M., Deschet K., Bourrat F., Vernier P., Rétaux S. (2004). Cloning and developmental expression patterns of Dlx2, Lhx7 and Lhx9 in the medaka fish (Oryzias latipes). Mech. Dev. 121, 977–983. 10.1016/j.mod.2004.03.023 - DOI - PubMed
    1. Bachy I., Berthon J., Rétaux S. (2002). Defining pallial and subpallial divisions in the developing Xenopus forebrain. Mech. Dev. 117, 163–172. 10.1016/s0925-4773(02)00199-5 - DOI - PubMed

LinkOut - more resources