. 2015 Feb 3:6:7.
doi: 10.3389/fphys.2015.00007. eCollection 2015.

Ion channelopathies in human induced pluripotent stem cell derived cardiomyocytes: a dynamic clamp study with virtual IK1

Affiliations

Ion channelopathies in human induced pluripotent stem cell derived cardiomyocytes: a dynamic clamp study with virtual IK1

Rosalie M E Meijer van Putten et al. Front Physiol. .

Abstract

Human induced pluripotent stem cell derived cardiomyocytes (hiPSC-CMs) are widely used in studying basic mechanisms of cardiac arrhythmias that are caused by ion channelopathies. Unfortunately, the action potential profile of hiPSC-CMs-and consequently the profile of individual membrane currents active during that action potential-differs substantially from that of native human cardiomyocytes, largely due to almost negligible expression of the inward rectifier potassium current (IK1). In the present study, we attempted to "normalize" the action potential profile of our hiPSC-CMs by inserting a voltage dependent in silico IK1 into our hiPSC-CMs, using the dynamic clamp configuration of the patch clamp technique. Recordings were made from single hiPSC-CMs, using the perforated patch clamp technique at physiological temperature. We assessed three different models of IK1, with different degrees of inward rectification, and systematically varied the magnitude of the inserted IK1. Also, we modified the inserted IK1 in order to assess the effects of loss- and gain-of-function mutations in the KCNJ2 gene, which encodes the Kir2.1 protein that is primarily responsible for the IK1 channel in human ventricle. For our experiments, we selected spontaneously beating hiPSC-CMs, with negligible IK1 as demonstrated in separate voltage clamp experiments, which were paced at 1 Hz. Upon addition of in silico IK1 with a peak outward density of 4-6 pA/pF, these hiPSC-CMs showed a ventricular-like action potential morphology with a stable resting membrane potential near -80 mV and a maximum upstroke velocity >150 V/s (n = 9). Proarrhythmic action potential changes were observed upon injection of both loss-of-function and gain-of-function IK1, as associated with Andersen-Tawil syndrome type 1 and short QT syndrome type 3, respectively (n = 6). We conclude that injection of in silico IK1 makes the hiPSC-CM a more reliable model for investigating mechanisms underlying cardiac arrhythmias.

Keywords: Andersen–Tawil syndrome; KCNJ2 gene; Kir2.1 protein; action potentials; cardiac ion channelopathies; inward rectifier potassium channel; patch clamp; short QT syndrome 3.


Figures

Figure 1
Figure 1
Diagram of the experimental setup. The membrane potential (Vm) of a single human induced pluripotent stem cell derived cardiomyocyte (hiPSC-CM) is recorded using the perforated patch clamp technique in current clamp mode. The injected current (Iin) is the sum of a stimulus current (Istim) and a virtual inward rectifier potassium current (IK1), which is computed in real time, based on the recorded value of Vm (dynamic clamp). The stimulus protocol is run on an Apple Macintosh G4 computer (left), whereas a Real-Time Linux (RT-Linux) based PC is used for the continuous computation of IK1 (right). Sample rates are 4 and 25 kHz, respectively (Δt1 = 0.25 ms and Δt2 = 40 μs).
Figure 2
Figure 2
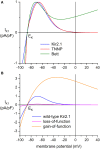
Current-voltage relationship of inward rectifier potassium current (IK1) added to human induced pluripotent stem cell derived cardiomyocytes (hiPSC-CMs) through dynamic clamp. (A) IK1 based on data from Kir2.1 channels expressed in HEK-293 cells by Dhamoon et al. (2004) (“Kir2.1,” blue line), IK1 from the human ventricular cell model by ten Tusscher et al. (2004) (“TNNP,” red line), and the synthetic IK1 used by Bett et al. (2013) (“Bett,” green line). Peak outward amplitude scaled to 1 pA/pF. (B) Current-voltage relationships for loss-of-function and gain-of-function mutations in Kir2.1, encoded by the KCNJ2 gene. The orange line (“gain-of-function”) represents the heterozygous E299V mutation in KCNJ2 studied by Deo et al. (2013), whereas the magenta line (“loss-of-function”) represents a dominant-negative mutation resulting in a decrease in amplitude to 10% of the wild-type Kir2.1 current of panel (A) (blue line). Note difference in ordinate scale between panels (A) and (B).
Figure 3
Figure 3
Morphological and electrophysiological phenotype of human induced pluripotent stem cell derived cardiomyocytes (hiPSC-CMs) and native human ventricular myocytes (VMs). (A) Phase-contrast micrographs of a typical human VM (left) and four hiPSC-CMs (right). Differently shaped hiPSC-CMs were present at close distance in the same microscope field. (B) Action potentials of three different spontaneously active hiPSC-CMs. (C) Action potentials of three different intrinsically quiescent hiPSC-CMs upon 1 Hz stimulation (solid lines) and a typical action potential of a single human VM isolated from a failing heart upon 1 Hz stimulation (dashed line). (D) Maximum diastolic potential (MDP), maximum upstroke velocity [(dV/dt)max], action potential amplitude (APA) and action potential duration at 90% repolarization (APD90) of 9 hiPSC-CMs (left bars) and 9 human VMs (right bars), all stimulated at 1 Hz. Human VMs were isolated from explanted hearts of male patients in end-stage heart failure (Verkerk et al., 2005), *P < 0.05.
Figure 4
Figure 4
Amplitude of inward rectifier potassium current (IK1) in mammalian ventricular myocytes and human induced pluripotent stem cell derived cardiomyocytes (hiPSC-CMs). (A) Amplitude of IK1 at a membrane potential of −100 mV. Note axis break. (B) Amplitude of peak outward IK1. Inset illustrates current-voltage relationship of IK1 with values shown in panels A and B. Data are mean ± SEM obtained at room temperature (bars labeled “RT”) or at physiological or close-to-physiological temperature. If data are available, numbers in gray above bars in (B) indicate the membrane potential (in mV) at which the peak outward amplitude is reached, whereas dark blue triangles indicate the approximate amplitude at 0 mV. Some data are estimated from graphs.
Figure 5
Figure 5
Effect of Kir2.1-based IK1 on the action potential of hiPSC-CMs. (A) Action potential of a hiPSC-CM upon injection of simulated IK1, which is computed in real time according to the “Kir2.1” current-voltage relationship of Figure 2A with its peak outward amplitude scaled to 0–10 pA/pF, as indicated. (B) Corresponding dynamic clamp current injected into the cell. The sharp peak at time 25 ms is due to the stimulus current of 3 ms duration and 600 pA amplitude. (C–F) Maximum diastolic potential (MDP), maximum upstroke velocity [(dV/dt)max], action potential amplitude (APA) and action potential duration at 90% repolarization (APD90) of 9 hiPSC-CMs at IK1 peak outward amplitudes of 0–10 pA/pF, *P < 0.05.
Figure 6
Figure 6
Effect of TNNP-based IK1 on the action potential of hiPSC-CMs. (A) Action potential of a hiPSC-CM upon injection of simulated IK1, which is computed in real time according to the “TNNP” current-voltage relationship of Figure 2A with its peak outward amplitude scaled to 0–10 pA/pF, as indicated. (B) Corresponding dynamic clamp current injected into the cell. The sharp peak at time 25 ms is due to the stimulus current of 3 ms duration and 600 pA amplitude. (C–F) Maximum diastolic potential (MDP), maximum upstroke velocity [(dV/dt)max], action potential amplitude (APA) and action potential duration at 90% repolarization (APD90) of 9 hiPSC-CMs at IK1 peak outward amplitudes of 0–10 pA/pF, *P < 0.05.
Figure 7
Figure 7
Effect of Bett-based IK1 on the action potential of hiPSC-CMs. (A) Action potential of a hiPSC-CM upon injection of simulated IK1, which is computed in real time according to the “Bett” current-voltage relationship of Figure 2A with its peak outward amplitude scaled to 0–10 pA/pF, as indicated. (B) Corresponding dynamic clamp current injected into the cell. The sharp peak at time 25 ms is due to the stimulus current of 3 ms duration and 600 pA amplitude. (C–F) Maximum diastolic potential (MDP), maximum upstroke velocity [(dV/dt)max], action potential amplitude (APA) and action potential duration at 90% repolarization (APD90) of 9 hiPSC-CMs at IK1 peak outward amplitudes of 0–10 pA/pF, *P < 0.05.
Figure 8
Figure 8
Dynamic clamp with different IK1 models. (A) Control action potential of a hiPSC-CM (black trace) and action potential of this cell upon injection of IK1 computed in real time according to the “Kir2.1,” “TNNP,” or “Bett” IK1 models of Figure 2A (blue, red, and green lines, respectively), all with a peak outward amplitude of 6 pA/pF. (B) Corresponding dynamic clamp current injected into the cell. The sharp peak at time 25 ms is due to the stimulus current of 3 ms duration and 600 pA amplitude. (C–F) Comparison of maximum diastolic potential (MDP), maximum upstroke velocity [(dV/dt)max], action potential amplitude (APA) and action potential duration at 90% repolarization (APD90) of 9 hiPSC-CMs obtained with each of the three IK1 models. Asterisks indicate statistically significant differences between IK1 models at each of the applied IK1 peak outward amplitudes.
Figure 9
Figure 9
Effect of in silico mutations in Kir2.1 assessed with dynamic clamp. (A) Control action potential of a hiPSC-CM (black trace) and action potential of this cell upon injection of IK1 computed in real time according to the “wild-type Kir2.1,” “loss-of-function,” or “gain-of-function” IK1 models of Figure 2B (blue, magenta, and orange lines, respectively), all scaled by a factor of 6, thus producing a wild-type IK1 peak outward amplitude of 6 pA/pF. (B) Corresponding dynamic clamp current injected into the cell. The sharp peak at time 25 ms is due to the stimulus current of 3 ms duration and 600 pA amplitude. (C–F) Comparison of maximum diastolic potential (MDP), maximum upstroke velocity [(dV/dt)max], action potential amplitude (APA) and action potential duration at 90% repolarization (APD90) of 6 hiPSC-CMs obtained with each of the three IK1 models. Asterisks indicate statistically significant differences between IK1 models at each of the applied wild-type IK1 peak outward amplitudes.

Similar articles

Cited by

References

    1. Ambrosini E., Sicca F., Brignone M. S., D'Adamo M. C., Napolitano C., Servettini I., et al. . (2014). Genetically induced dysfunctions of Kir2.1 channels: implications for short QT3 syndrome and autism-epilepsy phenotype. Hum. Mol. Genet. 23, 4875–4886. 10.1093/hmg/ddu201 - DOI - PMC - PubMed
    1. Antoni H., Oberdisse E. (1965). Elektrophysiologische Untersuchungen über die Barium-induzierte Schrittmacher-Aktivität im isolierten Säugetiermyokard. Pflügers Arch. 284, 259–272 10.1007/BF00362446 - DOI - PubMed
    1. Aomine M. (1989). Effects of amiodarone on barium-induced automatic activity in guinea pig ventricular muscle. Gen. Pharmacol. 20, 35–37. 10.1016/0306-3623(89)90057-8 - DOI - PubMed
    1. Bailly P., Mouchonière M., Bénitah J. P., Camilleri L., Vassort G., Lorente P. (1998). Extracellular K+ dependence of inward rectification kinetics in human left ventricular cardiomyocytes. Circulation 98, 2753–2759. 10.1161/01.CIR.98.24.2753 - DOI - PubMed
    1. Banyasz T., Horvath B., Jian Z., Izu L. T., Chen-Izu Y. (2011). Sequential dissection of multiple ionic currents in single cardiac myocytes under action potential-clamp. J. Mol. Cell. Cardiol. 50, 578–581. 10.1016/j.yjmcc.2010.12.020 - DOI - PMC - PubMed

LinkOut - more resources