

On better estimating and normalizing the relationship between clinical parameters: comparing respiratory modulations in the photoplethysmogram and blood pressure signal (DPOP versus PPV)
- PMID: 25691912
- PMCID: PMC4322304
- DOI: 10.1155/2015/576340
On better estimating and normalizing the relationship between clinical parameters: comparing respiratory modulations in the photoplethysmogram and blood pressure signal (DPOP versus PPV)
Abstract
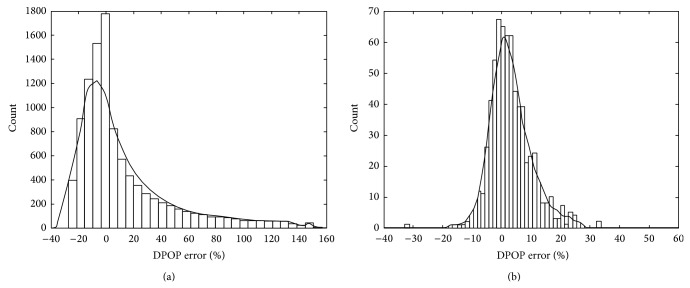
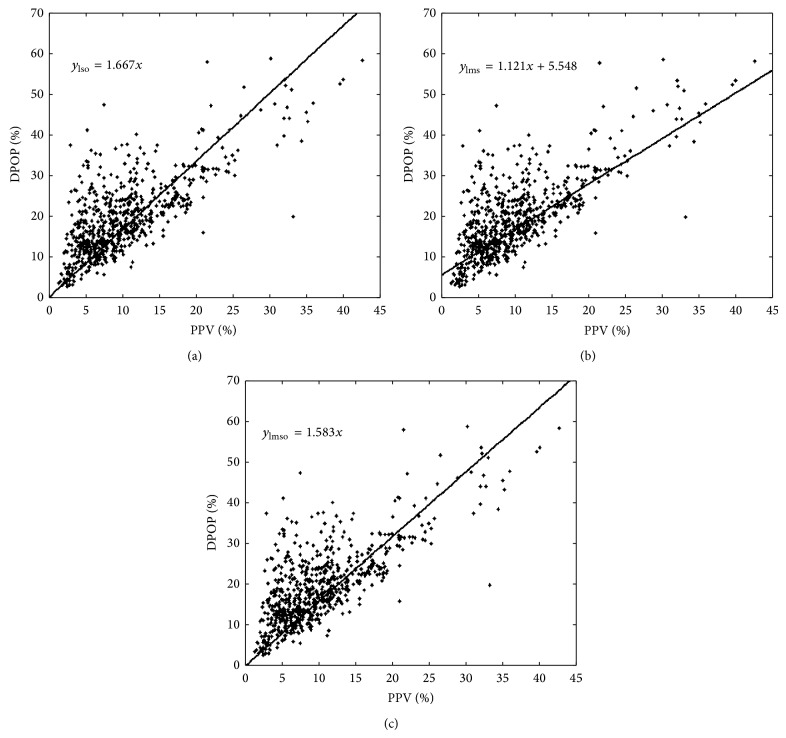
DPOP (ΔPOP or Delta-POP) is a noninvasive parameter which measures the strength of respiratory modulations present in the pulse oximeter waveform. It has been proposed as a noninvasive alternative to pulse pressure variation (PPV) used in the prediction of the response to volume expansion in hypovolemic patients. We considered a number of simple techniques for better determining the underlying relationship between the two parameters. It was shown numerically that baseline-induced signal errors were asymmetric in nature, which corresponded to observation, and we proposed a method which combines a least-median-of-squares estimator with the requirement that the relationship passes through the origin (the LMSO method). We further developed a method of normalization of the parameters through rescaling DPOP using the inverse gradient of the linear fitted relationship. We propose that this normalization method (LMSO-N) is applicable to the matching of a wide range of clinical parameters. It is also generally applicable to the self-normalizing of parameters whose behaviour may change slightly due to algorithmic improvements.
Figures


Similar articles
-
Respiratory modulations in the photoplethysmogram (DPOP) as a measure of respiratory effort.J Clin Monit Comput. 2016 Oct;30(5):595-602. doi: 10.1007/s10877-015-9763-y. Epub 2015 Sep 16. J Clin Monit Comput. 2016. PMID: 26377021 Free PMC article.
-
Increasing signal processing sophistication in the calculation of the respiratory modulation of the photoplethysmogram (DPOP).J Clin Monit Comput. 2015 Jun;29(3):363-72. doi: 10.1007/s10877-014-9613-3. Epub 2014 Sep 11. J Clin Monit Comput. 2015. PMID: 25209132 Free PMC article.
-
A review of signal processing used in the implementation of the pulse oximetry photoplethysmographic fluid responsiveness parameter.Anesth Analg. 2014 Dec;119(6):1293-306. doi: 10.1213/ANE.0000000000000392. Anesth Analg. 2014. PMID: 25405691 Review.
-
Respiratory variations in pulse pressure and photoplethysmographic waveform amplitude during positive expiratory pressure and continuous positive airway pressure in a model of progressive hypovolemia.PLoS One. 2019 Sep 27;14(9):e0223071. doi: 10.1371/journal.pone.0223071. eCollection 2019. PLoS One. 2019. PMID: 31560715 Free PMC article. Clinical Trial.
-
Noninvasive monitoring by photoplethysmography.Clin Perinatol. 2012 Sep;39(3):573-83. doi: 10.1016/j.clp.2012.06.012. Clin Perinatol. 2012. PMID: 22954270 Review.
Cited by
-
Respiratory variations in the photoplethysmographic waveform amplitude depend on type of pulse oximetry device.J Clin Monit Comput. 2016 Jun;30(3):317-25. doi: 10.1007/s10877-015-9720-9. Epub 2015 Jun 12. J Clin Monit Comput. 2016. PMID: 26067403
References
-
- Michard F., Boussat S., Chemla D., et al. Relation between respiratory changes in arterial pulse pressure and fluid responsiveness in septic patients with acute circulatory failure. The American Journal of Respiratory and Critical Care Medicine. 2000;162(1):134–138. doi: 10.1164/ajrccm.162.1.9903035. - DOI - PubMed
MeSH terms
LinkOut - more resources
Full Text Sources
Other Literature Sources
