

An investigation of gene-gene interactions in dose-response studies with Bayesian nonparametrics
- PMID: 25691918
- PMCID: PMC4330980
- DOI: 10.1186/s13040-015-0039-3
An investigation of gene-gene interactions in dose-response studies with Bayesian nonparametrics
Abstract
Background: Best practice for statistical methodology in cell-based dose-response studies has yet to be established. We examine the ability of MANOVA to detect trait-associated genetic loci in the presence of gene-gene interactions. We present a novel Bayesian nonparametric method designed to detect such interactions.
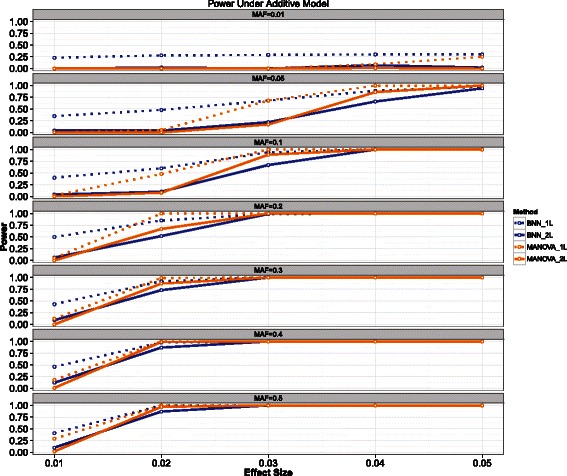
Results: MANOVA and the Bayesian nonparametric approach show good ability to detect trait-associated genetic variants under various possible genetic models. It is shown through several sets of analyses that this may be due to marginal effects being present, even if the underlying genetic model does not explicitly contain them.
Conclusions: Understanding how genetic interactions affect drug response continues to be a critical goal. MANOVA and the novel Bayesian framework present a trade-off between computational complexity and model flexibility.
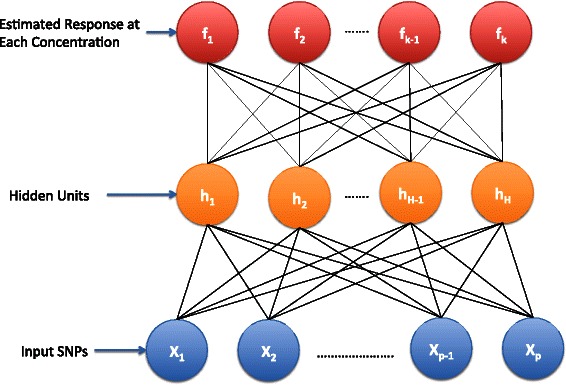
Keywords: Bayesian nonparametric; Dose-response; Epistasis; Machine learning; Neural network.
Figures


Similar articles
-
Coherent psychometric modelling with Bayesian nonparametrics.Br J Math Stat Psychol. 2009 Feb;62(Pt 1):1-20. doi: 10.1348/000711007X246237. Epub 2007 Sep 27. Br J Math Stat Psychol. 2009. PMID: 17903345
-
Rediscovery of Good-Turing estimators via Bayesian nonparametrics.Biometrics. 2016 Mar;72(1):136-45. doi: 10.1111/biom.12366. Epub 2015 Jul 29. Biometrics. 2016. PMID: 26224325
-
How powerful are summary-based methods for identifying expression-trait associations under different genetic architectures?Pac Symp Biocomput. 2018;23:228-239. Pac Symp Biocomput. 2018. PMID: 29218884 Free PMC article.
-
Bayesian neural networks for detecting epistasis in genetic association studies.BMC Bioinformatics. 2014 Nov 21;15(1):368. doi: 10.1186/s12859-014-0368-0. BMC Bioinformatics. 2014. PMID: 25413600 Free PMC article.
-
The role of pleiotropy vs signaller-receiver gene epistasis in life history trade-offs: dissecting the genomic architecture of organismal design in social systems.Heredity (Edinb). 2008 Sep;101(3):197-211. doi: 10.1038/hdy.2008.64. Heredity (Edinb). 2008. PMID: 18685573 Review.
References
-
- Brown CC, Havener TM, Medina MW, Auman JT, Mangravite LM, Krauss RM, et al. A genome-wide association analysis of temozolomide response using lymphoblastoid cell lines reveals a clinically relevant association with mgmt. Pharmacogenetics Genomics. 2012;22(11):796. doi: 10.1097/FPC.0b013e3283589c50. - DOI - PMC - PubMed
Grants and funding
LinkOut - more resources
Full Text Sources
Other Literature Sources
