. 2015 Feb;5(3):807-20.
doi: 10.1002/ece3.1405. Epub 2015 Jan 21.

Limited sampling hampers "big data" estimation of species richness in a tropical biodiversity hotspot

Affiliations

Limited sampling hampers "big data" estimation of species richness in a tropical biodiversity hotspot

Kristine Engemann et al. Ecol Evol. 2015 Feb.

Abstract

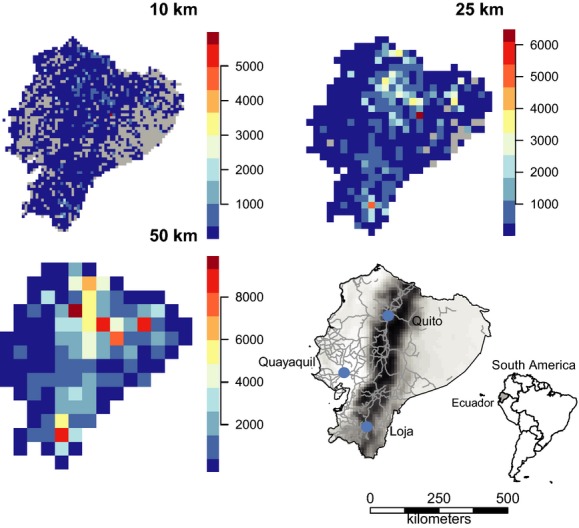
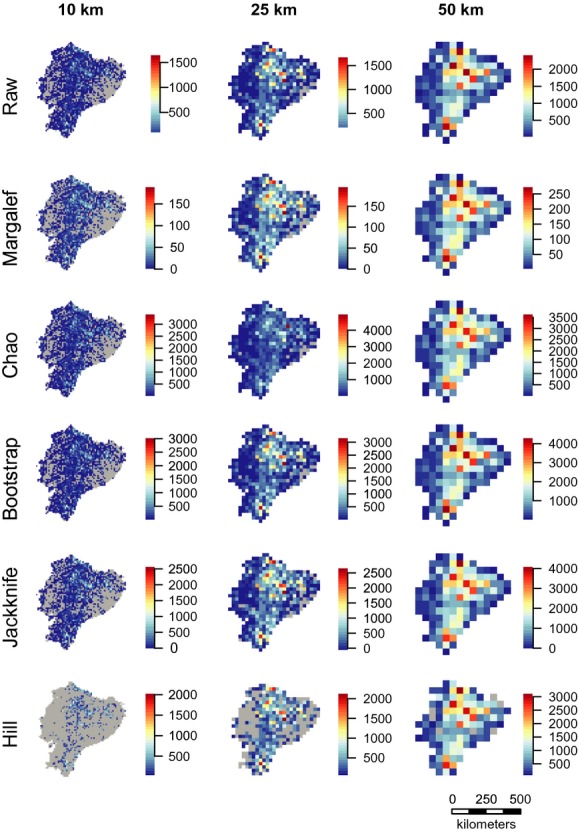
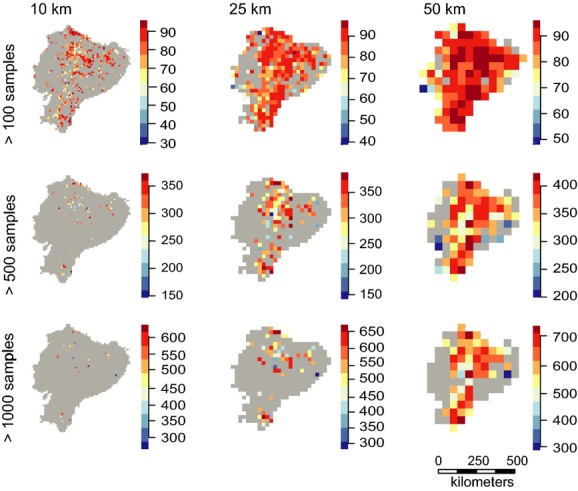
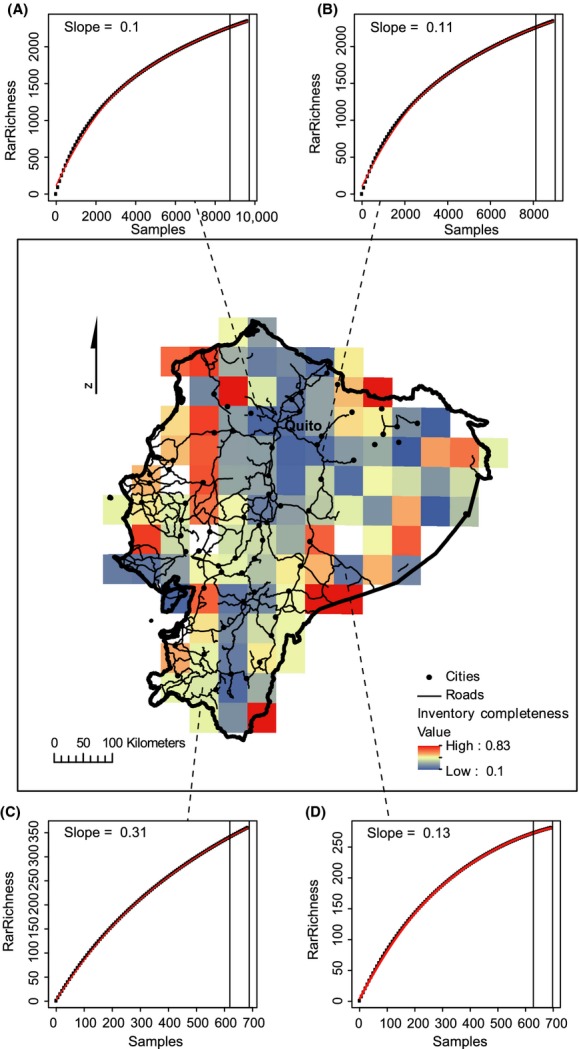
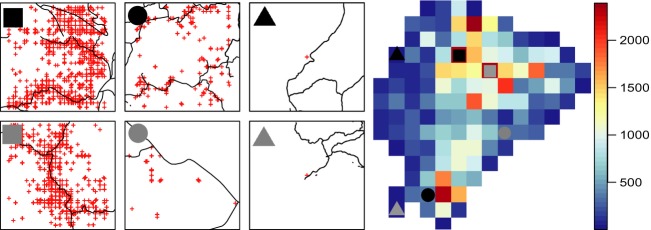
Macro-scale species richness studies often use museum specimens as their main source of information. However, such datasets are often strongly biased due to variation in sampling effort in space and time. These biases may strongly affect diversity estimates and may, thereby, obstruct solid inference on the underlying diversity drivers, as well as mislead conservation prioritization. In recent years, this has resulted in an increased focus on developing methods to correct for sampling bias. In this study, we use sample-size-correcting methods to examine patterns of tropical plant diversity in Ecuador, one of the most species-rich and climatically heterogeneous biodiversity hotspots. Species richness estimates were calculated based on 205,735 georeferenced specimens of 15,788 species using the Margalef diversity index, the Chao estimator, the second-order Jackknife and Bootstrapping resampling methods, and Hill numbers and rarefaction. Species richness was heavily correlated with sampling effort, and only rarefaction was able to remove this effect, and we recommend this method for estimation of species richness with "big data" collections.

Keywords: Ecuador; rarefaction; resampling; richness estimation; sampling effort.


Figures

Figure 1
Figure 1
Sampling intensity across Ecuador at three different scales. Sampling intensity was calculated as the number of point observations within a grid cell. Gray cells lack any observations. Species observations were projected to the Lambert Azimuthal equal-area projection before being rasterized to avoid any effect of area on species richness estimates. Also shown is Ecuador with major roads and the cities with major herbariums. The road and cities layer was downloaded from the Global Administrative Areas database (21 November 2013, http://www.gadm.org).
Figure 2
Figure 2
Six measures of species richness at 10-, 25-, and 50-km grid cells. Species richness was calculated as the raw number of species within a grid cell, estimated with the Margalef diversity index, the Chao estimator, the bootstrapping and jackknife resampling methods, and combined rarefaction and extrapolation with Hill numbers (see Materials and Methods for details). Gray indicates cells lacking observations. Projection: Lambert azimuthal equal-area.
Figure 3
Figure 3
Rarefied species richness at 10-, 25-, and 50-km grid cells. Species richness was calculated as the raw number of species within a grid cell, estimated with the criterion of >100, >500, and >1000 observations per cell at each scale (see Materials and Methods for details). Gray shows cells lacking observations. Species observations were projected to the Lambert Azimuthal equal-area projection before being rasterized to avoid any effect of area on species richness estimates.
Figure 4
Figure 4
Inventory completeness across Ecuador. Inventory completeness was calculated as the slope of the last 10% of species accumulation curves for grid cells with at least 100 samples at the 50-km grid scale. A slope >0.05 indicates insufficient sampling which is evident for all cells. (A–D) show species accumulation curves for four select cells with (A) and (B) being the cells with the highest number of samples and (C) and (D) being the cells with the number of samples closet to the median. Projection: Lambert azimuthal equal-area.
Figure 5
Figure 5
Position of georeferenced specimens in relation to roads within selected 50-km grid cells. The six chosen cells represent the two cells with the highest, closest to the median, and lowest number of samples, respectively. Also shown is a raster map of Ecuador displaying the number of species per grid as well as the position of the selected grid cells (marked by the matching circles, squares, and triangles). Projection: Lambert azimuthal equal-area.

References

    1. Balslev H. Distribution patterns of Ecuadorean plant species. Taxon. 1988;37:567–577.
    1. Bass MS, Finer M, Jenkins CN, Kreft H, Cisneros-Heredia DF, McCracken SF, et al. Global conservation significance of Ecuador’s Yasuní National Park. PLoS ONE. 2010;5:e8767. - PMC - PubMed
    1. Bebber DP, Carine MA, Davidse G, Harris DJ, Haston EM, Penn MG, et al. Big hitting collectors make massive and disproportionate contribution to the discovery of plant species. Proc. R. Soc. B Biol. Sci. 2012;279:2269–2274. - PMC - PubMed
    1. Beck J, Ballesteros-Mejia L, Buchmann CM, Dengler J, Fritz SA, Gruber B, et al. What’s on the horizon for macroecology? Ecography. 2012;35:673–683.
    1. BIEN. 2013. . Available at http://bien.nceas.ucsb.edu/bien/ (accessed May 30, 2013)

LinkOut - more resources