High-efficiency type II cell-enhanced green fluorescent protein expression facilitates cellular identification, tracking, and isolation
- PMID: 25692334
- PMCID: PMC4566114
- DOI: 10.1165/rcmb.2014-0348MA
High-efficiency type II cell-enhanced green fluorescent protein expression facilitates cellular identification, tracking, and isolation
Abstract
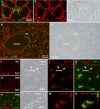
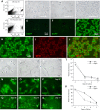
We have developed a transgenic mouse expressing enhanced green fluorescent protein (EGFP) in virtually all type II (TII) alveolar epithelial cells. The CBG mouse (SPC-BAC-EGFP) contains a bacterial artificial chromosome modified to express EGFP within the mouse surfactant protein (SP)-C gene 3' untranslated region. EGFP mRNA expression is limited to the lung. EGFP fluorescence is both limited to and exhibited by all cells expressing pro-SP-C; fluorescence is uniform throughout all lobes of the lung and does not change as mice age. EGFP(+) cells also express SP-B but do not express podoplanin, a type I (TI) cell marker. CBG mice show no evidence of lung disease with aging. In 3 hours, TII cells can be isolated in >99% purity from CBG mice by FACS; the yield of 3.7 ± 0.6 × 10(6) cells represents approximately 25 to 60% of the TII cells in the lung. By FACS analysis, approximately 0.9% of TII cells are in mitosis in uninjured lungs; after bleomycin injury, 4.1% are in mitosis. Because EGFP fluorescence can be detected for >14 days in culture, at a time that SP-C mRNA expression is essentially nil, this line may be useful for tracking TII cells in culture and in vivo. When CBG mice are crossed to transgenic mice expressing rat podoplanin, TI and TII cells can be easily simultaneously identified and isolated. When bred to other strains of mice, EGFP expression can be used to identify TII cells without the need for immunostaining for SP-C. These mice should be useful in models of mouse pulmonary disease and in studies of TII cell biology, biochemistry, and genetics.
Keywords: alveolar epithelium; alveolar type II cells; bacterial artificial chromosome; enhanced green fluorescent protein; surfactant protein C.
Figures


Similar articles
-
Cell fate analysis in fetal mouse lung reveals distinct pathways for TI and TII cell development.Am J Physiol Lung Cell Mol Physiol. 2019 Nov 1;317(5):L653-L666. doi: 10.1152/ajplung.00503.2018. Epub 2019 Aug 21. Am J Physiol Lung Cell Mol Physiol. 2019. PMID: 31432712 Free PMC article.
-
Identification and isolation of mouse type II cells on the basis of intrinsic expression of enhanced green fluorescent protein.Am J Physiol Lung Cell Mol Physiol. 2003 Sep;285(3):L691-700. doi: 10.1152/ajplung.00034.2003. Epub 2003 May 9. Am J Physiol Lung Cell Mol Physiol. 2003. PMID: 12740214
-
Surfactant protein-C chromatin-bound green fluorescence protein reporter mice reveal heterogeneity of surfactant protein C-expressing lung cells.Am J Respir Cell Mol Biol. 2013 Mar;48(3):288-98. doi: 10.1165/rcmb.2011-0403OC. Epub 2012 Nov 29. Am J Respir Cell Mol Biol. 2013. PMID: 23204392 Free PMC article.
-
[Regulation of alveolar type II cell proliferation and surfactant gene expression].Nihon Kyobu Shikkan Gakkai Zasshi. 1994 Dec;32 Suppl:73-8. Nihon Kyobu Shikkan Gakkai Zasshi. 1994. PMID: 7602847 Review. Japanese.
-
The a"MAZE"ing world of lung-specific transgenic mice.Am J Respir Cell Mol Biol. 2012 Mar;46(3):269-82. doi: 10.1165/rcmb.2011-0372PS. Epub 2011 Dec 28. Am J Respir Cell Mol Biol. 2012. PMID: 22180870 Free PMC article. Review.
Cited by
-
Cell fate analysis in fetal mouse lung reveals distinct pathways for TI and TII cell development.Am J Physiol Lung Cell Mol Physiol. 2019 Nov 1;317(5):L653-L666. doi: 10.1152/ajplung.00503.2018. Epub 2019 Aug 21. Am J Physiol Lung Cell Mol Physiol. 2019. PMID: 31432712 Free PMC article.
-
Multicolor two-photon imaging of in vivo cellular pathophysiology upon influenza virus infection using the two-photon IMPRESS.Nat Protoc. 2020 Mar;15(3):1041-1065. doi: 10.1038/s41596-019-0275-y. Epub 2020 Jan 29. Nat Protoc. 2020. PMID: 31996843 Free PMC article.
-
Age-dependent alveolar epithelial plasticity orchestrates lung homeostasis and regeneration.Cell Stem Cell. 2021 Oct 7;28(10):1775-1789.e5. doi: 10.1016/j.stem.2021.04.026. Epub 2021 May 10. Cell Stem Cell. 2021. PMID: 33974915 Free PMC article.
-
TRIM72 promotes alveolar epithelial cell membrane repair and ameliorates lung fibrosis.Respir Res. 2020 May 29;21(1):132. doi: 10.1186/s12931-020-01384-2. Respir Res. 2020. PMID: 32471489 Free PMC article.
-
Modeling diverse genetic subtypes of lung adenocarcinoma with a next-generation alveolar type 2 organoid platform.Genes Dev. 2022 Aug 1;36(15-16):936-949. doi: 10.1101/gad.349659.122. Epub 2022 Sep 29. Genes Dev. 2022. PMID: 36175034 Free PMC article.
References
-
- Mercer RR, Russell ML, Roggli VL, Crapo JD. Cell number and distribution in human and rat airways. Am J Respir Cell Mol Biol. 1994;10:613–624. - PubMed
-
- Kalina M, Mason RJ, Shannon JM. Surfactant protein C is expressed in alveolar type II cells but not in C lara cells of rat lung. Am J Respir Cell Mol Biol. 1992;6:594–600. - PubMed
-
- Mulugeta S, Gray JM, Notarfrancesco KL, Gonzales LW, Koval M, Feinstein SI, Ballard PL, Fisher AB, Shuman H. Identification of LBM180, a lamellar body limiting membrane protein of alveolar type II cells, as the ABC transporter protein ABCA3. J Biol Chem. 2002;277:22147–22155. - PubMed
-
- Dobbs LG, Gonzalez R, Williams MC. An improved method for isolating type II cells in high yield and purity. Am Rev Respir Dis. 1986;134:141–145. - PubMed
-
- Dobbs LG, Williams MC, Gonzalez R. Monoclonal antibodies specific to apical surfaces of rat alveolar type I cells bind to surfaces of cultured, but not freshly isolated, type II cells. Biochim Biophys Acta. 1988;970:146–156. - PubMed
Publication types
MeSH terms
Substances
Grants and funding
LinkOut - more resources
Full Text Sources
Molecular Biology Databases
Research Materials
Miscellaneous

