

Review
doi: 10.1021/cr500537t.
Epub 2015 Feb 18.
Design, synthesis, and characterization of graphene-nanoparticle hybrid materials for bioapplications
Affiliations
- PMID: 25692385
- PMCID: PMC5808865
- DOI: 10.1021/cr500537t
Item in Clipboard
Review
Design, synthesis, and characterization of graphene-nanoparticle hybrid materials for bioapplications
Chem Rev.
.
Abstract
Conflict of interest statement
The authors declare no competing financial interest.
Figures
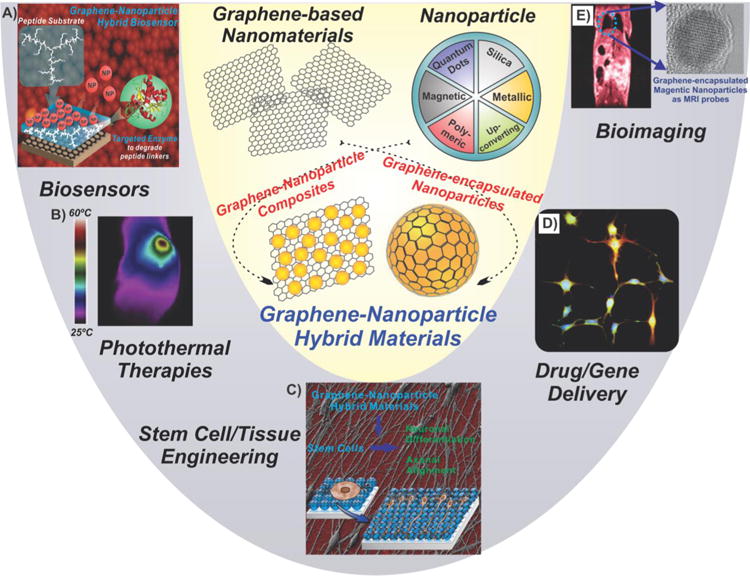
Graphene nanoparticle hybrids exist in two forms, as graphene–nanoparticle composites and graphene-encapsulated nanoparticles, and can be used for various bioapplications including biosensors, photothermal therapies, stem cell/tissue engineering, drug/gene delivery, and bioimaging. Panel (A) reprinted with permission from ref . Copyright 2012 Wiley. Panel (B) reprinted with permission from ref . Copyright 2013 Elsevier. Panel (C) reprinted with permission from ref . Copyright 2013 Wiley.
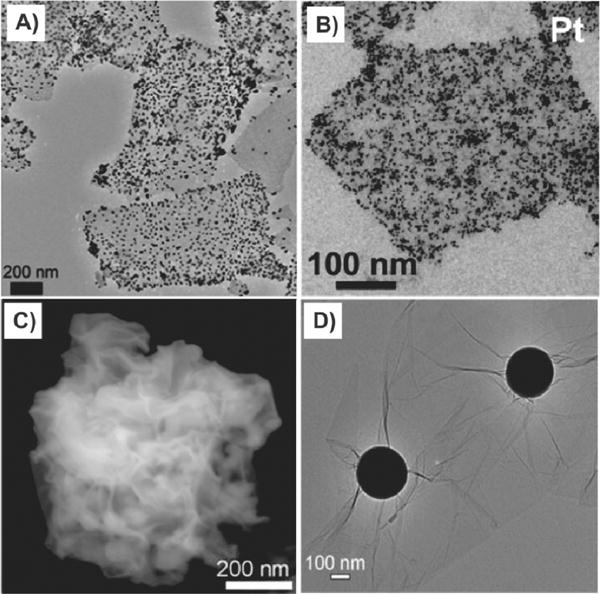
Graphene–nanoparticle hybrid structures. Panels (A) and (B) show graphene-nanoparticle composites wherein nanoparticles are decorated on the surface of graphene sheets. Panel (A) reprinted with permission from ref . Copyright 2011 Elsevier. Panel (B) reprinted with permission from ref . Copyright 2010 American Chemical Society. Panels (C) and (D) show graphene-encapsulated nanoparticles wherein nanoparticles are wrapped by graphene. Panel (C) reprinted with permission from ref . Copyright 2012 American Chemical Society. Panel (D) reprinted with permission from ref . Copyright 2010 Wiley.
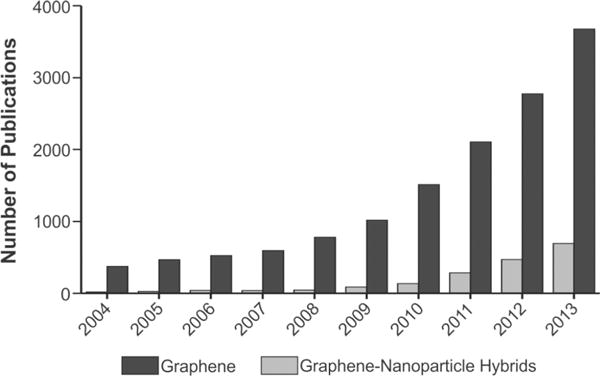
The number of publications utilizing graphene–nanoparticle hybrid materials is increasing (numbers were obtained from PubMed).
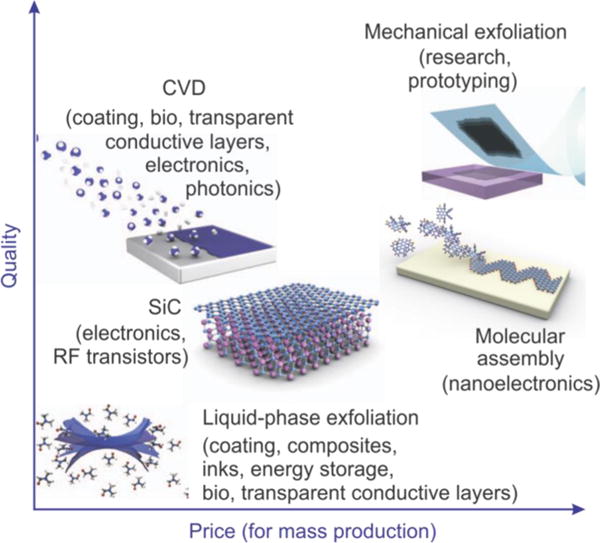
Methods for the mass-production of graphene. There are several choices depending on the particular application, each with differences in terms of size, quality (e.g., presence of defects and impurities), and price. Reprinted with permission from ref . Copyright 2012 Nature.
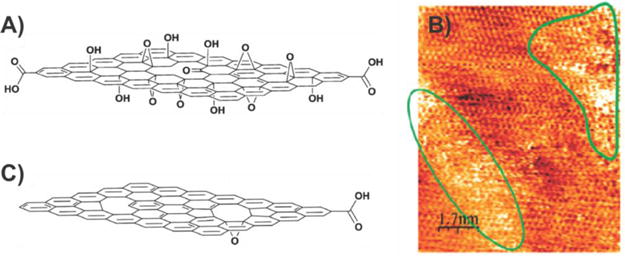
Structure of graphene oxide and reduced graphene oxide. (A) Chemical structure of GO. (B) Scanning tunneling microscope (STM) image of a GO monolayer on a highly oriented pyrolytic graphite substrate. Oxidized regions are marked by green contours. Panel (B) reprinted with permission from ref . Copyright 2007 American Chemical Society. (C) Chemical structure of rGO. Panels (A) and (C) reprinted with permission from ref . Copyright 2010 Wiley.
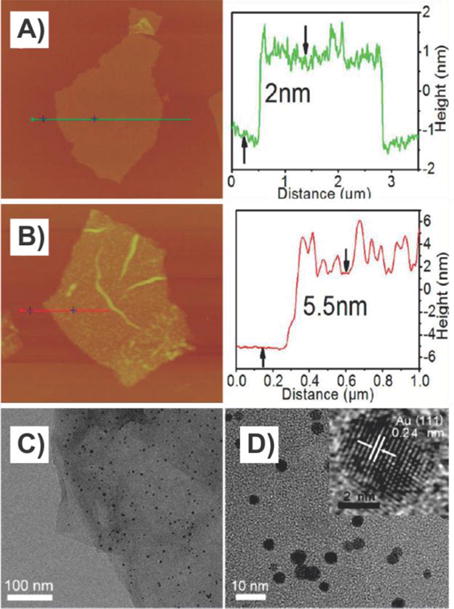
Graphene–nanoparticle composite composed of GO sheets decorated with AuNPs. (A) AFM image of a single GO sheet and (B) a GO sheet decorated with 3.5 nm AuNPs. The corresponding curves on the right side show the thicknesses of the GO sheet and the GO/AuNP sheet. (C and D) TEM images of the GO/AuNP sheet with different magnifications. Inset of (D) shows a high-resolution TEM image of a single AuNP. Reprinted with permission from ref . Copyright 2013 American Chemical Society.
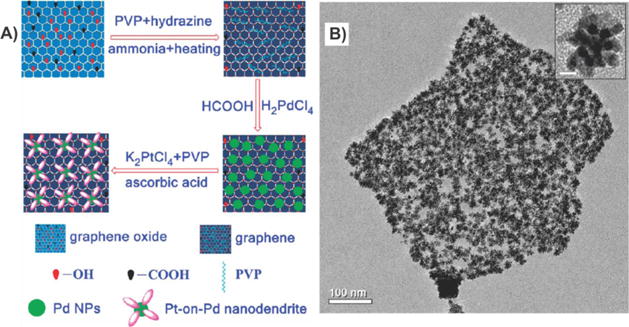
Graphene–bimetallic nanoparticle composites. (A) Procedure to fabricate graphene nanosheet/Pt-on-Pd bimetallic nanodendrite hybrids. (B) TEM images of the graphene–bimetallic nanoparticle composites. Inset of (B) shows the Pt-on-Pd bimetallic nanodendrites at a higher magnification. Reprinted with permission from ref . Copyright 2010 American Chemical Society.
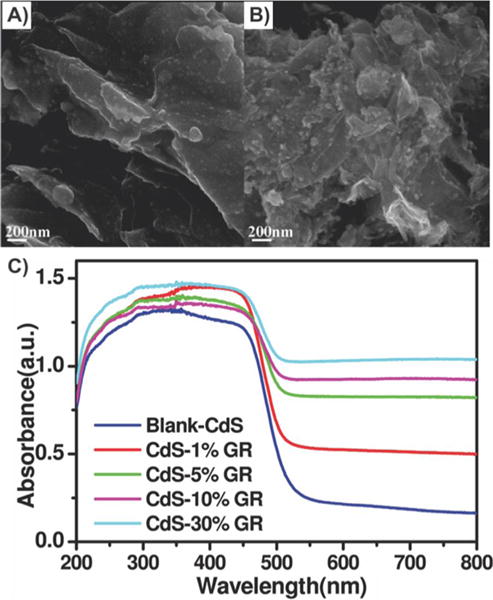
Graphene–quantum dot composites. SEM images of the as-prepared samples of (A) CdS–5% graphene, (B) CdS–30% graphene, and (C) UV–vis diffuse reflectance spectra of the samples of blank-CdS and Cd-GR nanocomposites with different weight addition ratios. Reprinted with permission from ref . Copyright 2011 American Chemical Society.
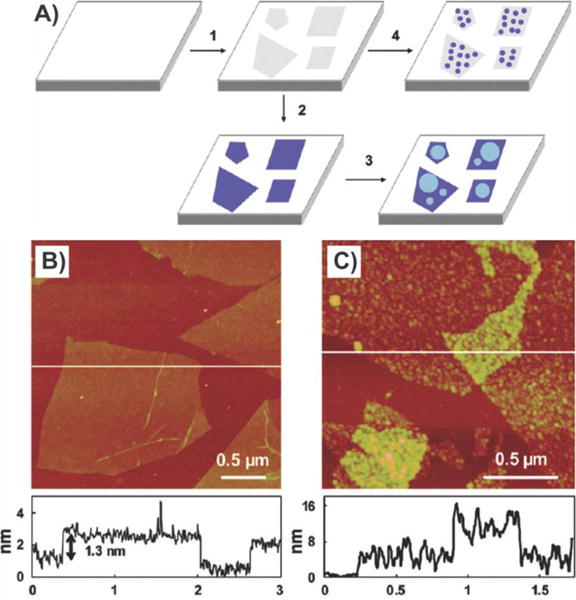
Hydrothermal methods to synthesize graphene–AgNP composites. (A) (1) GO is adsorbed on the APTES-modified SiOx substrate. (2) GO is reduced, and rGO is obtained. (3) Growth of Ag particles by heating the rGO substrate in 0.1 M AgNO3 at 75 °C for 30 min. (4) Growth of AgNPs by heating the GO substrate in 0.1 M AgNO3 at 75 °C for 30 min. (B) Tapping mode AFM topographic image and height profile of a single layer of GO adsorbed on an APTES-modified SiOx substrate. (C) SEM image of Ag particles grown on a rGO surface. Reprinted with permission from ref . Copyright 2009 American Chemical Society.
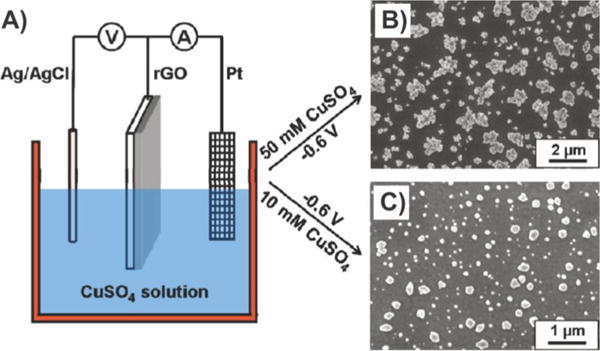
Electrochemical deposition of Cu nanoparticles on rGO. (A) Electrochemical experiments were performed by an electrochemical workstation (CHI600C, CH Instrument Inc., U.S.) in a conventional three-electrode electrochemical cell. The rGO electrode, a Pt mesh, and an Ag/AgCl (3 M NaCl) electrode were used as the working, counter, and reference electrodes, respectively. (B) SEM image of Cu electrodeposited on a rGO electrode in 50 mM CuSO4 solution at −0.6 V. (C) SEM image of Cu electrodeposited on a rGO electrode in 10 mM CuSO4 solution at −0.6 V. Reprinted with permission from ref . Copyright 2011 American Chemical Society.
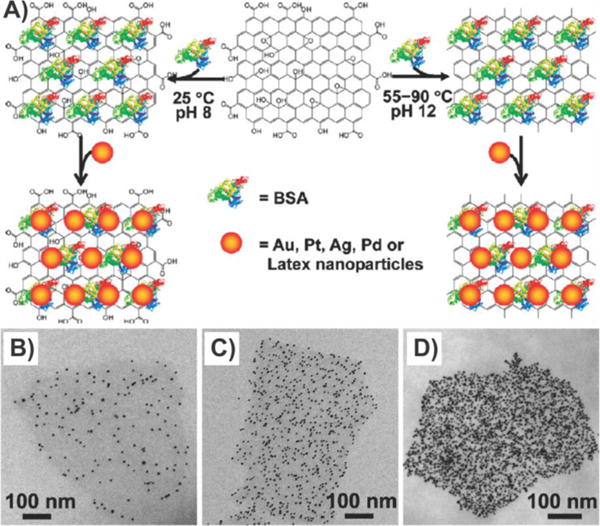
Protein-induced reduction and decoration of GO for the assembly of multiple nanoparticles. (A) General scheme depicting the BSA protein-based decoration and reduction of GO, leading to a general nanoplatform for nanoparticle assembly. (B) TEM images of AuNP decorated BSA–GO with well-controlled densities of AuNPs. (B and C) AuNP densities were varied by increasing the concentrations of BSA from 0.5 mg/mL (B) to 20 mg/mL (C), during the preparation of BSA–GO. NaCl was omitted for the samples in (B) and (C). (D) AuNP density was further increased (in comparison with (C)) by adding 0.1 M NaCl to the assembly system as in (C). Reprinted with permission from ref . Copyright 2010 American Chemical Society.
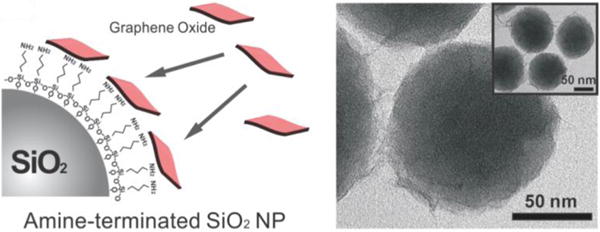
Fabrication process for graphene-coated NPs. Schematic diagram of GO assembly on amine-functionalized NPs and TEM image of NPs coated with GO (inset: zoomed-out TEM image of NPs coated with GO). Reprinted with permission from ref . Copyright 2011 Wiley.
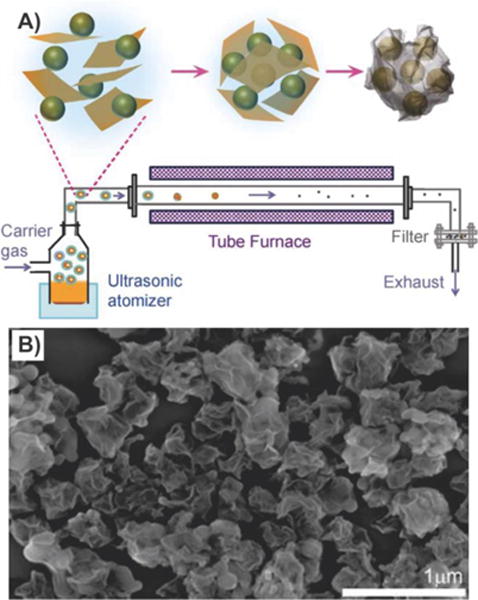
Crumpled graphene-encapsulated Si nanoparticles. (A) Schematic drawing illustrating aerosol-assisted capillary assembly of crumpled-graphene-wrapped Si nanoparticles. Aqueous dispersion of GO and Si particles was nebulized to create a mist of aerosol droplets, which were passed through a preheated tube furnace. During evaporation, GO sheets first migrated to the surface of the droplets and then tightly wrapped the Si particles upon complete evaporation. (B) SEM image showing the crumpled capsules of graphene-wrapped Si. Reprinted with permission from ref . Copyright 2012 American Chemical Society.
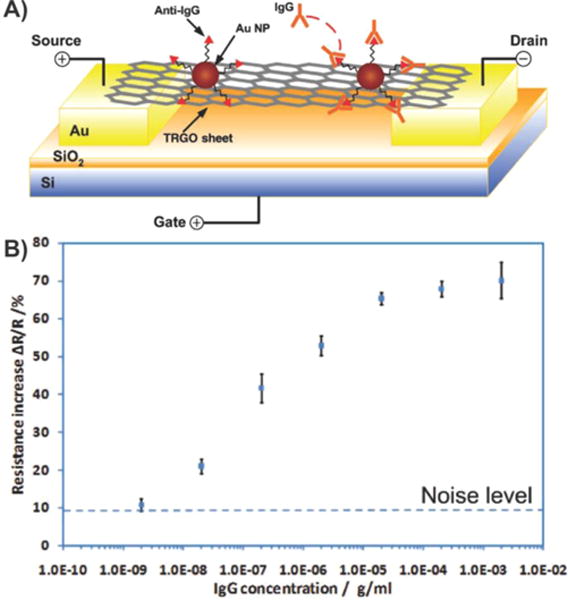
Protein detection using thermally reduced graphene oxide (TRGO) sheets decorated with gold nanoparticle–antibody conjugates. (A) Schematic of a TRGO FET. Anti-IgG is anchored to the TRGO sheet surface through AuNPs and functions as a specific recognition group for IgG binding. The electrical detection of protein binding is accomplished by FET and direct current measurements. (B) Sensor sensitivity (relative resistance change, %) versus IgG concentration. Dashed line represents the noise level from the buffer solution. Reprinted with permission from ref . Copyright 2010 Wiley.
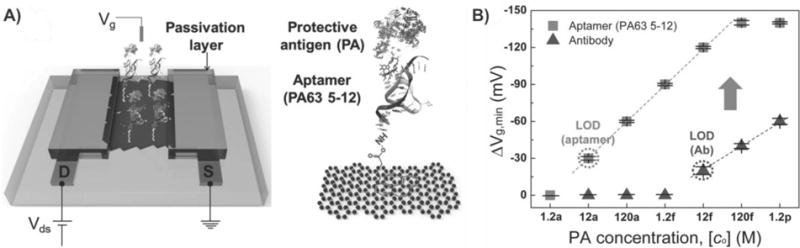
Electronic graphene–nanoparticle composite sensor utilizing aptamers to detect anthrax toxin. (A) Schematic illustration of the aptamer-immobilized graphene FET for detection of protective antigen (PA). (B) Vg,min shift (ΔVg,min) versus PA concentration in PBS solutions with different probe molecules. The ΔVg,min value was obtained by calculating the difference in the charge neutrality point, Vg,min, as a reference for the device with no binding of PA. Reprinted with permission from ref . Copyright 2013 Wiley.
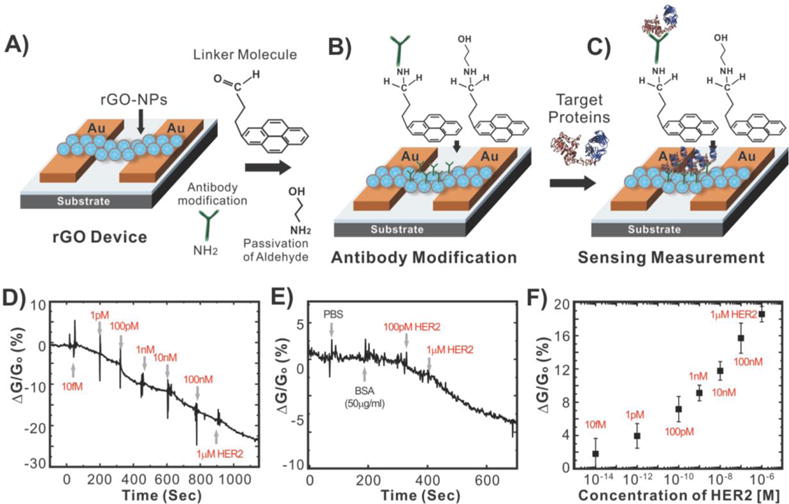
Real-time detection of cancer marker, HER2, using a graphene-encapsulated nanoparticle-based FET biosensor. (A) The preparation of the rGO–NP device. (B) Surface functionalization of rGO for immobilizing the antibody. (C) Measuring conductance of the devices when the target protein is introduced. (D) The sensitivity of the biosensor (relative conductance change, %) in response to the concentration of HER2 with VDS (voltage drain to source) = 1 V and Vg (gate voltage) = 0 V. (E) The selectivity of the biosensor in response to PBS buffer, BSA with 50 μg mL−1, and HER2 (100 pM and 1 μM). (F) Sensor sensitivity (relative conductance change, %) as a function of the HER2 concentration with VDS = 1 V and Vg = 0 V. All experiments were performed multiple times (sample number, n = 30) to collect statistical data (with error bars) and confirm the reproducibility and robustness of the biosensing system. Reprinted with permission from ref . Copyright 2011 Wiley.
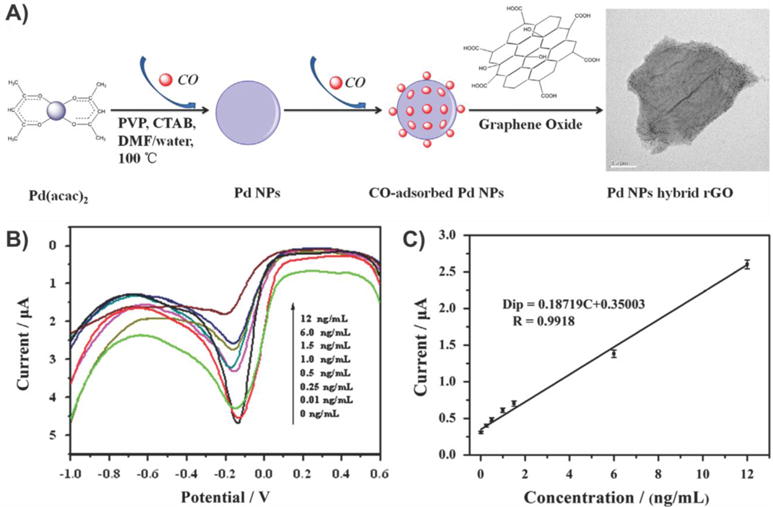
Label-free electrochemical graphene–palladium nanoparticle nanocomposite-based immunosensor for alpha fetoprotein. (A) Schematic illustration for the preparation of Pd nanoparticles conjugated with rGO. (B) Differential pulse voltammetric response for the modified electrode toward different concentrations of AFP in 0.01 M phosphate buffer (pH 7.4); pulse period, 0.2 s; amplitude, 50 mV. (C) Calibration curves of Pd–rGO modified immunosensor to different concentrations of AFP, error bar = relative standard deviation (n = 5). Reprinted with permission from ref . Copyright 2014 Elsevier.
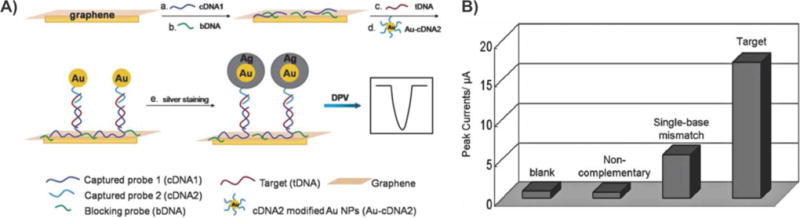
Electrochemical DNA sensor. (A) Schematic diagram. In a typical experiment, captured probe 1 (cDNA1) was adsorbed on the surface of a graphene-modified glassy carbon electrode directly (a), followed by a further adsorption of blocking probe (bDNA) (b). Different target sequences (c) and AuNPs-modified oligonucleotide probes (d) were then cohybridized to the target-active substrates in buffer solution. After silver staining (e) on AuNPs tags as a signal amplification method, a subsequent differential pulse voltammetry (DPV) technique was applied as a detection means for deposited silver. The magnitude of the anodic peak current, which corresponds to the oxidation of silver particles, reflected the amount of complementary target oligonucleotides bound to the GCE-GR/cDNA1 surface. (B) DPV responses of the electrochemical DNA sensor in the blank, noncomplementary sequence, single-base mismatch sequence, and complementary sequence. Electrolyte: 0.1 M KNO3. Pulse amplitude: 50 mV. Pulse period: 0.2 s. Silver staining time: 10 min. Reprinted with permission from ref . Copyright 2011 Royal Society of Chemistry.
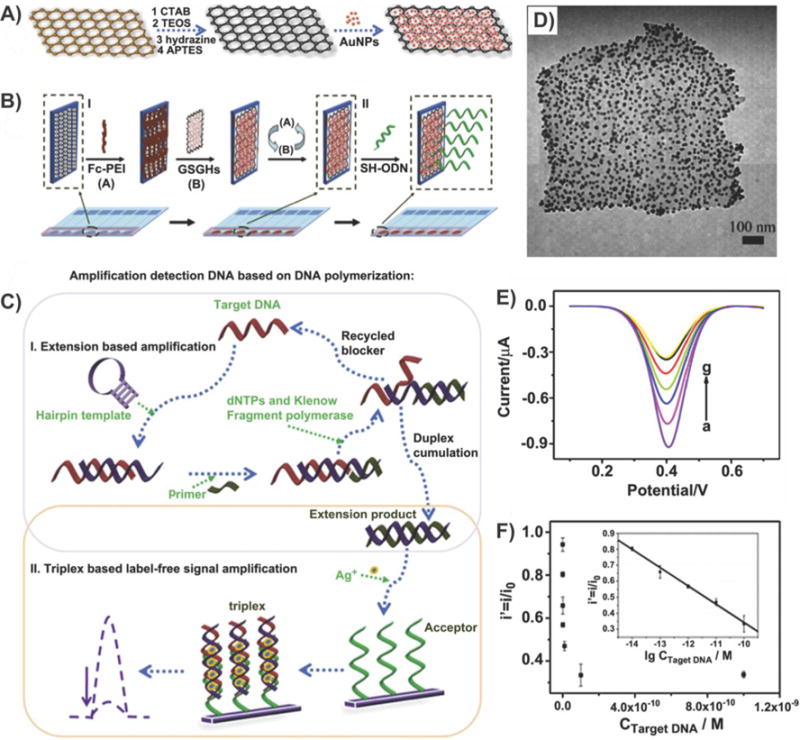
Detection of DNA using a novel parallel-motif DNA triplex system and graphene–mesoporous silica–gold nanoparticle hybrids. (A) Schematic procedure for the synthesis of graphene–mesoporous silica–gold nanosheets. (B) Illustration of the procedure for preparing the electrochemical sensing interface. (C) The procedure of strand-displacement DNA polymerization amplification and parallel-motif DNA triplex amplification. (D) TEM image of graphene–mesoporous silica hybrids. (E) The differential pulse voltammetric response to target DNA with different concentrations: (a) 0 M, (b) 10−14 M, (c) 10−13 M, (d) 10−12 M, (e) 10−11 M, (f) 10−10 M, and (g) 10−9 M. (F) The effect of probe currents on different concentrations of target DNA (from 10−14 to 10−9 M). Inset: A good linear detection range from 10−14 to 10−10 M was obtained. Reprinted with permission from ref . Copyright 2011 Elsevier.
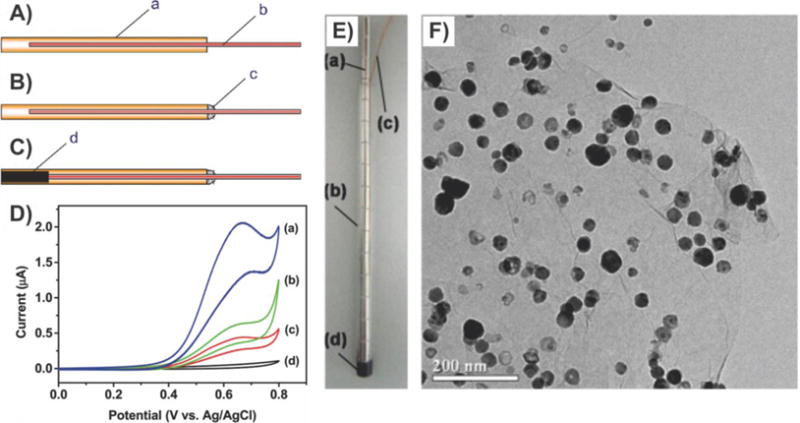
Electrochemical detection of carbohydrates. (A–C) Schematics illustrating the fabrication process of a graphene–copper nanoparticle composite paste electrode. (D) Cyclic voltammograms at (a) a graphene–copper nanoparticle composite paste electrode, (b) a copper nanoparticle paste electrode, (c) a graphite–copper nanoparticle composite paste electrode, and (d) a graphene paste electrode in 75 mM NaOH aqueous solution containing 2 mM glucose. Scan rate, 50 mV/s. The content of paraffin oil in the four pastes was 25% (w/w). Panels (A)–(D) reprinted with permission from ref . Copyright 2012 American Chemical Society. (E) Photograph of a magnetic electrode and (F) TEM image of graphene–NiNP hybrid: (a) NdFeB magnet; (b) glass tube; (c) copper wire; and (d) graphite–epoxy composite. Panels (E) and (F) reprinted with permission from ref . Copyright 2013 Elsevier.
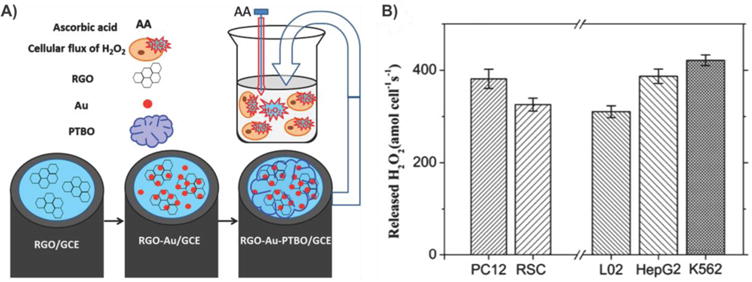
Evaluating oxidative stress in tumor cells. (A) Schematic of the LBL assembly of RGO–Au–PTBO modified GCE used for detecting H2O2 efflux from cells stimulated with AA. (B) Amount of H2O2 released by PC12, RSC, L02, HepG2, and K562 cell lines stimulated by 4 μM AA. The values are expressed as means ± SD of at least three independent measurements. Reprinted with permission from ref . Copyright 2013 Elsevier.
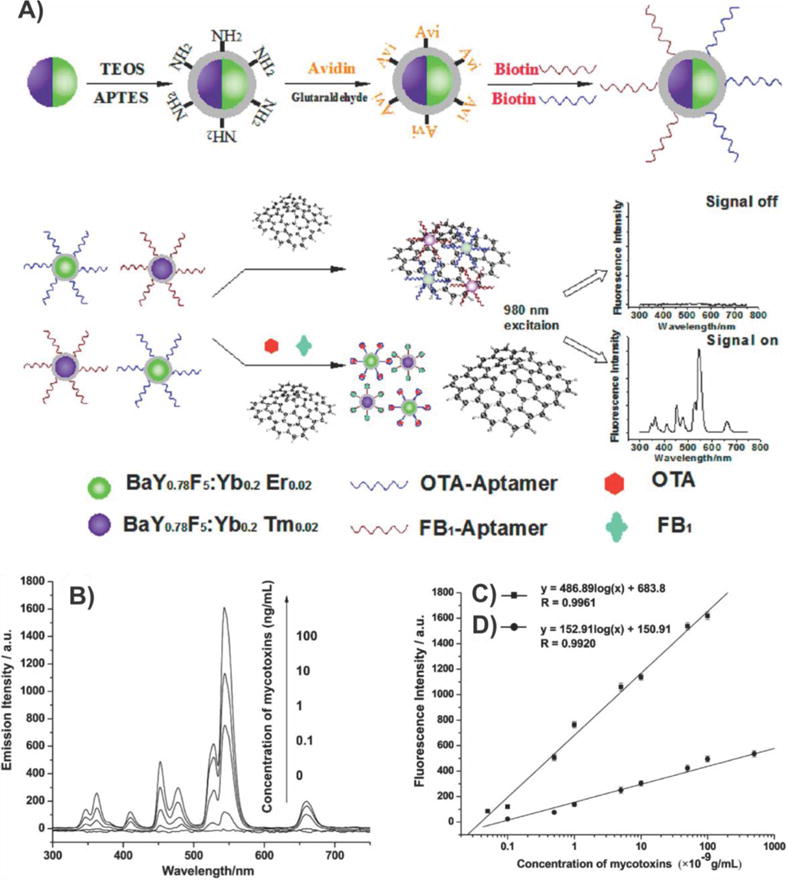
Multiplexed fluorescence resonance energy transfer aptasensor. (A) Schematic illustration of the multiplexed upconversion fluorescence resonance energy transfer between aptamers-UCNPs and GO for FB1 and OTA detection. (B) Upconversion fluorescence spectra of the multiplexed UCNPs-GO FRET aptasensor in the simultaneous presence of 0–100 ng mL−1 FB1 and OTA. (C) A standard curve of the fluorescence intensity versus OTA concentration and (D) FB1 concentrations measured by this developed method. Reprinted with permission from ref . Copyright 2012 American Chemical Society.
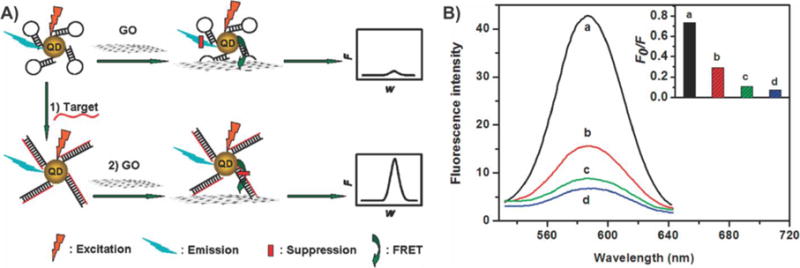
FRET between QDs and GO to sense biomolecules. (A) Schematic representation of GO-induced fluorescence quenching of MB-QDs and biosensing mechanism. (B) Fluorescence emission spectra of MB-QDs (50 nM) after incubation with (a) target (800 nM), (b) single-base mismatch strand (800 nM), (c) three-base mismatch strand (800 nM), and (d) no target and then addition of GO (0.1 μg/mL) for 5 min. Inset: Fluorescence intensity ratio F0/F for four cases. Reprinted with permission from ref . Copyright 2010 American Chemical Society.
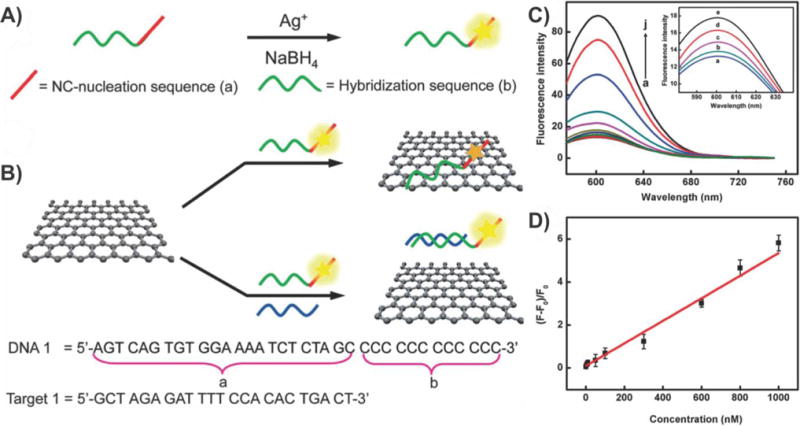
DNA-templated silver nanoclusters–GO hybrids for the detection of multiple nucleic acids. (A) Schematic representation of the preparation of silver nanoclusters on DNA scaffolds in aqueous solution. (B) Schematic illustration of the assay for label-free DNA detection using AgNCs–GO nanohybrid materials. (C) Fluorescence emission spectra of P1 (1 mM) upon addition of T1 with different concentrations: (a) control; (b) 1 nM; (c) 5 nM; (d) 10 nM; (e) 50 nM; (f) 100 nM; (g) 300 nM; (h) 600 nM; (i) 800 nM; and (j) 1000 nM, which was then quenched with GO. Inset: A zoomed-in view of the data for low concentrations of target (a–e). (D) Linear relationship between (F − F0)/F0 (relative fluorescence intensity, where F0 and F are the fluorescence intensities without and with the presence of target DNA, respectively) and the concentration of target DNA (1–1000 nM). Error bars were obtained from three parallel experiments. Reprinted with permission from ref . Copyright 2012 Royal Society of Chemistry.
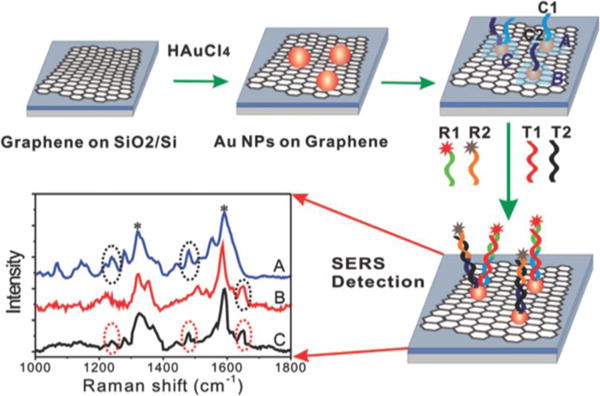
Graphene–AuNP-based SERS platform for multiplex DNA detection. The large-sized graphene films were grown by CVD on copper foils and then transferred onto SiO2/Si substrate. Graphene film was then decorated with AuNPs by immersing it into HAuCl4 solution. The detection of target and multiplex (two targets) DNA by Au-G–SiO2/Si substrate-based SERS sensor. SERS spectra obtained in the absence of target DNA (black, C) and in the presence of 1 nM non target DNA (red, B) and complementary target DNA (blue, A). Reprinted with permission from ref . Copyright 2012 American Chemical Society.
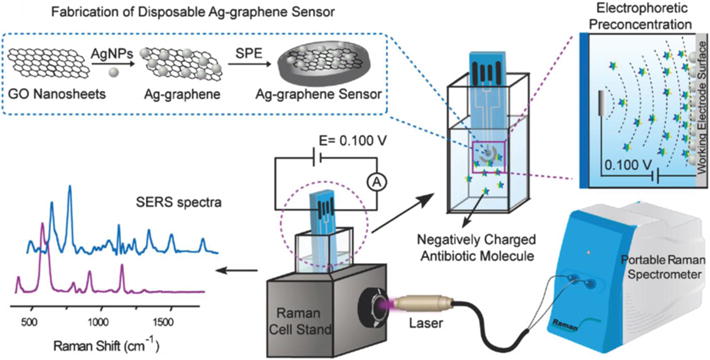
Graphene–AgNP sensor based on electrophoretic preconcentration and SERS. Schematic representation of a disposable Ag–graphene sensor for the detection of polar antibiotics in water. The magnification insets show the fabrication of Ag–graphene sensors and the electrophoretic preconcentration process of polar antibiotics. The distribution of antibiotics molecules is sketched for the case of a negatively charged analyte. At a given potential, most of the negatively charged antibiotics are concentrated onto the positively charged printed electrode, due to the generated electric field between the working electrode and the counter electrode. In SERS experiments, the laser comes vertically from the side view of the spectroelectrochemical cell and is focused on the Ag–graphene sensor. SPE = screen-printed electrodes. Reprinted with permission from ref . Copyright 2013 Elsevier.
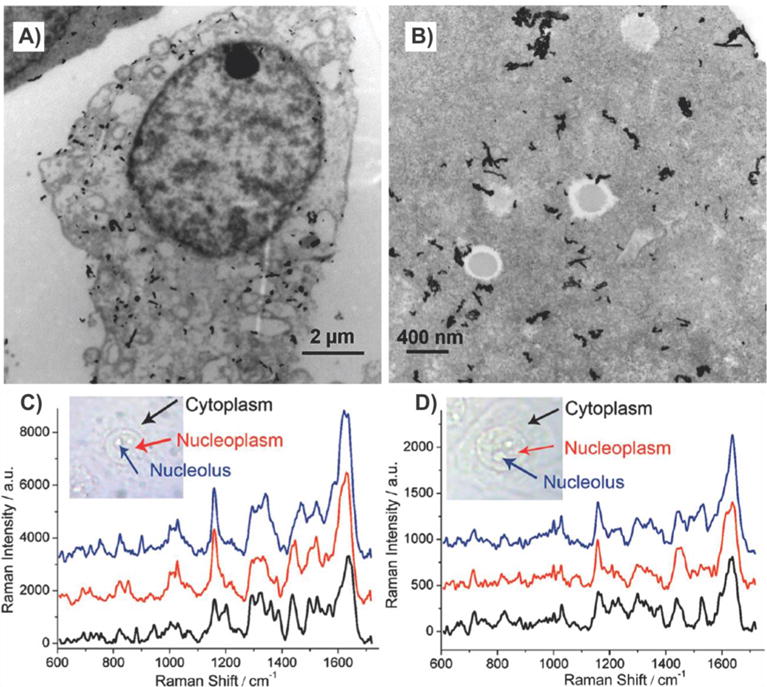
Intracellularly grown GO–AuNP hybrids for SERS. (A and B) TEM images of A549 cells containing GO/PVP/IGAuNs nanocomposites. (C, GO/PVP/IGAuNs; and D, IGAuNs) SERS spectra of A549 cells collected from the regions corresponding to the cytoplasm, nucleoplasm, and nucleolus. Reprinted with permission from ref . Copyright 2012 American Chemical Society.
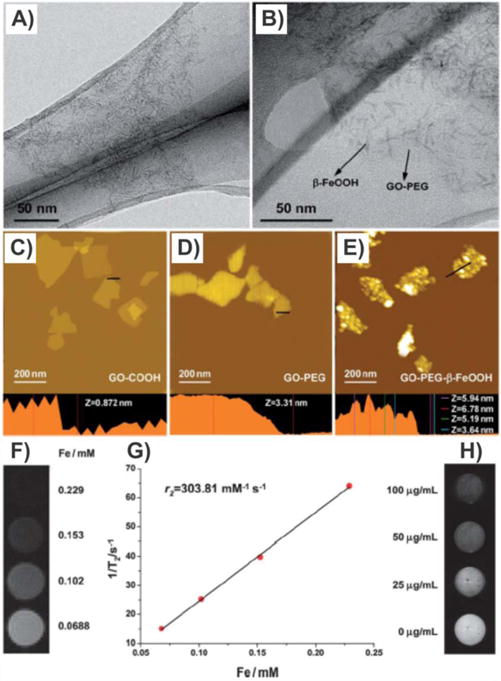
In situ growth of β-FeOOH nanorods on GO for in vivo MRI and cancer therapy. (A and B) TEM images of β-FeOOH nanorods on GO. AFM images of (C) GO-COOH, (D) GO-PEG, and (E) GO-PEG-β-FeOOH. (F) T2-weighted MR images of GO-PEG-β-FeOOH. (G) Plot of 1/T2 versus Fe concentration in GO-PEG-β-FeOOH. The slope indicates the specific relaxivity (r2). (H) T2-weighted MR images of HeLa cells after 4 h incubation with different concentrations of GO-PEG-β-FeOOH. Reprinted with permission from ref . Copyright 2013 Royal Society of Chemistry.
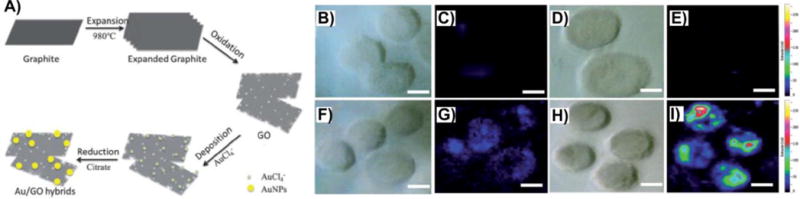
GO–AuNP hybrid-based SERS probe for cancer cell imaging. (A) Scheme for the preparation of GO and Au nanoparticle decorated GO (Au/GO hybrids). Optical (B, D, F, H) and Raman (C, E, G, I) images of HeLa 229 cells. Cells were incubated in medium without GO (B and C), in medium with Au nanoparticles (D and E), in medium with GO (F and G), and Au/GO hybrids (H and I). Scale bars: 10 μm. Reprinted with permission from ref . Copyright 2012 Royal Society of Chemistry.
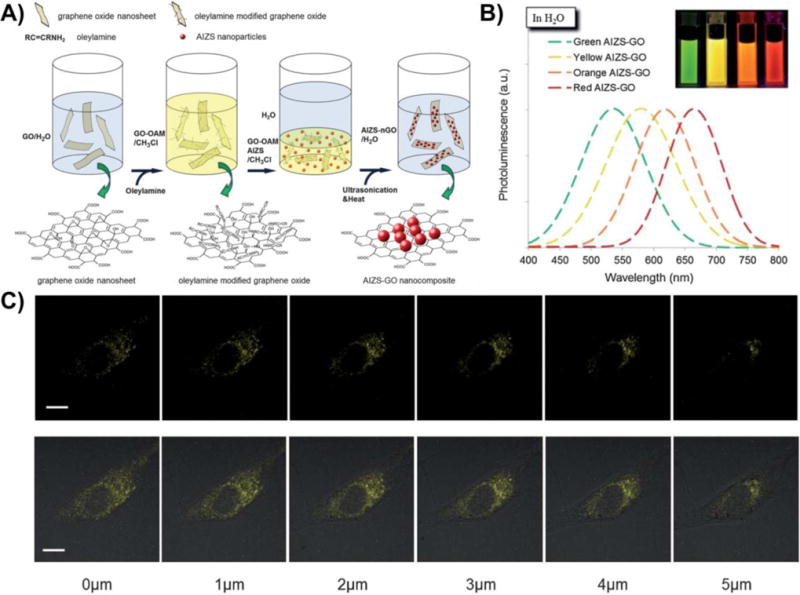
GO–AIZS NP composites for cellular imaging. (A) Schematic illustration of the procedure for synthesizing fluorescent zinc-doped AgInS2 quantum dot decorated GO (AIZS–GO) nanocomposites. (B) The photoluminescence spectra of AIZS–GO nanocomposites suspended in water. (C) Confocal laser scanning microscope (CLSM) images (top row) and merged images (bottom row) of one typical NIH/3T3 cell tagged with yellow color emitting AIZS–GO–PEG nanocomposites at different cross sections (1 μm intervals). Scale bars: 10 μm. Reprinted with permission from ref . Copyright 2013 Royal Society of Chemistry.
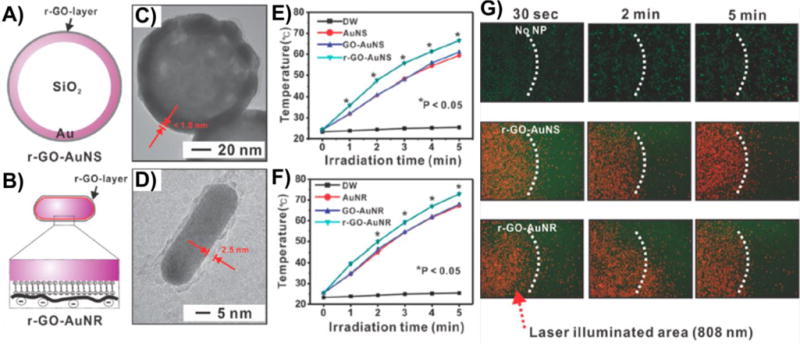
Plasmonic nanoparticles coated with rGO for photothermal therapy. Schematic representation of (A) rGO coated Au nanoparticles (rGO–AuNS) and (B) rGO coated Au nanorods. HR-TEM image of (C) rGO–AuNS and (D) rGO–AuNR. (E and F) Solution temperature changes over time upon irradiation (3.0 W cm−2, 808 nm) of solutions of coated and uncoated nanoparticles and distilled water (DW). (G) Photothermal cell killing with rGO–AuNS and rGO–AuNR, measured by live/dead assay after 30 s, 2 min, and 5 min of irradiation (3.0 W cm−2, 808 nm). The dotted white line represents the boundary of the irradiated area. Reprinted with permission from ref . Copyright 2013 American Chemical Society.
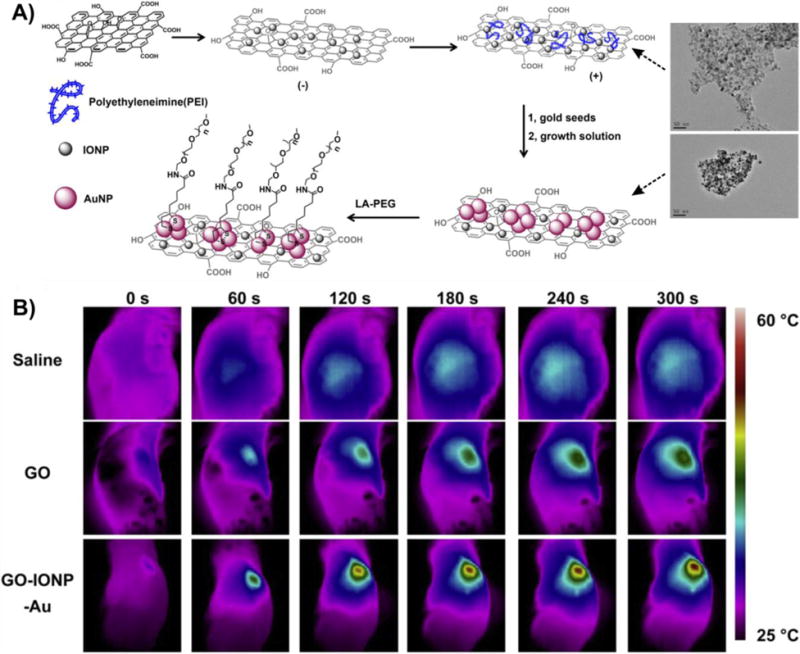
GO–AuNP composite for dual bioimaging and photothermal therapy. (A) Schematic illustration of GO-IONP-Au nanocomposite synthesis. (B) IR thermal images of tumor-bearing mice injected with saline, GO-PEG, or GO-IONP-Au-PEG under laser irradiation (808 nm, 0.75 W/cm2). Reprinted with permission from ref . Copyright 2013 Elsevier.
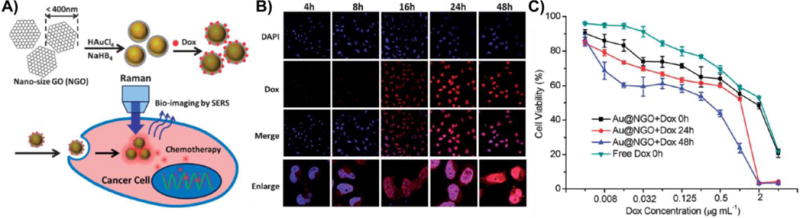
GO wrapped AuNPs for intracellular Raman imaging and drug delivery. (A) Illustrative mechanism of SERS-based bioimaging and anticancer drug delivery by using Au@NGO. (B) Confocal laser scanning microscopy (CLSM) images of HeLa cells treated with DOX-loaded Au@ NGO (Au@NGO + DOX, 25 μg mL−1) for different times. (C) MTT cytotoxicity assay of HeLa cells after being treated with DOX-loaded Au@ NGO (Au@NGO + DOX) and free DOX. Reprinted with permission from ref . Copyright 2013 Royal Society of Chemistry.
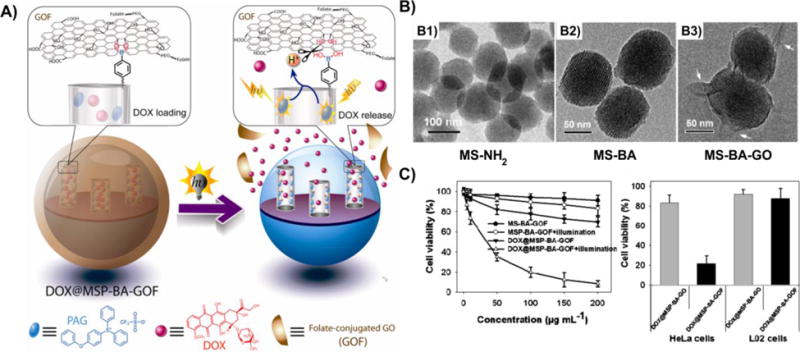
Remote-controlled drug release from GO-capped mesoporous silica to cancer cells by photoinduced pH-jump activation. (A) Schematic illustration of DOX@MS-BA-GOF as a drug delivery system for remote light control of drug release. (B) TEM images of amine-terminated mesoporous silica (b1), boronic acid-grafted MS (b2), and GO-capped MS-BA (b3). (C) Viability of HeLa cells after being incubated with different nanoparticles (MS-BA-GOF, MSP-BA-GOF, and DOX@MSP-BA-GOF). Cytotoxicity of DOX@MSP-BA-GOF and DOX@MSP-BA-GO incubated with HeLa cells and L02 cells for 24 h. Reprinted with permission from ref . Copyright 2014 American Chemical Society.
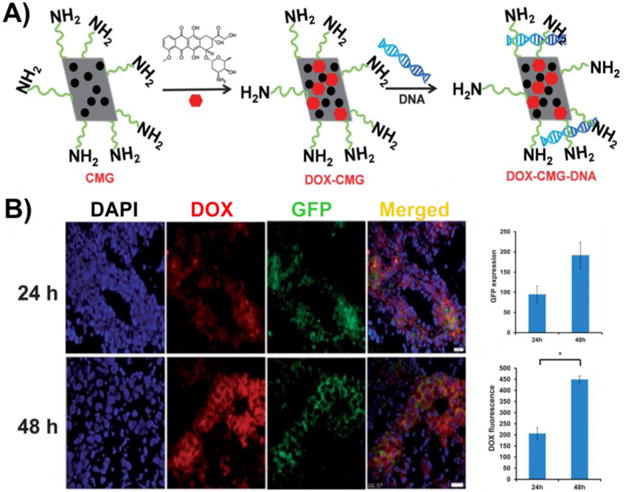
Multifunctional chitosan magnetic-graphene nanoparticles for tumor-targeted codelivery of drugs, genes, and MRI contrast agents. (A) Schematic showing the generation of DOX-loaded chitosan functionalized magnetic graphene complexed with DNA plasmids encoding GFP (DOX-CMG-GFP-DNA) complexes. (B) GFP expression and DOX fluorescence in frozen sections from mice injected with DOX-CMG-GFP-DNA (30 μg of DOX and 25 μg of GFP-DNA), examined using a fluorescent microscope at 400× magnification. Expression was quantified and normalized to control background. Reprinted with permission from ref . Copyright 2013 Royal Society of Chemistry.
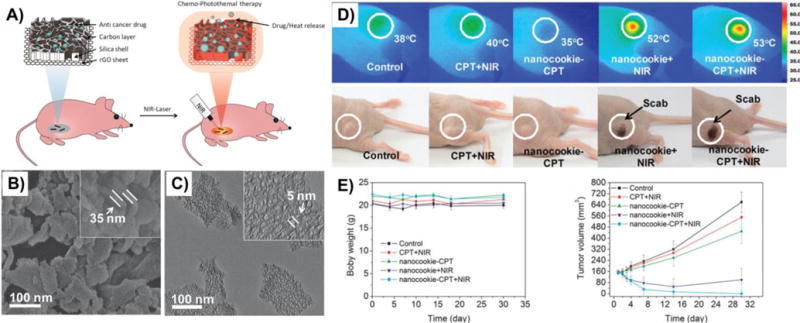
rGO/carbon/mesoporous silica nanocookies for NIR-triggered photochemothermal therapy. (A) Schematic illustration of chemo-photothermal therapy using reduced graphene oxide/carbon/mesoporous silica nanocookies, under NIR light-control. (B) FE-SEM and (C) low magnification TEM images of nanocookies. Inset: High magnification images of a nanocookie. (D) Infrared thermal images of a MDA-MB-231 tumor-bearing nude mouse treated with PBS+NIR (control), CPT+NIR, nanocookie-CPT (no NIR), nanocookie+NIR, nanocookie-CPT+NIR treatment. Color bar on right shows temperature in °C. Pictures at day 4 after NIR irradiation (808 nm, 0.75 W cm−2, 5 min, 1 min interval for every min treatment) show the tumor turned into a scab at the site injected with nanocookie+NIR and nanocookie-CPT+NIR. White circles represent tumor sites. (E) Changes in body weight and tumor volumes following treatment. Reprinted with permission from ref . Copyright 2014 Wiley.
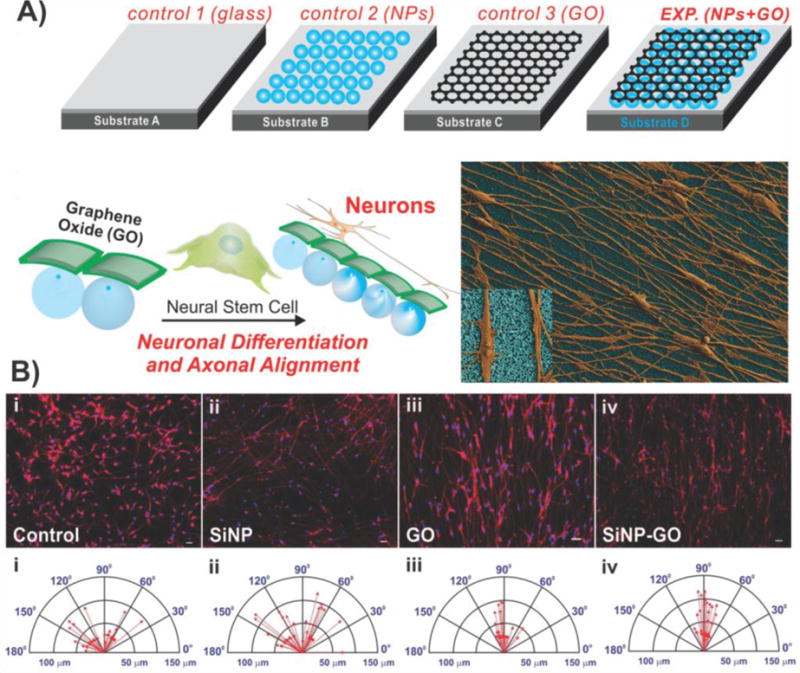
Graphene–nanoparticle hybrids to guide neural stem cell differentiation and axonal alignment. (A) Schematic diagram depicting the varying conditions and influence of nanoparticle (NP) monolayers coated with graphene oxide (GO) on the alignment of axons extending from human NSCs, and the differentiation into neurons. The differentiated human NSCs (orange) and the NPs-coated with GO (blue) in the SEM image show enhanced neuronal differentiation and axonal alignment. (B) Differentiated human NSCs, immunostained with TuJ1 (red), show no alignment of axons on glass (control) and SiNP films, whereas the axons are significantly aligned on GO and SiNP-GO films. Scale bar: 10 um. Compass plots show a large variation in the angle of orientation of axons on glass (±42°) and SiNPs (±46.11°) and minimal variation on GO (±17.8°) and SiNP-GO (±9.16°). Plots also show that axons extending on SiNP and SiNP-GO are longer than those extending on glass and GO. Reprinted with permission from ref . Copyright 2013 Wiley.
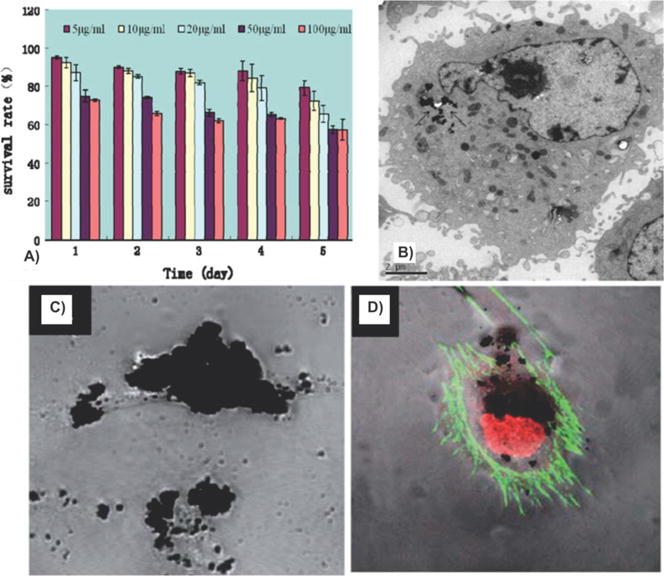
Biocompatibility of graphene materials. Effects of GO on human fibroblast cells. (A) The survival rate at different concentrations of GO and at different periods of exposure. (B) TEM picture showing the location of GO inside human fibroblast cells as indicated by the black arrows. Reprinted with permission from ref . Copyright 2011 Springer. (C) Differential interference contrast image showing the accumulation of pristine graphene on the plasma membrane of Vero cells. (D) Fluorescence confocal microscopy of cytoskeletal F-actin arrangement of cells treated with pristine graphene. Reprinted with permission from ref . Copyright 2011 Royal Society of Chemistry.
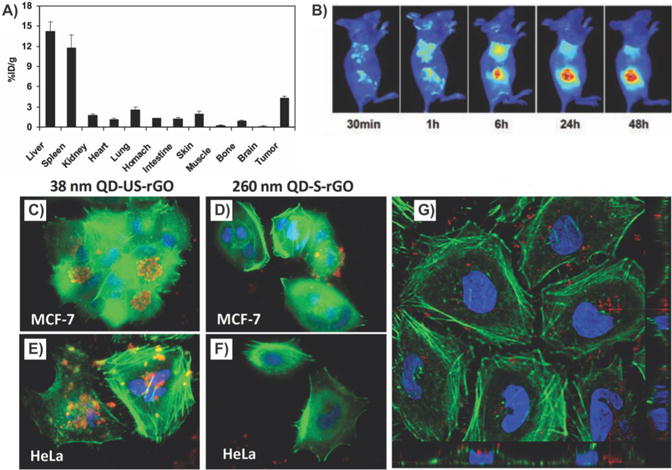
Biocompatibility of graphene–nanoparticle hybid materials. (A) Biodistribution of 125I-RGO-IONP-PEG in 4T1 tumor-bearing mice. High uptake was observed in the RES (e.g., liver and spleen) as well as in the tumor. (B) Fluorescence imaging using Cy5 labeled RGO-IONP-PEG showing biodistribution. Reprinted with permission from ref . Copyright 2012 Wiley. (C–F) Cellular uptake of FA-QD-S-rGO in MCF-7 cells (C) and HeLa cells (E) showing QD fluorescence (red-orange) in many regions, and that of FA-QD-S-rGO in MCF-7 cells (D) and HeLa cells (F), showing QDs mostly at the cell surface. (G) Confocal images of multiple cross sections (bottom and right), exhibiting various locations of the QD-rGOs within the MCF-7 cells. Reprinted with permission from ref . Copyright 2012 Wiley.
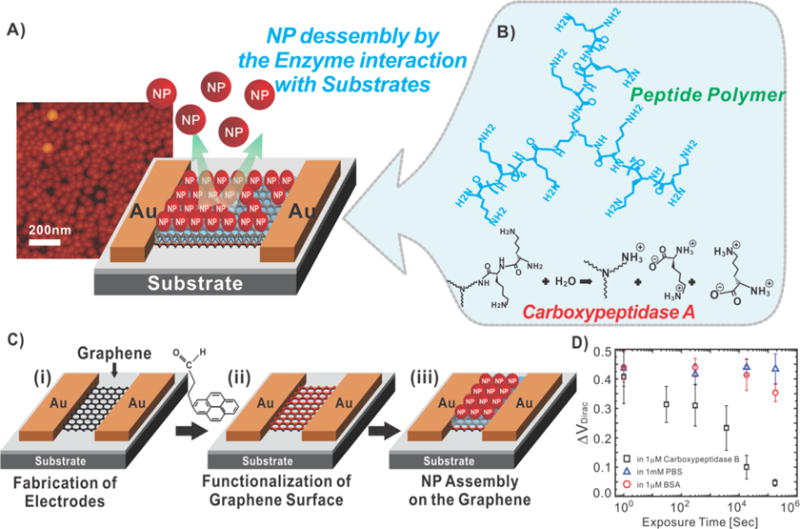
Hysteresis-based enzyme detection using a graphene–nanoparticle hybrid sensor. (A) Graphene–nanoparticle hybrid devices for enzyme sensing. (B) Chemical structure of the functional polypeptide linker molecule. (C) Fabrication process of the hybrid biosensor. Fabrication of the graphene channel between the Au electrodes (i). Functionalization of the graphene surface with hydrophilic molecules (ii). Assembly of the functional peptide linker molecules and AuNPs on the polypeptide layer (iii). (D) Change in VDirac under various periods of exposure to a 1 μM solution of carboxypeptidase B in PBS, 1 mM PBS solution, and 1 mM solution of BSA in PBS. Reprinted with permission from ref . Copyright 2012 Wiley.
References
-
- Stoller MD, Park SJ, Zhu YW, An JH, Ruoff RS. Nano Lett. 2008;8:3498. - PubMed
-
- Lee C, Wei XD, Kysar JW, Hone J. Science. 2008;321:385. - PubMed
-
- Balandin AA, Ghosh S, Bao W, Calizo I, Teweldebrhan D, Miao F, Lau CN. Nano Lett. 2008;8:902. - PubMed
-
- Bolotin KI, Sikes KJ, Jiang Z, Klima M, Fudenberg G, Hone J, Kim P, Stormer HL. Solid State Commun. 2008;146:351.
- Gomez-Navarro C, Weitz RT, Bittner AM, Scolari M, Mews A, Burghard M, Kern K. Nano Lett. 2007;7:3499. - PubMed
Publication types
MeSH terms
Substances
Grants and funding
LinkOut - more resources
Full Text Sources
Other Literature Sources
