. 2015 Feb 18:6:6224.
doi: 10.1038/ncomms7224.

Dendritic cells induce Th2-mediated airway inflammatory responses to house dust mite via DNA-dependent protein kinase

Affiliations

Dendritic cells induce Th2-mediated airway inflammatory responses to house dust mite via DNA-dependent protein kinase

Amarjit Mishra et al. Nat Commun. .

Abstract

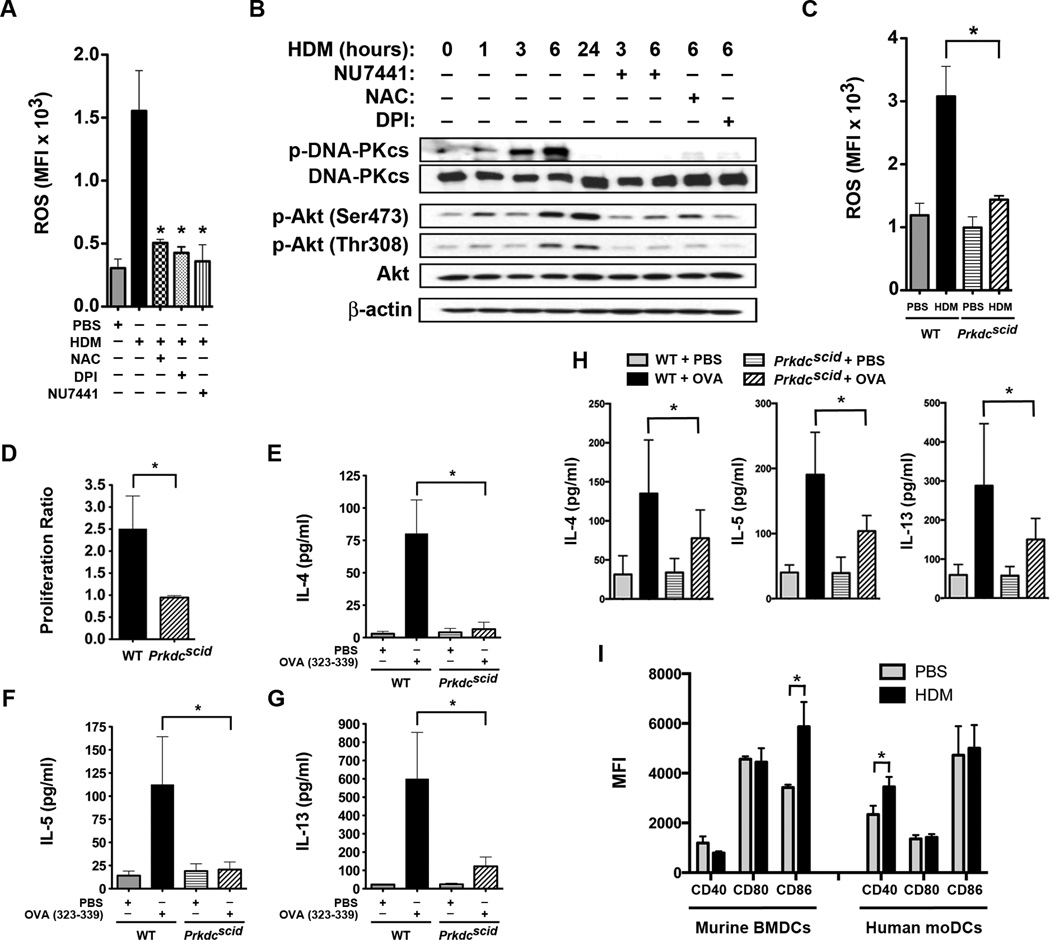
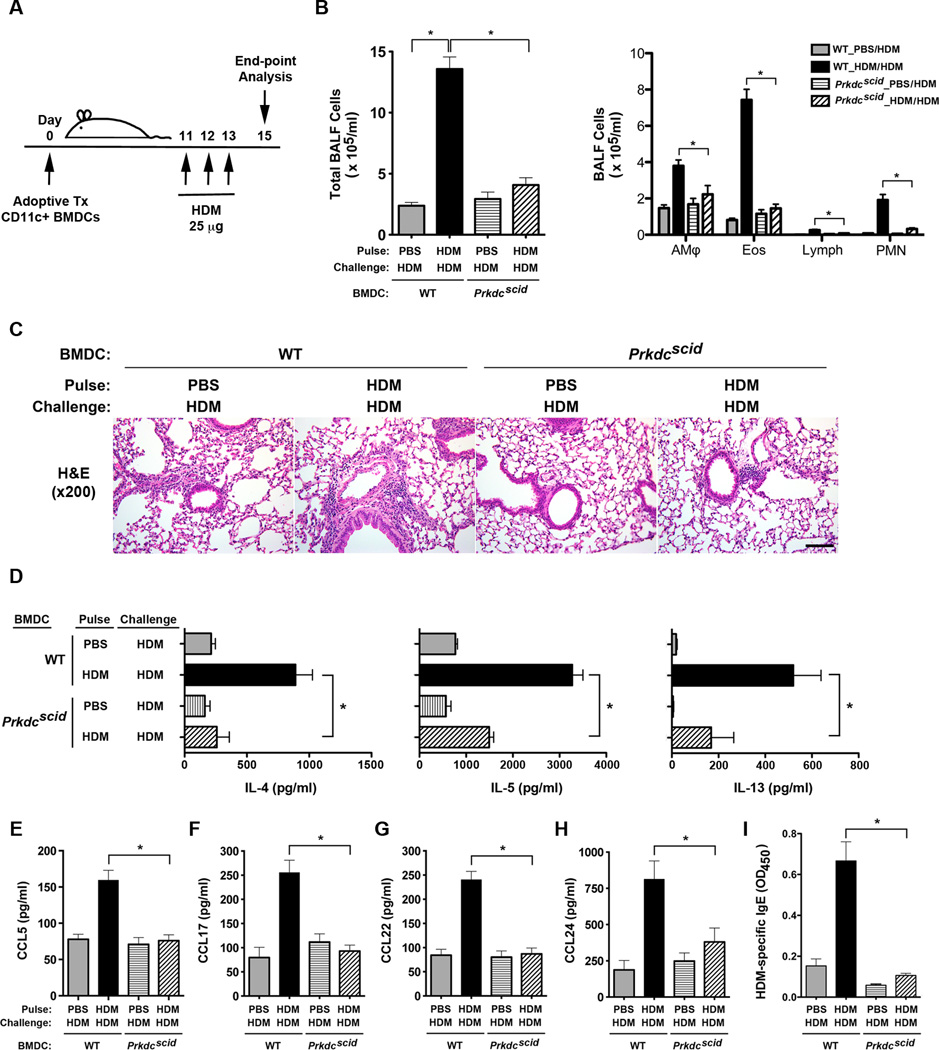
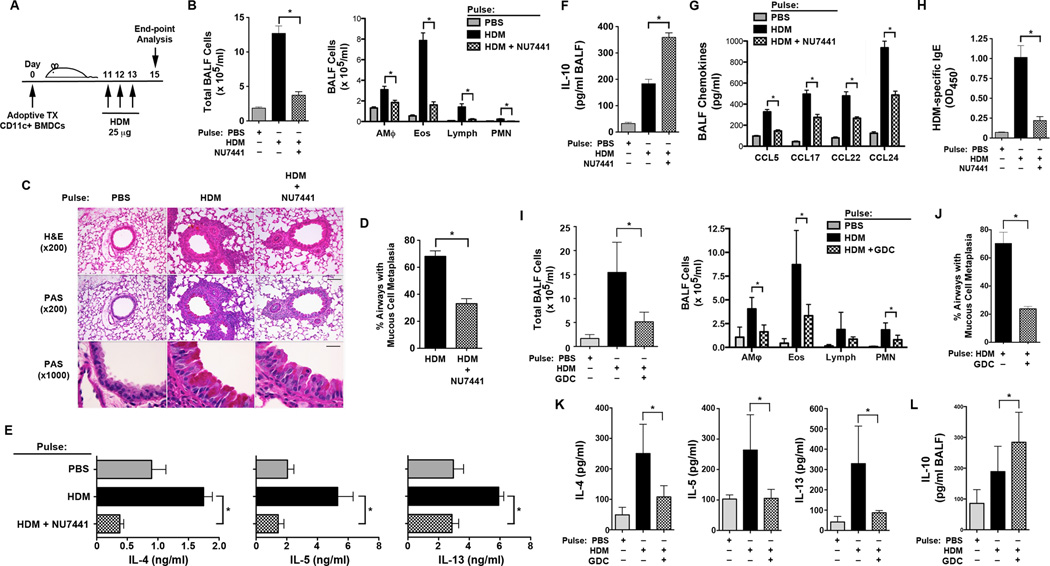
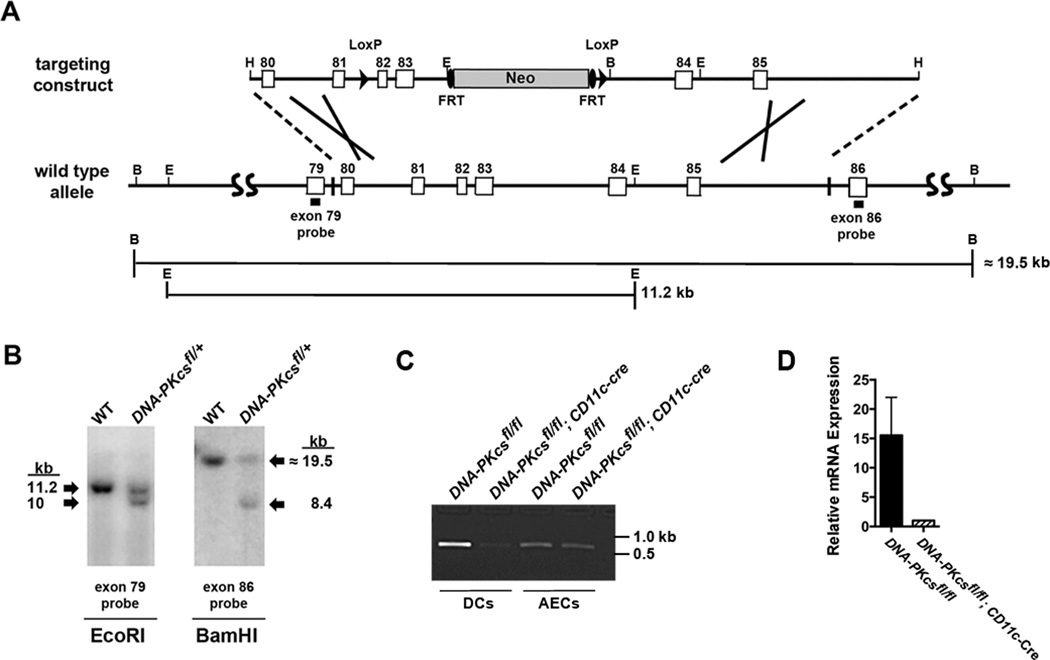
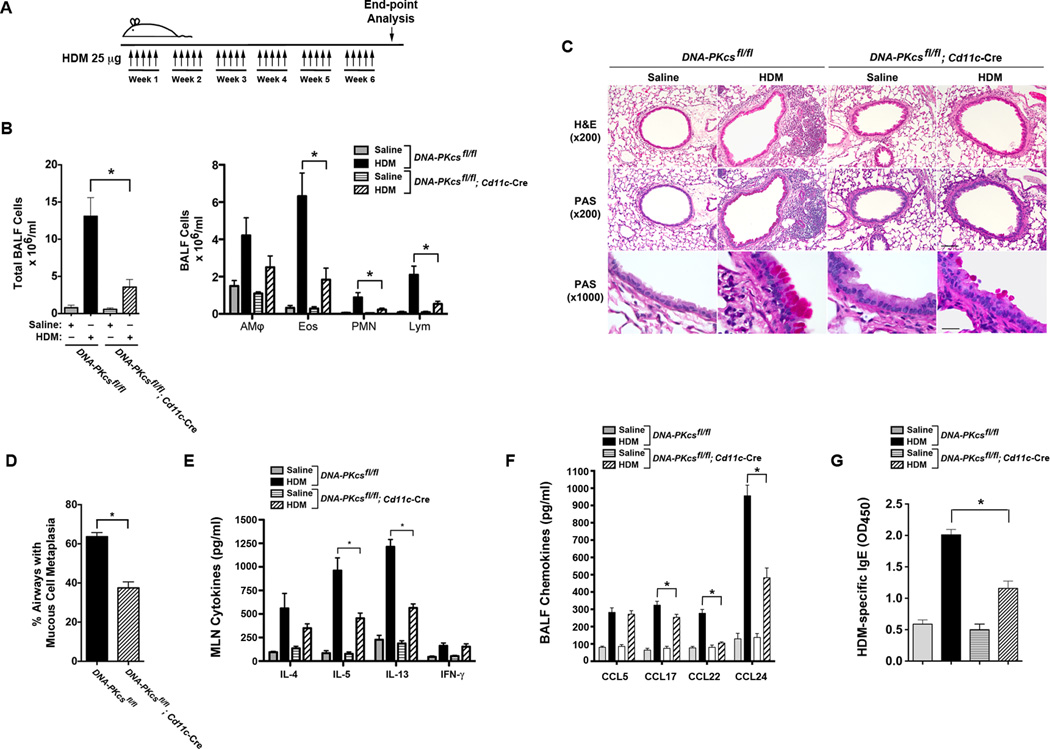
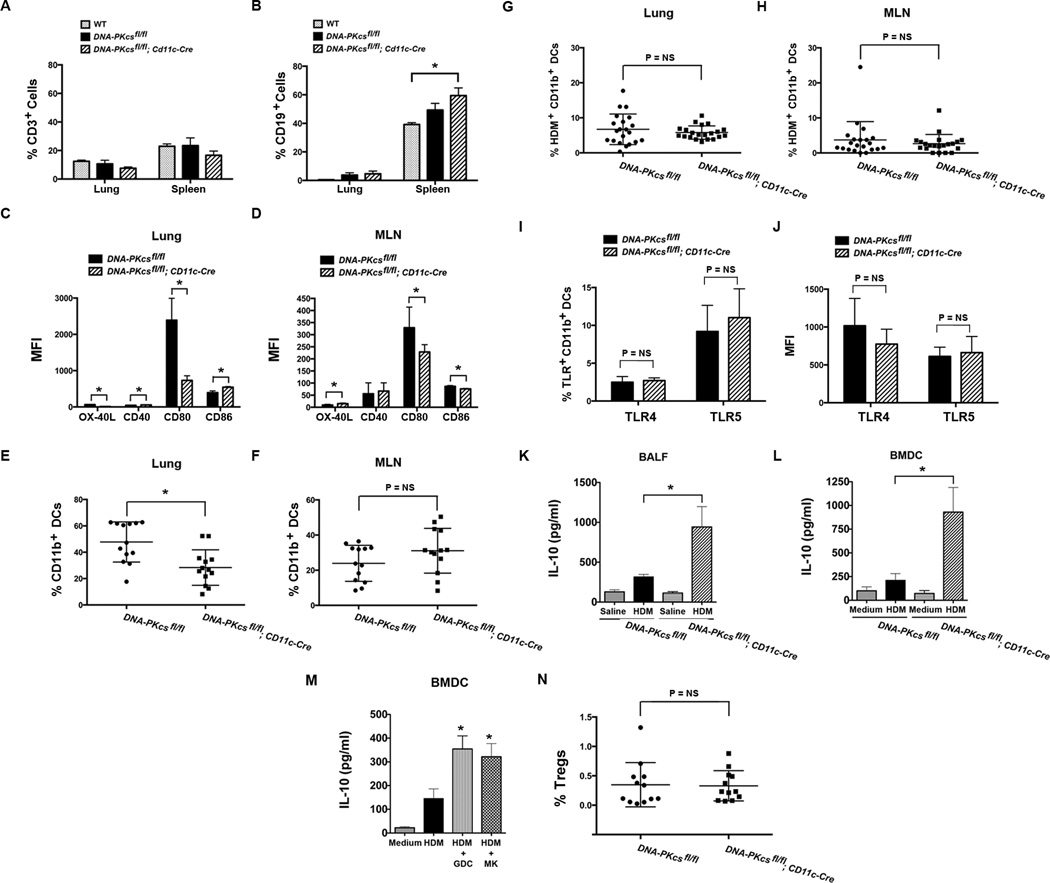
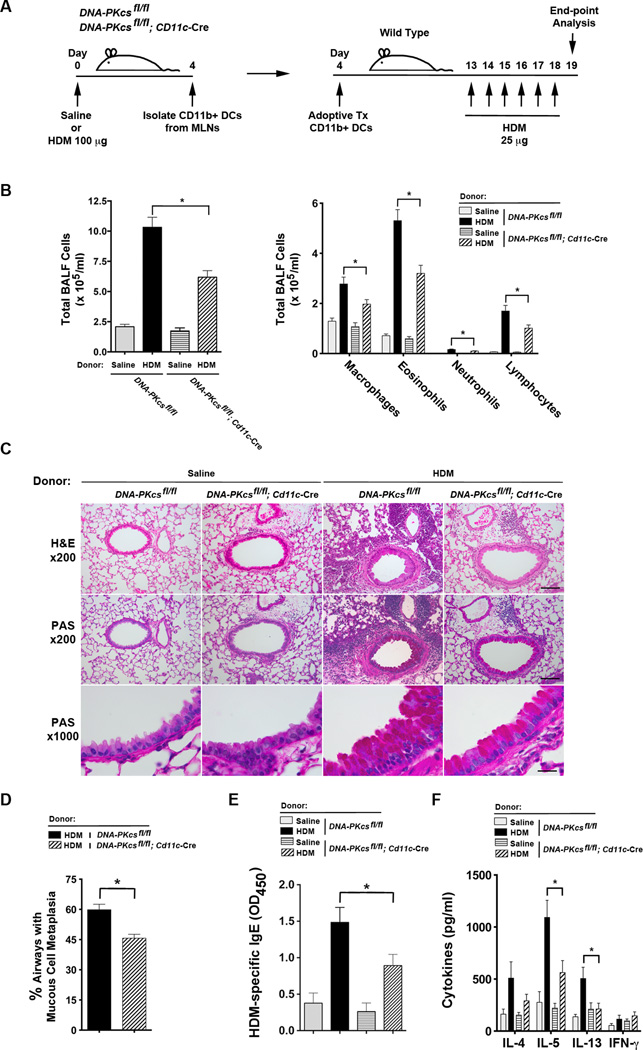
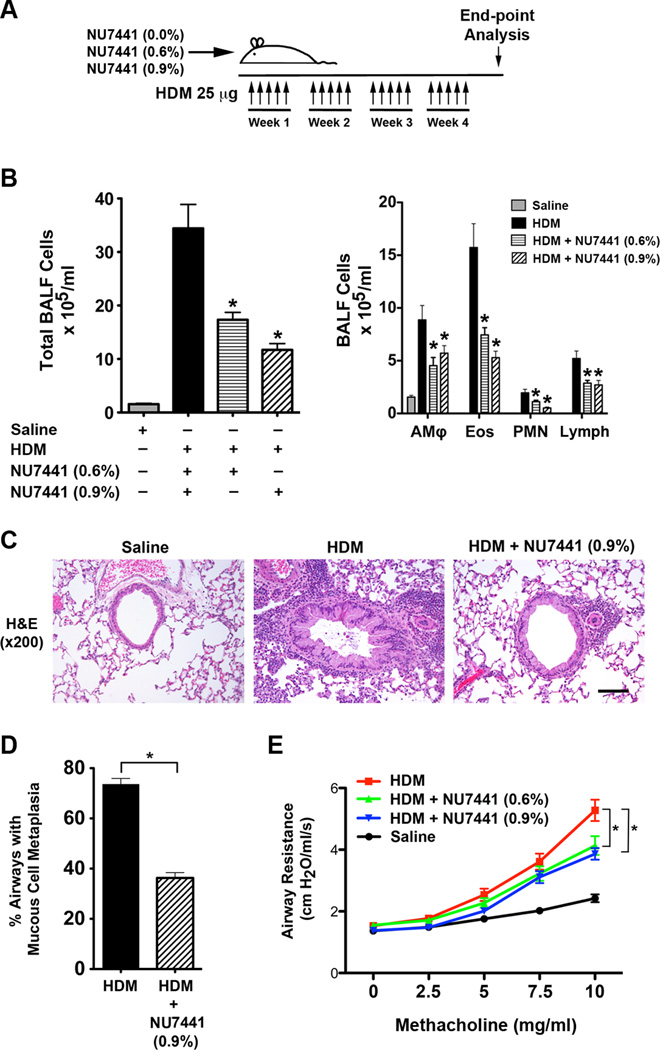
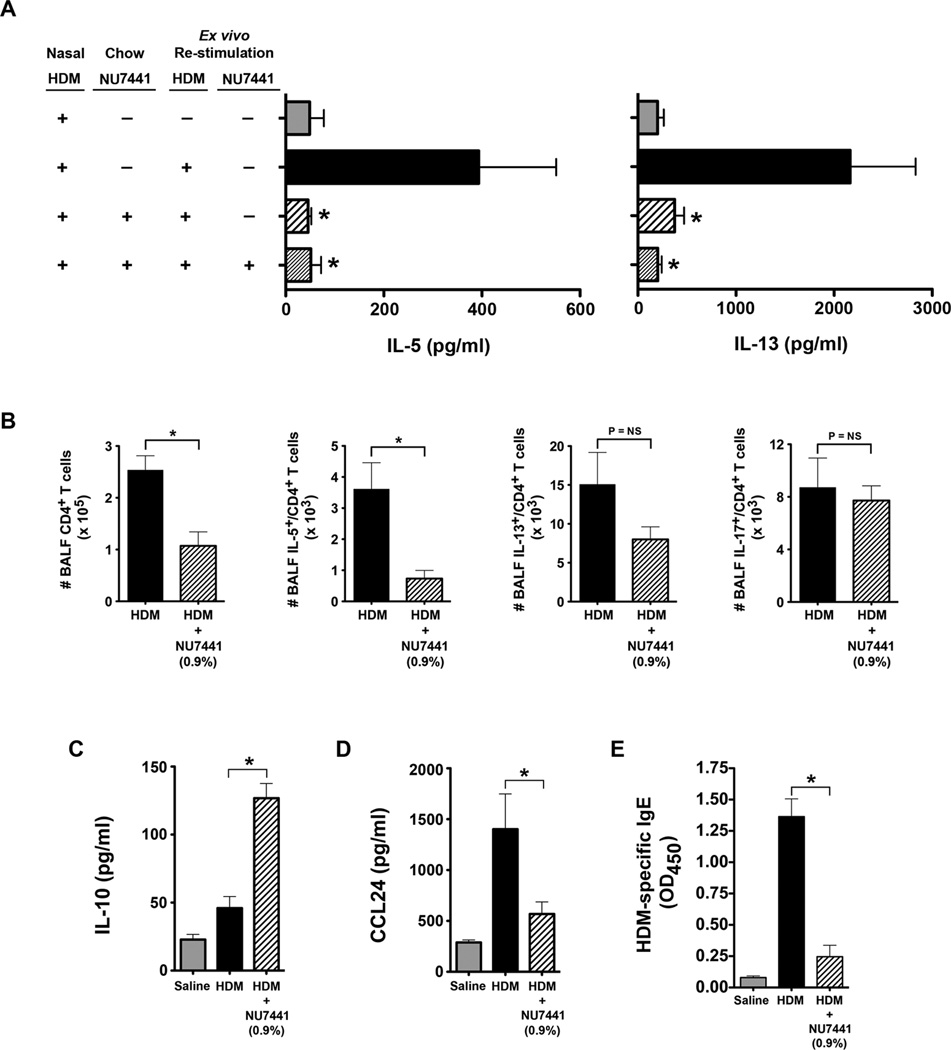
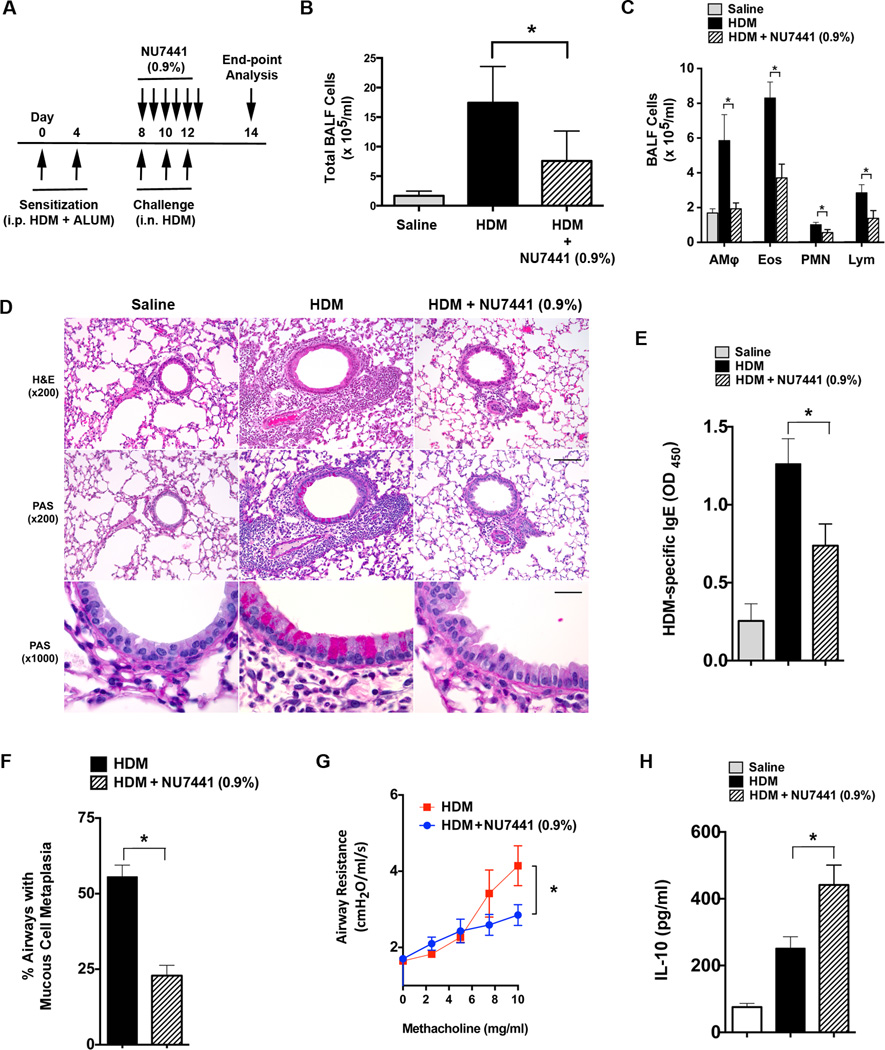
DNA-dependent protein kinase (DNA-PK) mediates double-stranded DNA break repair, V(D)J recombination and immunoglobulin class switch recombination, as well as innate immune and pro-inflammatory responses. However, there is limited information regarding the role of DNA-PK in adaptive immunity mediated by dendritic cells (DCs), which are the primary antigen-presenting cells in allergic asthma. Here we show that house dust mite induces DNA-PK phosphorylation, which is a marker of DNA-PK activation, in DCs via the generation of intracellular reactive oxygen species. We also demonstrate that pharmacological inhibition of DNA-PK, as well as the specific deletion of DNA-PK in DCs, attenuates the induction of allergic sensitization and Th2 immunity via a mechanism that involves the impaired presentation of mite antigens. Furthermore, pharmacological inhibition of DNA-PK following antigen priming similarly reduces the manifestations of mite-induced airway disease. Collectively, these findings suggest that DNA-PK may be a potential target for treatment of allergic asthma.


Figures

Figure 1
Figure 1. House Dust Mite induces Phosphorylation of Dendritic Cell DNA-PK via Generation of Reactive Oxygen Species
A. Mean fluorescence intensity (MFI) of intracellular reactive oxygen species (ROS) generated by human monocyte-derived dendritic cells (moDC) stimulated with house dust mite (HDM) (100 µg/ml) for 1 h with or without NAC (2 mM), DPI (10 µM) or NU7441 (0.5 µM) (n = 3 – 5, * P< 0.01 vs. HDM, one way ANOVA with Bonferroni multiple comparison test). B. Western blots of HDM-stimulated human moDC proteins with or without NU7441, NAC or DPI for 1 to 24 h (see Supplementary Figure 2 for images of full original blots). Image is representative of 4 blots. C. MFI of intracellular ROS generated by bone marrow-derived dendritic cells (BMDC) from wild type (WT) and Prkdcscid mice stimulated with HDM (100 µg/ml) for 1 h (n = 3, * P< 0.01, WT + HDM vs. Prkdcscid + HDM, one way ANOVA with Bonferroni multiple comparison test). D. CD11c+ BMDC from Prkdcscid and WT mice were pulsed with the ovalbumin (OVA) 323–339 peptide and incubated at a 1:5 ratio with CSFE-labeled CD4+ DO11.10 T cells for 4 days. OVA-specific proliferation is presented as proliferation index (n = 8, * P = 0.0011, Mann Whitney test, pooled data from 3 independent experiments). E – G. Th2 cytokines released by co-cultures of OVA 323–329-pulsed BMDCs and CSFE-labeled DO11.10 CD3+/CD4+ T cells (n = 3, *P < 0.05, WT + OVA vs. Prkdcscid + OVA, one way ANOVA with Bonferroni multiple comparison test). H. Co-cultures of BMDCs from Prkdcscid and WT mice incubated at a 1:5 ratio with splenic CD4+ T cells from WT mice sensitized to full-length OVA. Co-cultures were treated with PBS or OVA (1 µg/ml) for 4 days and Th2 cytokines were quantified (n = 7, * P < 0.05). Pooled data from 2 independent experiments. I. MFI of CD40, CD80 and CD86 cell surface expression by murine BMDCs (n = 6 mice) and human moDCs (n = 10 mice) stimulated with or without HDM (100 µg/ml) for 24 h. Pooled data from 2 independent experiments (* P < 0.05, Mann Whitney test).
Figure 2
Figure 2. The Adoptive Transfer of HDM-pulsed CD11c+ Bone Marrow-derived Dendritic Cells from Prkdcscid mice has a Reduced Ability to Induce Allergen-mediated Airway Inflammation
A. On day 0, 5 × 10⁴ viable CD11c+ bone marrow-derived dendritic cells (BMDCs) from wild type C57BL/6 and Prkdcscidmice, which had been pulsed ex vivo with HDM or PBS, as a control, were adoptively transferred to recipient wild type C57BL/6 mice. Daily intranasal HDM challenges (25 µg) were administered to all recipient mice on days 11 through 13 and endpoints were analyzed on day 15. B. Number of total BALF inflammatory cells and inflammatory cell types (alveolar macrophages (AMϕ), eosinophils (Eos), lymphocytes (Lymph) and neutrophils (PMN)) from HDM-challenged mice that had received the adoptive transfer of 5 × 10⁴ CD11c+ BMDCs from Prkdcscid and wild type mice that had been pulsed with either PBS or HDM (n = 12 – 14 mice, * P < 0.01, one way ANOVA with Bonferroni multiple comparison test). C. Representative histologic lung sections from HDM-challenged mice that had received the adoptive transfer of CD11c+ BMDCs from Prkdcscid and wild type mice. The scale bar denotes 100 µm. D. Th2 cytokine secretion by ex vivo cultures of mediastinal lymph node cells that had been re-stimulated with or without HDM (100 µg/ml) (n = 3 – 8 mice, * P < 0.05, one way ANOVA with Bonferroni multiple comparison test). One of two independent experiments that showed similar results is shown (data were not pooled due to different ranges of cytokine production between the two experiments). E – H. C-C chemokines in BALF (n = 11 – 13 mice, *P< 0.01, one way ANOVA with Bonferroni multiple comparison test). I. Serum house dust mite-specific IgE (n = 8 – 16 mice, * P < 0.0001, one way ANOVA with Bonferroni multiple comparison test). Results are pooled data from two independent experiments, except where indicated.
Figure 3
Figure 3. The Adoptive Transfer of HDM-pulsed CD11c+ Bone Marrow-derived Dendritic Cells Treated with the DNA-PK inhibitor, NU7441, or the Akt inhibitor, GDC0068, have an Impaired Ability to Induce Allergen-mediated Airway Inflammation
A. On day 0, 5×10⁴ viable CD11c+ bone marrow-derived dendritic cells (BMDCs) from wild type (WT) C57BL/6 mice that were pulsed ex vivo with HDM (100 µg/ml) or PBS, with or without 0.5 µM NU7441 (Panels A – H) or 1 µM GDC0068 (Panels I – L), were adoptively transferred to recipient WT mice. Daily intranasal HDM challenges (25 µg) were administered to all recipient mice on days 11 through 13 and endpoints were analyzed on day 15. B. Number of total BALF cells and inflammatory cell types (alveolar macrophages (AMϕ), eosinophils (Eos), lymphocytes (Lymph) and neutrophils (PMN)) from HDM-challenged mice that had received the adoptive transfer of CD11c+ BMDCs treated with NU7441 and pulsed with either PBS or HDM (n = 12 mice, * P < 0.01, one way ANOVA with Bonferroni multiple comparison test). C. Representative histologic lung sections stained with hematoxylin and eosin (H&E) or periodic acid-Schiff (PAS). Scale bars denote 100 µm for the x200 images and 20 µm for the x1000 images. D. Quantification of mucous cell metaplasia. (n = 12 mice, *P < 0.0001, HDM + NU7441 vs. HDM alone, Mann Whitney test). 54 + 3 airways were examined per mouse. E. Th2 cytokine secretion by ex vivo cultures of mediastinal lymph node cells that had been re-stimulated with PBS or HDM (100 µg/ml) (n = 9 – 16 mice, * P < 0.01, HDM vs. HDM+NU7441, one way ANOVA with Bonferroni multiple comparison test). F. BALF IL-10 (n = 12 mice, * P < 0.0001, HDM vs. HDM+NU7441, one way ANOVA with Bonferroni multiple comparison test). G. BALF C-C chemokines (n = 12 mice, * P < 0.0001, HDM vs. HDM+NU7441, one way ANOVA with Bonferroni multiple comparison test). H. Serum HDM-specific IgE (n = 8 – 15 mice, * P < 0.001, HDM vs. HDM+NU7441, one way ANOVA with Bonferroni multiple comparison test). I. Number of BALF inflammatory cells from HDM-challenged mice that received the adoptive transfer of CD11c+ BMDCs treated with the Akt inhibitor, GDC0068 (GDC), and pulsed with either PBS or HDM (n = 8 – 9 mice, * P < 0.001, one way ANOVA with Sidak’s multiple comparison test). J. Quantification of mucous cell metaplasia. (n = 5 mice, *P = 0.0079, HDM + GDC0068 (GDC) vs. HDM alone, Mann Whitney test). 65 + 2 airways were examined per mouse. K. Th2 cytokine secretion by ex vivo cultures of mediastinal lymph node cells that were re-stimulated with PBS or HDM (100 µg/ml) (n = 4 mice, * P < 0.05, HDM vs. HDM+GDC0068, one way ANOVA with Sidak’s multiple comparison test). Representative results from one of two independent experiments are shown. L. BALF IL-10 (n = 9 mice, * P < 0.05, HDM vs. HDM+GDC0068, one way ANOVA with Sidak’s multiple comparison test). Results are pooled data from two independent experiments, unless otherwise indicated.
Figure 4
Figure 4. Generation and characterization of DNA-PKcsfl/fl; CD11c-Cre mice
A, The DNA-PKcsfl/fl targeting construct, consisting of a HindIII fragment containing exons 80 to 85 of the mouse Prkdc gene, is shown at the top while the wild type allele is shown below for comparison. LoxP is shown as an arrowhead, Neo is shown as a cylinder and FRT is shown as an oval. Restriction sites located at the ends of the construct or used in Southern blotting are indicated (H, HindIII; B, BamHI; E, EcoRI). The exon 79 and exon 86 probes used in Southern blotting are shown by solid rectangles. The sizes of the fragments following digestion of the native Prkdc gene with BamHI or EcoRI are indicated. B. Southern blots of genomic DNA from WT and DNA-PKcsfl/+mice. Left panel, digestion with EcoRI and detection with an exon 79 probe. Right panel, digestion with BamHI and detection with an exon 86 probe. C. Genomic DNA from CD11c+/MHCII+/SiglecF splenic dendritic cells and CD11c/CD45/Ep-CAM+ alveolar type II cells isolated from the lungs of DNA-PKcsfl/fl and DNA-PKcsfl/fl; CD11c-Cre mice by flow cytometry. PCR was performed using exon 81 (PKEx81f) and exon 82 (PKEx82r) primers that flank the 5′ loxP site to generate a 646 bp product from the floxed allele, but not from the recombined allele. (See Supplementary Figures 3 and 4 for full original images of Panels B and C.) D. CD11c+/MHCII+/SiglecF splenic dendritic cells from DNA-PKcsfl/fl and DNA-PKcsfl/fl; CD11c-Cre mice were sorted by flow cytometry. qRT-PCR was performed on pre-amplified cDNA using a Taqman assay that spanned the junction between exons 82 and 83 of DNA-PKcs mRNA (each sample represents pooled cells from 5 mice).
Figure 5
Figure 5. HDM-challenged CD11c-specific DNA-PKcs Knockout Mice Have Impaired Allergen-mediated Inflammation
A. DNA-PKcsfl/fl and DNA-PKcsfl/fl; CD11c-Cre mice were sensitized and challenged by daily administration of HDM 25 micrograms or PBS, 5 days a week, for 6 weeks. End-point analysis was performed 72 h after the last administration of HDM. B. The number of total BALF inflammatory cells and inflammatory cell types (alveolar macrophages (AMϕ), eosinophils (Eos), lymphocytes (Lymph) and neutrophils (PMN)) from saline- and HDM-challenged DNA-PKcsfl/fl; CD11c-Cre mice were compared to DNA-PKcsfl/fl mice, which served as a control (n = 8 – 15 mice, * P < 0.01, DNA-PKcsfl/fl; CD11c-cre + HDM vs. DNA-PKcsfl/fl + HDM, one way ANOVA with Bonferroni multiple comparison test). C. Representative histologic lung sections stained with hematoxylin and eosin (H&E) or periodic acid-Schiff (PAS) are shown. Scale bars denote 100 µm for the x200 images and 20 µm for the x1000 images. D. Quantification of mucous cell metaplasia. (n = 9 mice, *P < 0.0001, DNA-PKcsfl/fl; CD11c-cre + HDM vs. DNA-PKcsfl/fl + HDM, unpaired t test). 55 + 3.8 airways were analyzed per mouse. E. Cytokine secretion by ex vivo cultures of mediastinal lymph node cells that had been re-stimulated with saline or HDM (100 µg/ml) (n = 7 – 13 mice, *P < 0.001 DNA-PKcsfl/fl; CD11c-cre + HDM vs. DNA-PKcsfl/fl + HDM, one way ANOVA with Bonferroni multiple comparison test). F. BALF chemokines. (n = 8 – 12 mice, *P < 0.01, CD11c-cre + HDM vs. DNA-PKcsfl/fl + HDM, one way ANOVA with Bonferroni multiple comparison test). G. Serum HDM-specific IgE. (n = 8 – 16 mice, *P < 0.0001, CD11c-cre + HDM vs. DNA-PKcsfl/fl + HDM, one way ANOVA with Bonferroni multiple comparison test). Results are pooled data from two independent experiments.
Figure 6
Figure 6. Characterization of HDM-challenged CD11c-specific DNA-PKcs Knockout Mice
A & B. The percentage of CD3+ T cells (A) and CD19+ B cells (B) in lungs and spleens of naïve, wild type (WT) C57BL/6 mice, which is the parental strain of both DNA-PKcsfl/fl mice and DNA-PKcsfl/fl; CD11c-Cre mice (n = 6, *P < 0.05, one-way ANOVA with Sidak’s multiple comparison test). Pooled data from two independent experiments. C & D. Mean fluorescence intensity (MFI) of OX-40L, CD40, CD80 and CD86 expression by CD11c+/MHCIIhi/SSClo DCs in lungs (C) and mediastinal lymph nodes (MLN) (D) of HDM-challenged DNA-PKcsfl/fl mice and DNA-PKcsfl/fl; CD11c-Cre mice (n = 5 – 6 mice, * P < 0.05, Mann Whitney test). E & F. The percentage of CD11c+/MHCIIhi/SSClo DCs that express CD11b in the lungs (E) and MLNs (F) of HDM-challenged DNA-PKcsfl/fl mice and DNA-PKcsfl/fl; CD11c-Cre mice (n = 13 mice, * P < 0.0025, Mann Whitney test). G & H. Uptake of HDM by CD11c+/MHCIIhi/SSClo/CD11b+ DCs in the lungs (G) and MLNs (H) of DNA-PKcsfl/fl mice and DNA-PKcsfl/fl; CD11c-Cre mice 72 hours after administration of HDM extract (50 µg) labeled with Alexa Fluor® 647 (n = 21 mice, P = NS, unpaired t test). I & J. The percentage of CD11c+/MHCIIhi/SSClo/CD11b+ DCs that express TLR4 or TLR5 (I) and the MFI of TLR4 and TLR5 expression (J) by CD11c+/MHCIIhi/SSClo/CD11b+ DCs in the lungs of DNA-PKcsfl/fl mice and DNA-PKcsfl/fl; CD11c-Cre mice (n = 8 mice, P = NS, Mann-Whitney test). K. BALF IL-10 (n = 9, * P < 0.01, DNA-PKcsfl/fl; CD11c-Cre + HDM vs. DNA-PKcsfl/fl + HDM, one way ANOVA with Bonferroni multiple comparison test). L. IL-10 secretion by bone marrow-derived dendritic cells (BMDCs) (n = 7 – 9, * P < 0.01, DNA-PKcsfl/fl; CD11c-Cre + HDM vs. DNA-PKcsfl/fl + HDM, one way ANOVA with Bonferroni multiple comparison test). M. IL-10 secretion by BMDCs stimulated with HDM (100 ug/ml) with or without Akt inhibitors, GDC0068 (GDC) and MK2206 (MK), both at 1 uM for 24 hrs (n = 8, * P < 0.05, HDM vs. HDM + Akt inhibitor, one way ANOVA with Bonferroni multiple comparison test). Pooled data from two independent experiments. N. The percentage of CD3+/CD4+/CD25+/Foxp3+ regulatory T cell (Tregs) in MLNs from saline- and HDM-challenged DNA-PKcsfl/fl; CD11c-Cre mice were compared to DNA-PKcsfl/fl mice, which served as a control (n = 12 mice, P = NS, Mann Whitney test).
Figure 7
Figure 7. The adoptive transfer of CD11b+ DCs from CD11c-specificDNA-PKcsKnockout Mice have an Impaired Ability to Induce HDM-mediated Airway Inflammation
A. DNA-PKcsfl/fl and DNA-PKcsfl/fl; CD11c-Cre donor mice received a single intranasal dose of 100 µg of HDM extract or saline and after 4 days, mediastinal lymph nodes were removed and CD11c+/CD11b+/SiglecF/MHCII+ DCs were isolated by flow cytometry. 2.5 × 10⁴ CD11c+/CD11b+/SiglecF/MHCII+ DCs were adoptively transferred to wild type C57BL6 recipient mice by intranasal administration on day 4 and daily intranasal HDM challenges (25 µg) were administered on days 13 through 18 to all recipient mice. Mice were sacrificed for end-point analysis on day 19. B. The number of total BALF inflammatory cells and inflammatory cell subtypes in recipients of adoptively transferred CD11b+ DCs (n = 6 – 10, * P < 0.05, one way ANOVA with Bonferroni multiple comparison test). C. Representative histologic lung sections stained with hematoxylin and eosin (H&E) and periodic acid-Schiff (PAS). Scale bars denote 100 µm for the x200 images and 20 µm for the x1000 images. D. Quantification of mucous cell metaplasia. (n = 10, * P = 0.0005, unpaired t test). 48.7 + 3.3 airways were analyzed per mouse. E. Serum HDM-specific IgE (n = 6 – 10 mice, * P < 0.05, one way ANOVA with Bonferroni multiple comparison test). F. Cytokine secretion by ex vivo cultures of mediastinal lymph node cells that had been re-stimulated with HDM (100 µg/ml) (n = 6 – 8 mice, * P < 0.01, one way ANOVA with Bonferroni multiple comparison test). Results are pooled data from two independent experiments.
Figure 8
Figure 8. Oral administration of the DNA-PK inhibitor, NU7441, Attenuates HDM-induced Allergic Inflammation, Mucous Cell Metaplasia and Airway Hyperresponsiveness
A. Wild type BALB/c mice were sensitized and challenged by daily intranasal administration of HDM (25 ug) or PBS, five days a week for four weeks. Mice were fed chow that contained 0%, 0.6% or 0.9% NU7441 coincident with the HDM sensitization and challenges. B. The number of total BALF inflammatory cells and inflammatory cell types (alveolar macrophages (AMϕ), eosinophils (Eos), neutrophils (PMN) and lymphocytes (Lymph)) from saline- and HDM-challenged BALB/c mice that had or had not been fed chow containing 0.6% or 0.9% NU7441 (n = 20 – 35 mice, * P < 0.05, HDM vs. HDM + NU7441, one way ANOVA with Bonferroni multiple comparison test). C. Representative histologic lung sections stained with hematoxylin and eosin (H&E). The scale bar denotes 100 µm. E. Quantification of mucous cell metaplasia. (n = 20 mice, *P < 0.0001, HDM + NU7441 vs. HDM alone, unpaired t test). 45 + 2 airways were examined per mouse. D. Airway resistance (cm H20/ml/s) to inhaled methacholine. (n = 17 – 20 mice, * P < 0.001, HDM vs. HDM + NU7441, two-way ANOVA with Bonferroni post-test). Results are pooled data from two independent experiments.
Figure 9
Figure 9. Oral administration of the DNA-PK inhibitor, NU7441, Attenuates HDM-induced Allergic Inflammation and IgE production
A. Th2 cytokine production by mediastinal lymph node cells from HDM-challenged mice that had or had not been fed chow containing 0.9% NU7441 and re-stimulated ex vivo with or without HDM (100 µg/ml) and NU7441 (0.5 uM) (n = 6 – 12 mice, * P < 0.05, vs. HDM, one way ANOVA with Bonferroni multiple comparison test). B. The total number of CD4+ T cells, as well as IL-5+/CD4+ and IL-13+/CD4+ T cells in bronchoalveolar lavage fluid (BALF), was quantified by flow cytometry (n = 10 mice, * P < 0.01, Mann Whitney test). C. BALF IL-10 (n = 7 – 12 mice, * P < 0.001, one way ANOVA with Bonferroni multiple comparison test). D. BALF CCL24 (n = 19 – 36 mice, * P < 0.01, one way ANOVA with Bonferroni multiple comparison test). E. Serum HDM-specific IgE. (n = 16 mice, * P < 0.001, one way ANOVA with Bonferroni multiple comparison test). Results are pooled data from at least two independent experiments.
Figure 10
Figure 10. Oral administration of the DNA-PK inhibitor, NU7441, During the Challenge Phase Attenuates the Manifestations of Experimental HDM-induced Asthma
A. Wild type BALB/c mice were sensitized by intraperitoneal administration of HDM (100 µg) and aluminum hydroxide (3 mg) on days 0 and 4. Mice received intranasal challenges with HDM (100 µg) on days 8, 10 and 12 to induce experimental asthma and were concurrently fed chow that contained NU7441 (0.9%) on days 8 through 12. End points were assessed on day 14. B and C. The number of total BALF inflammatory cells (Panel B) and inflammatory cell types (alveolar macrophages (AMϕ), eosinophils (Eos), neutrophils (PMN) and lymphocytes (Lymph)) (Panel C) were significantly reduced in HDM-challenged WT mice that had been fed chow containing NU7441 (0.9%) during the challenge phase as compared to WT mice that had received regular chow (n = 10 mice, * P < 0.05, HDM vs. HDM + NU7441 (0.9%), one way ANOVA with Sidak’s multiple comparison test). D. Representative histologic lung sections stained with hematoxylin and eosin (H&E). Scale bars denote 100 µm for the x200 images and 20 µm for the x1000 images. E. Serum levels of HDM-specific IgE were quantified by ELISA. (n = 10 mice, * P < 0.05, HDM vs. HDM + NU7441 (0.9%), one way ANOVA with Sidak’s multiple comparison test). F. Quantification of mucous cell metaplasia. (n = 10 mice, *P < 0.0001, HDM vs. HDM + NU7441 (0.9%), unpaired t test). 58.4 + 2.8 airways were examined per mouse. G. Airway resistance (cm H20/ml/s) to inhaled methacholine (10 mg/ml) was significantly reduced in mice that were fed chow that contained NU7441 (0.9%). (n = 10 mice, * P =, HDM vs. HDM + NU7441, unpaired t test). H. BALF IL-10 (n = 10 mice, * P < 0.01, HDM vs. HDM + NU7441 (0.9%), one way ANOVA with Sidak’s multiple comparison test).

Similar articles

Cited by

References

    1. Davidson D, Amrein L, Panasci L, Aloyz R. Small Molecules, Inhibitors of DNA-PK, Targeting DNA Repair, and Beyond. Front Pharmacol. 2013;4:5. - PMC - PubMed
    1. Kong X, Shen Y, Jiang N, Fei X, Mi J. Emerging roles of DNA-PK besides DNA repair. Cell Signal. 2011;23:1273–1280. - PubMed
    1. Meek K, Dang V, Lees-Miller SP. DNA-PK: the means to justify the ends? Adv Immunol. 2008;99:33–58. - PubMed
    1. Chen BP, Li M, Asaithamby A. New insights into the roles of ATM and DNA-PKcs in the cellular response to oxidative stress. Cancer Lett. 2012;327:103–110. - PubMed
    1. Neal JA, Meek K. Choosing the right path: does DNA-PK help make the decision? Mutat Res. 2011;711:73–86. - PMC - PubMed

Publication types

MeSH terms