

Back-extrapolating a land use regression model for estimating past exposures to traffic-related air pollution
- PMID: 25692663
- PMCID: PMC4763339
- DOI: 10.1021/es505707e
Back-extrapolating a land use regression model for estimating past exposures to traffic-related air pollution
Abstract
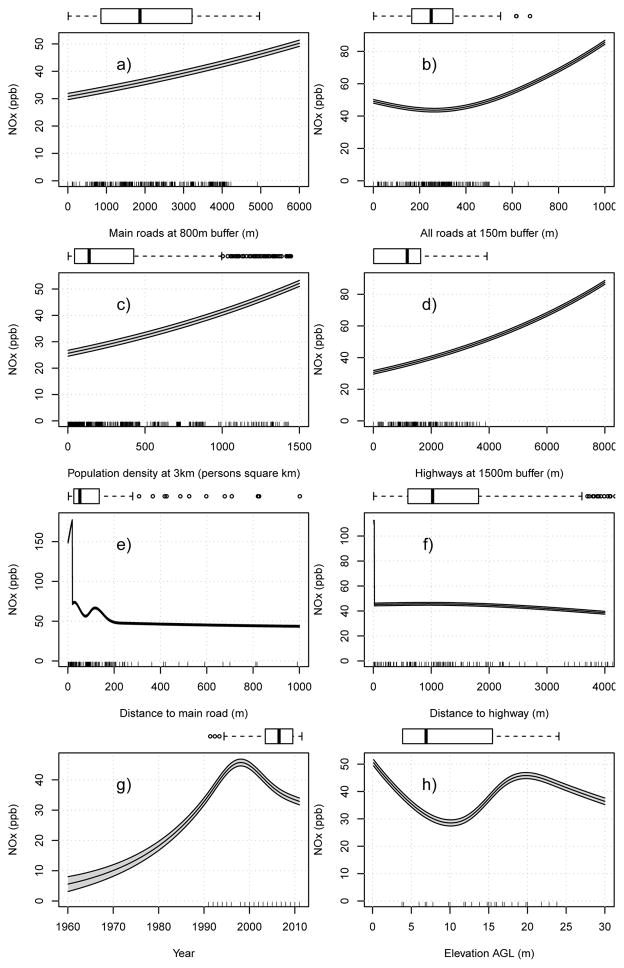
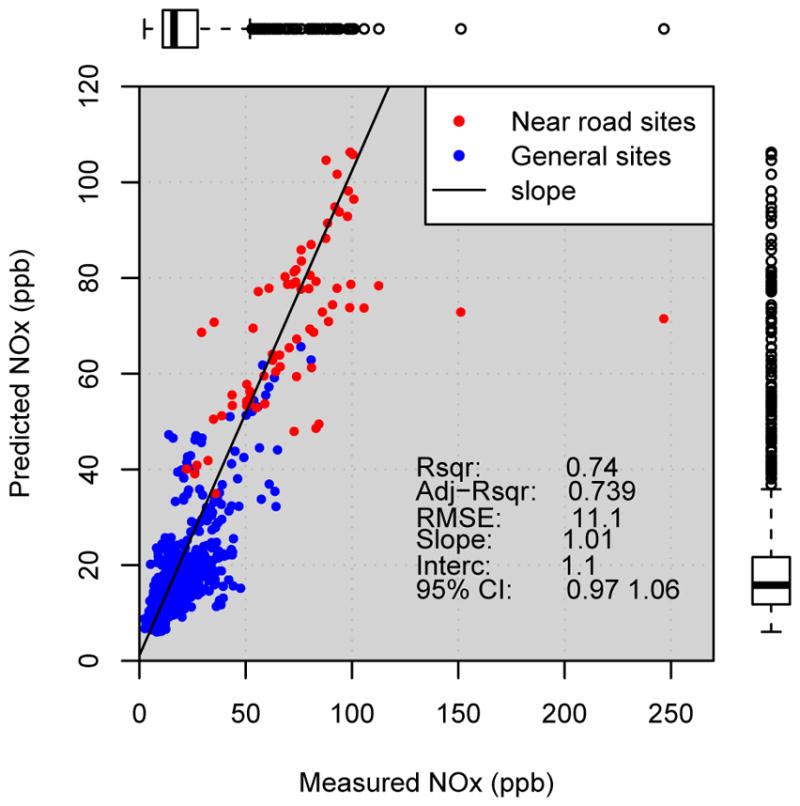
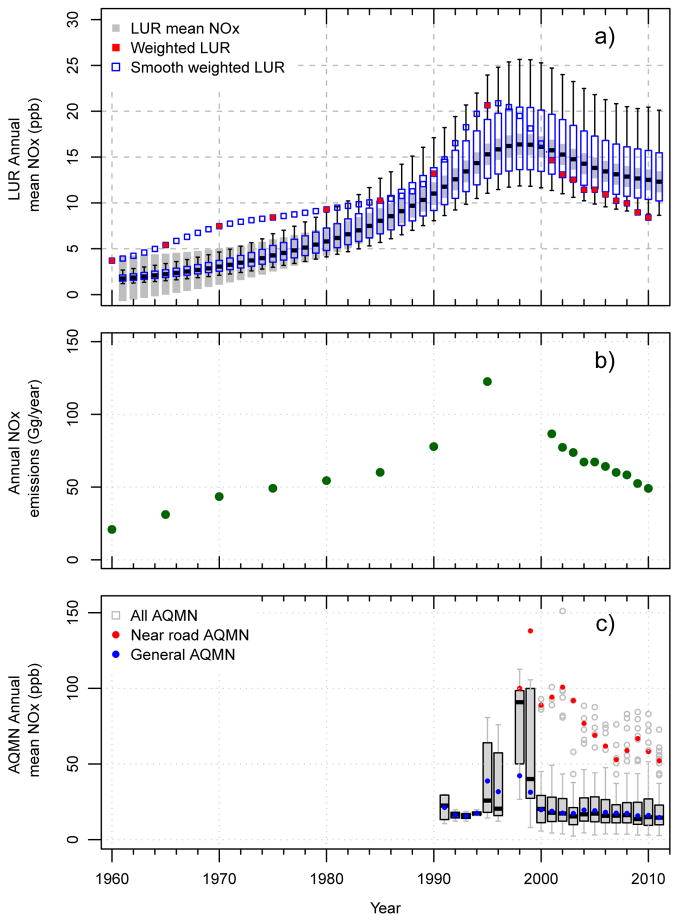
Land use regression (LUR) models rely on air pollutant measurements for their development, and are therefore limited to recent periods where such measurements are available. Here we propose an approach to overcome this gap and calculate LUR models several decades before measurements were available. We first developed a LUR model for NOx using annual averages of NOx at all available air quality monitoring sites in Israel between 1991 and 2011 with time as one of the independent variables. We then reconstructed historical spatial data (e.g., road network) from historical topographic maps to apply the model's prediction to each year from 1961 to 2011. The model's predictions were then validated against independent estimates about the national annual NOx emissions from on-road vehicles in a top-down approach. The model's cross validated R2 was 0.74, and the correlation between the model's annual averages and the national annual NOx emissions between 1965 and 2011 was 0.75. Information about the road network and population are persistent predictors in many LUR models. The use of available historical data about these predictors to resolve the spatial variability of air pollutants together with complementary national estimates on the change in pollution levels over time enable historical reconstruction of exposures.
Figures

References
-
- Chen H, Goldberg MS, Crouse DL, Burnett RT, Jerrett M, Villeneuve PJ, Wheeler AJ, Labrèche F, Ross NA. Back-extrapolation of estimates of exposure from current land-use regression models. Atmospheric Environment. 2010;44:4346–4354.
-
- Gulliver J, de Hoogh K, Hansell A, Vienneau D. Development and Back-Extrapolation of NO2 Land Use Regression Models for Historic Exposure Assessment in Great Britain. Environ Sci Technol. 2013;47:7804–7811. - PubMed
-
- Cesaroni G, Boogaard H, Jonkers S, Porta D, Badaloni C, Cattani G, Forastiere F, Hoek G. Health benefits of traffic-related air pollution reduction in different socioeconomic groups: the effect of low-emission zoning in Rome. Occupational and Environmental Medicine. 2012;69:133–139. - PubMed
-
- Small KA, Van Dender K. Fuel efficiency and motor vehicle travel: the declining rebound effect. The Energy Journal. 2007:25–51.
-
- Parrish DD. Critical evaluation of US on-road vehicle emission inventories. Atmospheric Environment. 2006;40:2288–2300.
Publication types
MeSH terms
Substances
Grants and funding
LinkOut - more resources
Full Text Sources
Other Literature Sources
Miscellaneous
