. 2015 Feb 18;11(2):e1004049.
doi: 10.1371/journal.pcbi.1004049. eCollection 2015 Feb.

The roles of post-translational modifications in the context of protein interaction networks

Affiliations

The roles of post-translational modifications in the context of protein interaction networks

Guangyou Duan et al. PLoS Comput Biol. .

Abstract

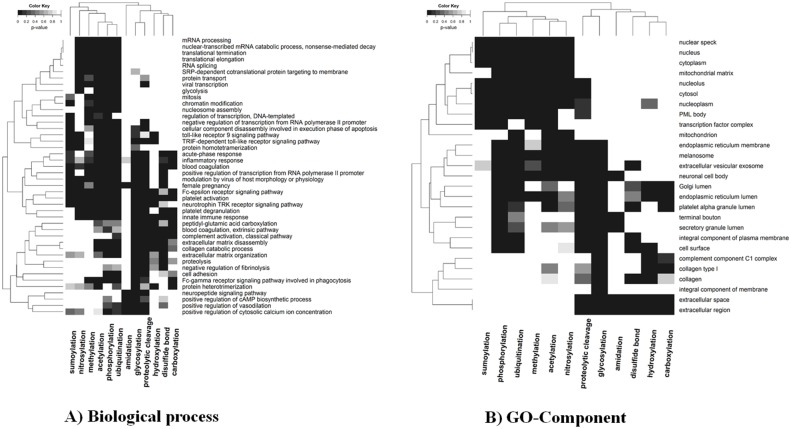
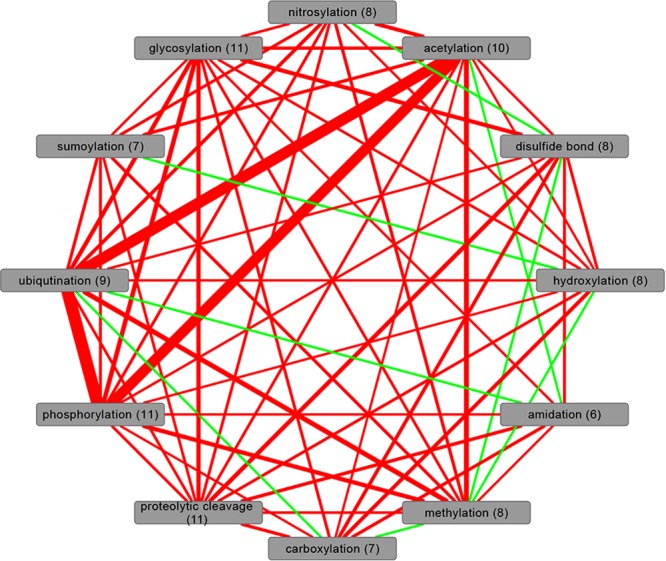
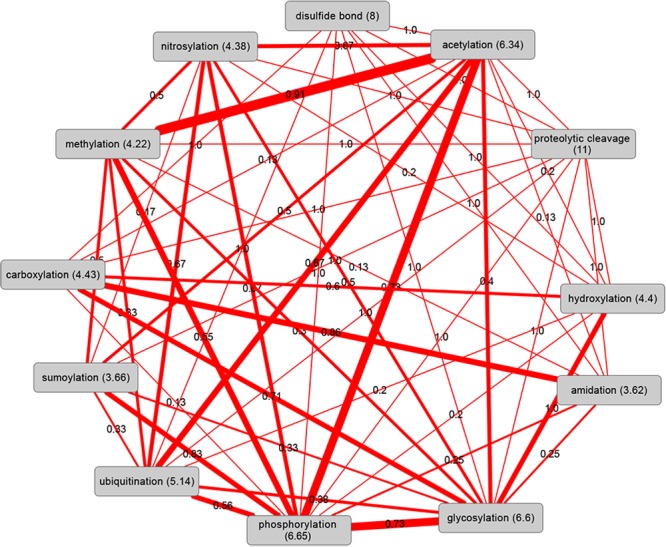
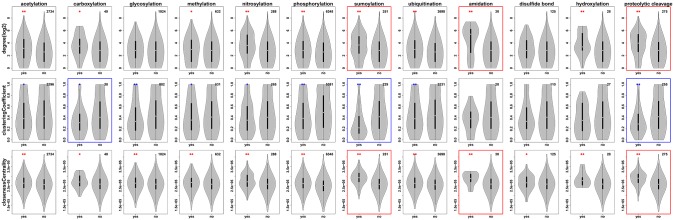
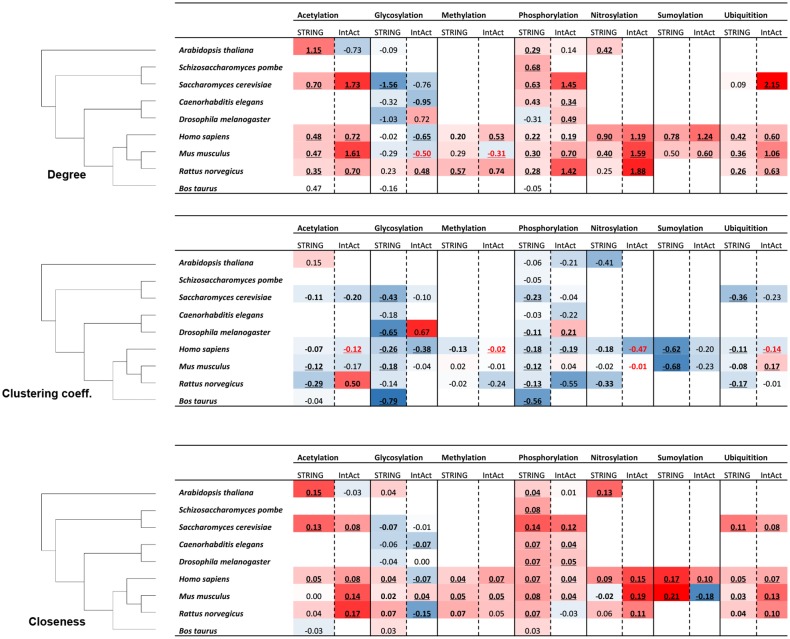
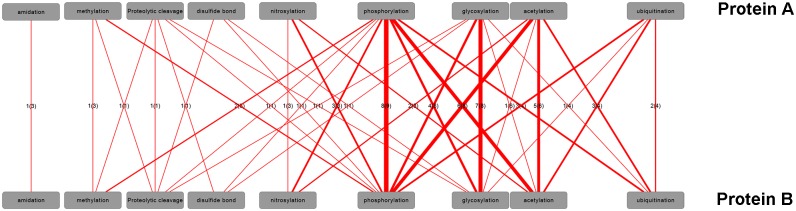
Among other effects, post-translational modifications (PTMs) have been shown to exert their function via the modulation of protein-protein interactions. For twelve different main PTM-types and associated subtypes and across 9 diverse species, we investigated whether particular PTM-types are associated with proteins with specific and possibly "strategic" placements in the network of all protein interactions by determining informative network-theoretic properties. Proteins undergoing a PTM were observed to engage in more interactions and positioned in more central locations than non-PTM proteins. Among the twelve considered PTM-types, phosphorylated proteins were identified most consistently as being situated in central network locations and with the broadest interaction spectrum to proteins carrying other PTM-types, while glycosylated proteins are preferentially located at the network periphery. For the human interactome, proteins undergoing sumoylation or proteolytic cleavage were found with the most characteristic network properties. PTM-type-specific protein interaction network (PIN) properties can be rationalized with regard to the function of the respective PTM-carrying proteins. For example, glycosylation sites were found enriched in proteins with plasma membrane localizations and transporter or receptor activity, which generally have fewer interacting partners. The involvement in disease processes of human proteins undergoing PTMs was also found associated with characteristic PIN properties. By integrating global protein interaction networks and specific PTMs, our study offers a novel approach to unraveling the role of PTMs in cellular processes.


Conflict of interest statement

The authors have declared that no competing interests exist.

Figures

Figure 1
Figure 1. Heatmap of significant A) biological process and B) GO-Component terms across all studied PTM-types.
The top five GO-terms were included that were found significantly enriched for each PTM-type. Each element in the heat map (Euclidean distance hierarchical clustering, average linkage) represents the grey-scale-encoded p-value, in which a particular combination of PTM-type and GO-term was found significantly enriched. The combined whole UniProtKB-GOA for all the selected species was used as the background set, Fisher’s exact test with FDR correction was used for the enrichment analysis, and the p-value (FDR) threshold indicating significance was set to 0.01.
Figure 2
Figure 2. Co-existence network of PTM-types in the proteome of Homo sapiens.
Nodes represent the protein sets associated with the different PTM-types. Edge width was set proportionally to the Jaccard index indicating the overlap between the different protein sets. Edge colors indicate significance with red highlighting PTM-pairs whose overlap was found significant based on Fisher’s exact test with FDR-adjusted p-value threshold set to 0.01, and green otherwise. Numbers in parentheses are the counts of significant “red” co-existence edges to other PTM-types.
Figure 3
Figure 3. Significant co-existence pairs of PTM-types across all selected species.
Edge width was set proportionally to the number of species in which a particular PTM pair was found to occur more frequently than expected (see legend to Fig. 2) at significance levels of FDR-corrected p-values<0.01. The values on the edges indicate the number of species with significant co-existence normalized by the number of common species between each pair of PTM-types as not all PTM-types are present in all species based on our filtering criteria (see Methods). Numbers in parentheses are the normalized counts of significant “red” co-existence edges to other PTM-types.
Figure 4
Figure 4. Protein interaction network properties of proteins associated with different PTM-types in Homo sapiens.
The network property values of proteins annotated to undergo a particular PTM-type or not are shown by violin plots. The number at the top right corner of each graph represents the number of proteins with the corresponding PTM-type and valid network property definitions in Homo sapiens. Protein interactions were taken from the STRING database. The total numbers of proteins and associated number of interactions in Homo sapiens with confidence score>=0.9 were 8,949 and 71,153, respectively. The red (blue) asterisks at the top of violin plot represents the corresponding PTM group has a significantly higher (lower) median value compared to the non-PTM group (*: p-value 0.05, **: p-value 0.01) by Mann-Whitney test with FDR correction. The top 3 PTMs which have high percentage of median difference between PTM group and non-PTM group for each network property are highlighted with red (increased) or blue (decreased) margin.
Figure 5
Figure 5. Degree, clustering coefficient, closeness centrality analysis for proteins with different PTM-types in each considered species and associated high-confidence STRING and IntAct PIN.
The species are ordered according to their phylogenetic relationships as shown on the left. For every PTM-type, the log-2 of fold difference value for the degree/clustering coefficient/closeness centrality value relative to the respective value associated with proteins not carrying this particular PTM-type are given for PINs based on STRING and IntAct, respectively. Color scale indicates increased (red) or decreased (blue) values in the PTM-set relative to the non-PTM-set with symmetric color intervals (i.e. full color saturation based on the maximal absolute increase or decrease fold difference observed across all values in the table.) Bold-font (underlined) fold-changes indicate significant fold-changes at p<0.05 (p<0.01) by Mann-Whitney test with FDR correction, the values in red or blue text represent significantly higher or lower network properties, which are inconsistent with the background color based on mean (not median) values. PTM-types “carboxylation”, “proteolytic cleavage”, “hydroxylation”, and “disulfide bond” are not included in this analysis as associated numbers were available for Homo sapiens only.
Figure 6
Figure 6. Pairwise interactions of proteins carrying different PTM-types (one-PTM-type-only dataset, see Methods).
Number of species with statistically increased frequency of protein-protein interactions (designated as protein A and B, respectively) carrying the respective PTM-types. Linewidth is set proportional to the number of species (indicated as edge labels), which exhibit significant interactions of PTM-types carried by interacting proteins. The value in the parentheses corresponds to the number of common species with available PTM and PIN information. The contingency table for the Fisher exact test contained the respective counts for number of proteins associated with a particular PTM-pair versus all alternative pairings and whether they have been reported to interact or not with FDR-corrected p-value <0.01. Note that the counts of pairwise interactions between protein A and B are by definition symmetric. Hence, labels were added to one direction only. Sumoylation, hydroxylation, and carboxylation were left out because no related significant interactions were found.

Similar articles

Cited by

References

    1. Lodish H, Berk A, Zipursky SL, Matsudaira P, Baltimore D, et al. (2000) Molecular cell biology.
    1. Human Genome Sequencing Consortium (2004) Finishing the euchromatic sequence of the human genome. Nature 431: 931–945. 10.1038/nature03001 - DOI - PubMed
    1. Jensen ON (2004) Modification-specific proteomics: characterization of post-translational modifications by mass spectrometry. Curr Opin Chem Biol 8: 33–41. 10.1016/j.cbpa.2003.12.009 - DOI - PubMed
    1. Deribe YL, Pawson T, Dikic I (2010) Post-translational modifications in signal integration. Nat Struct Mol Biol 17: 666–672. 10.1038/nsmb.1842 - DOI - PubMed
    1. Zhao S, Xu W, Jiang W, Yu W, Lin Y, et al. (2010) Regulation of cellular metabolism by protein lysine acetylation. Science 327: 1000–1004. 10.1126/science.1179689 - DOI - PMC - PubMed

LinkOut - more resources