. 2015 Feb 18;10(2):e0117677.
doi: 10.1371/journal.pone.0117677. eCollection 2015.

A cell-permeable fluorescent polymeric thermometer for intracellular temperature mapping in mammalian cell lines

Affiliations

A cell-permeable fluorescent polymeric thermometer for intracellular temperature mapping in mammalian cell lines

Teruyuki Hayashi et al. PLoS One. .

Abstract

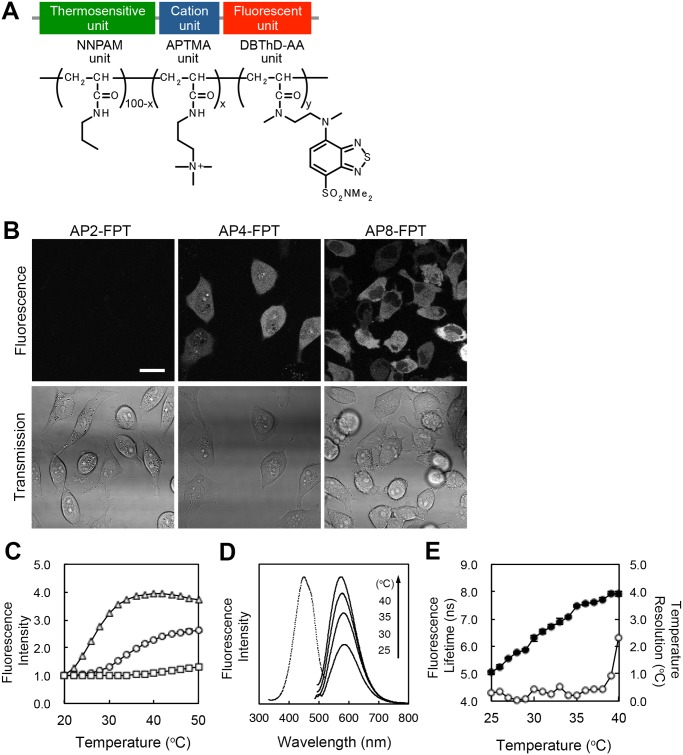
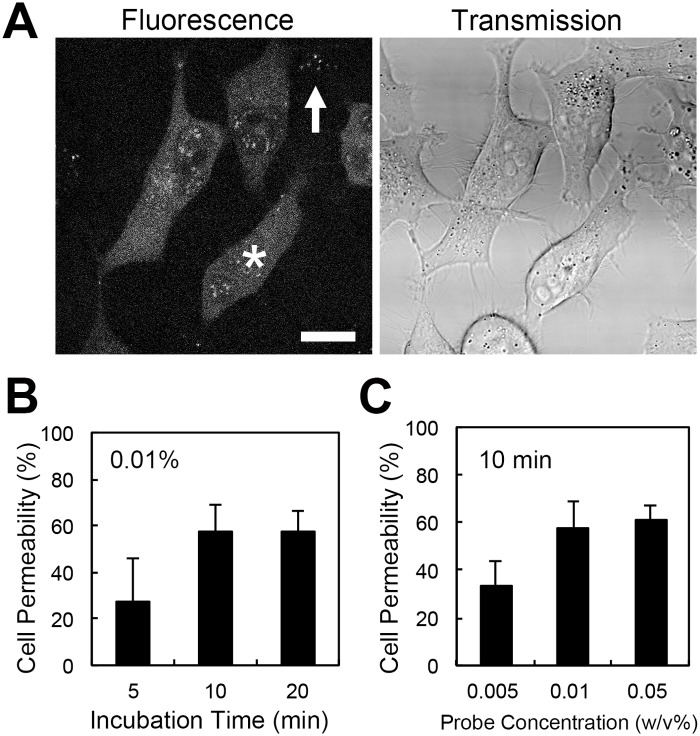
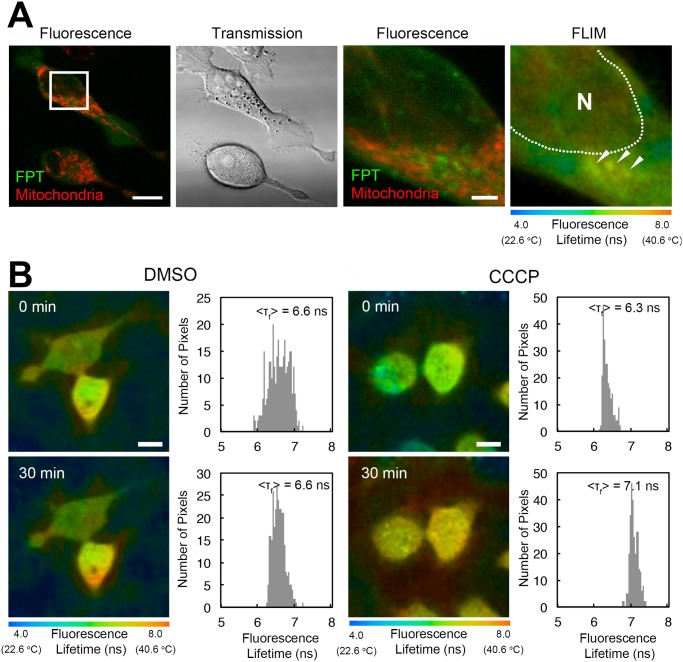
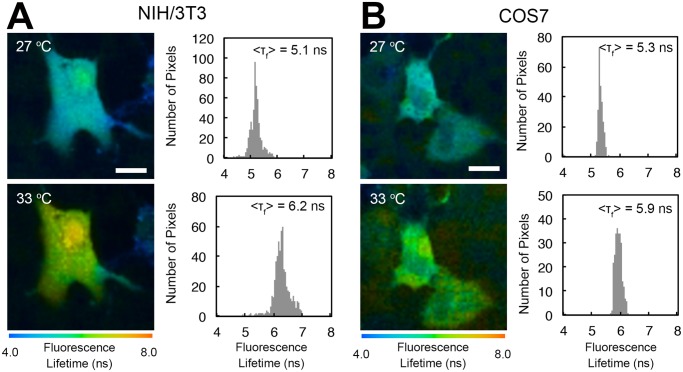
Changes in intracellular temperatures reflect the activity of the cell. Thus, the tool to measure intracellular temperatures could provide valuable information about cellular status. We previously reported a method to analyze the intracellular temperature distribution using a fluorescent polymeric thermometer (FPT) in combination with fluorescence lifetime imaging microscopy (FLIM). Intracellular delivery of the FPT used in the previous study required microinjection. We now report a novel FPT that is cell permeable and highly photostable, and we describe the application of this FPT to the imaging of intracellular temperature distributions in various types of mammalian cell lines. This cell-permeable FPT displayed a temperature resolution of 0.05°C to 0.54°C within the range from 28°C to 38°C in HeLa cell extracts. Using our optimized protocol, this cell-permeable FPT spontaneously diffused into HeLa cells within 10 min of incubation and exhibited minimal toxicity over several hours of observation. FLIM analysis confirmed a temperature difference between the nucleus and the cytoplasm and heat production near the mitochondria, which were also detected previously using the microinjected FPT. We also showed that this cell-permeable FPT protocol can be applied to other mammalian cell lines, COS7 and NIH/3T3 cells. Thus, this cell-permeable FPT represents a promising tool to study cellular states and functions with respect to temperature.


Conflict of interest statement

Competing Interests: The authors have declared that no competing interests exist.

Figures

Fig 1
Fig 1. Cell-permeable and highly photostable FPTs for intracellular temperature mapping.
A) Chemical structure of the cell-permeable fluorescent polymeric thermometer (FPT). The original name of each unit is described in the main text. Numbers at each unit indicate the proportion of each unit in the copolymer. B) Confocal fluorescence (top) and transmission microscopy images (bottom) of HeLa cells treated with the FPTs. Scale bar = 20 µm. C) Temperature-dependent changes in the fluorescence intensity of the cell-permeable AP2-FPT (triangle), AP4-FPT (circle) and AP8-FPT (square) in HeLa cell extracts. The vertical bars (behind the plots) indicate the s.d. based on triplicate measurements. The fluorescence intensities were normalized at 20°C. D) Fluorescence spectra of AP4-FPT in HeLa cell extract. An excitation spectrum (dotted, at 40°C) was obtained from emissions at 573 nm. Emission spectra (solid) were obtained with an excitation at 450 nm. E) Temperature-dependent changes in the fluorescence lifetime of the AP4-FPT (solid circle) and the temperature resolution (open circle) in HeLa cell extracts. The vertical bars (behind the plots) indicate the s.d. based on triplicate measurements.
Fig 2
Fig 2. Optimization of the experimental conditions to introduce the cell-permeable FPT into HeLa cells.
A) Confocal fluorescence and transmission microscopy images of living HeLa cells treated with the cell-permeable FPT. The FPT was distributed throughout the cytoplasm and the nucleus in most cells (a representative cell is indicated by an asterisk). Some cells displayed a punctate pattern of fluorescence (indicated by an arrow). Scale bar = 10 µm. B) The incorporation efficiency of the cell-permeable FPT was plotted against the duration after treatment with a solution containing 0.01 w/v% FPT in 5 w/v% glucose. C) The concentration-dependence of the incorporation efficiency of the FPT into cells. HeLa cells were treated with the indicated concentration of FPT in 5 w/v% glucose for 10 min. The vertical bars indicate the s.d. based on three independent experiments.
Fig 3
Fig 3. Effect of the cell-permeable FPT on cell proliferation and cell viability in HeLa cells.
A) Cell proliferation was determined by direct cell counting at the indicated time intervals after treatment with (solid circle) or without (open circle) 0.01 w/v% FPT. The Y-axis indicates the cell number relative to the number at 1 h after incubation. B) Cell viability was determined by staining with propidium iodide (PI) as a marker of cell death at 1, 3 or 6 h after treatment with 0.01 w/v% FPT. The percentages of cells lacking PI-staining out of all counted cells are shown. The vertical bars indicate the s.d. based on three independent experiments.
Fig 4
Fig 4. Temperature imaging of living HeLa cells via FLIM using the cell-permeable FPT.
A, B) Fluorescence lifetime images of the FPT (A) and histograms of the fluorescence lifetime in cells (B). The temperature of the culture medium is indicated in each image. <τf> indicates the average fluorescence lifetime in cells shown in A. Scale bars = 10 µm.
Fig 5
Fig 5. Temperature mapping of living HeLa cells.
A) Confocal fluorescence images and fluorescence lifetime images of the cell-permeable FPT in a HeLa cell. N indicates the nucleus (the area of the nucleus is indicated by a dotted line). B) Histograms of the fluorescence lifetime in the nucleus (red) and in the cytoplasm (blue) in a cell in A. C) Histogram of the temperature difference between the nucleus and the cytoplasm (n = 49). The temperature difference (<ΔT>) was calculated by subtracting the average temperature of the cytoplasm from that of the nucleus. The temperature of the medium was maintained at 30°C. Scale bar = 10 µm.
Fig 6
Fig 6. Heat production by the mitochondria in living HeLa cells.
A) Confocal fluorescence images of the cell-permeable FPT (green) and MitoTracker Deep Red FM (red), and a transmitted light image, and a FLIM image of HeLa cells. A square in the leftmost image indicates the region of interest, of which fluorescence lifetime was analyzed (in the rightmost figure). Arrowheads in the FLIM image denote local heat production, and N indicates the nucleus (the area of the nucleus is indicated by a dotted line). The temperature of the medium was maintained at 30°C. Scale bars = 10 μm (for the leftmost fluorescence image and transmission image) or 2 µm (for the enlarged fluorescence image at the second from the right and the FLIM image). B) An increase in the intracellular temperature after the inhibition of ATP synthesis by the uncoupler CCCP. FLIM images and histograms of the fluorescence lifetime of cells in the field of view after a treatment of control DMSO (left column) and CCCP (right column). Scale bars = 10 μm.
Fig 7
Fig 7. Incorporation efficiency of the cell-permeable FPT into NIH/3T3 and COS7 cells.
A, C) Representative confocal fluorescence images of NIH/3T3 cells (A) and COS7 cells (C) treated with 0.02 w/v% FPT. Scale bar = 10 µm. B, D) The concentration-dependent incorporation efficiency of FPT in NIH/3T3 cells (B) and COS7 cells (D).
Fig 8
Fig 8. Temperature imaging of living NIH/3T3 and COS7 cells via FLIM using the cell-permeable FPT.
A, B) FLIM images and histograms of the fluorescence lifetime of FPT in NIH/3T3 cells (A) and COS7 cells (B). The temperature of the culture medium is indicated in the FLIM images. <τf> indicates the average fluorescence lifetime of cells in the field of view. Scale bars = 10 µm.

References

    1. Somero GN (1995) Proteins and temperature. Annu Rev Physiol 57: 43–68. - PubMed
    1. Inada N, Uchiyama S (2013) Methods and benefits of imaging the temperature distribution inside living cells. Imaging Med 5: 303–305.
    1. Brites CDS, Lima PP, Silva NJO, Millán A, Amaral VS, et al. (2012) Thermometry at the nanoscale. Nanoscale 4: 4799–4829. 10.1039/c2nr30663h - DOI - PubMed
    1. Jaque D, Vetrone F (2012) Luminescence nanothermometry. Nanoscale 4: 4301–4326. 10.1039/c2nr30764b - DOI - PubMed
    1. Wang X-d, Wolfbeis OS, Meier RJ (2013) Luminescent probes and sensors for temperature. Chem Soc Rev 42: 7834–7869. 10.1039/c3cs60102a - DOI - PubMed

Publication types