. 2015 Feb 18:6:6282.
doi: 10.1038/ncomms7282.

RIPK3 promotes cell death and NLRP3 inflammasome activation in the absence of MLKL

Affiliations

RIPK3 promotes cell death and NLRP3 inflammasome activation in the absence of MLKL

Kate E Lawlor et al. Nat Commun. .

Abstract

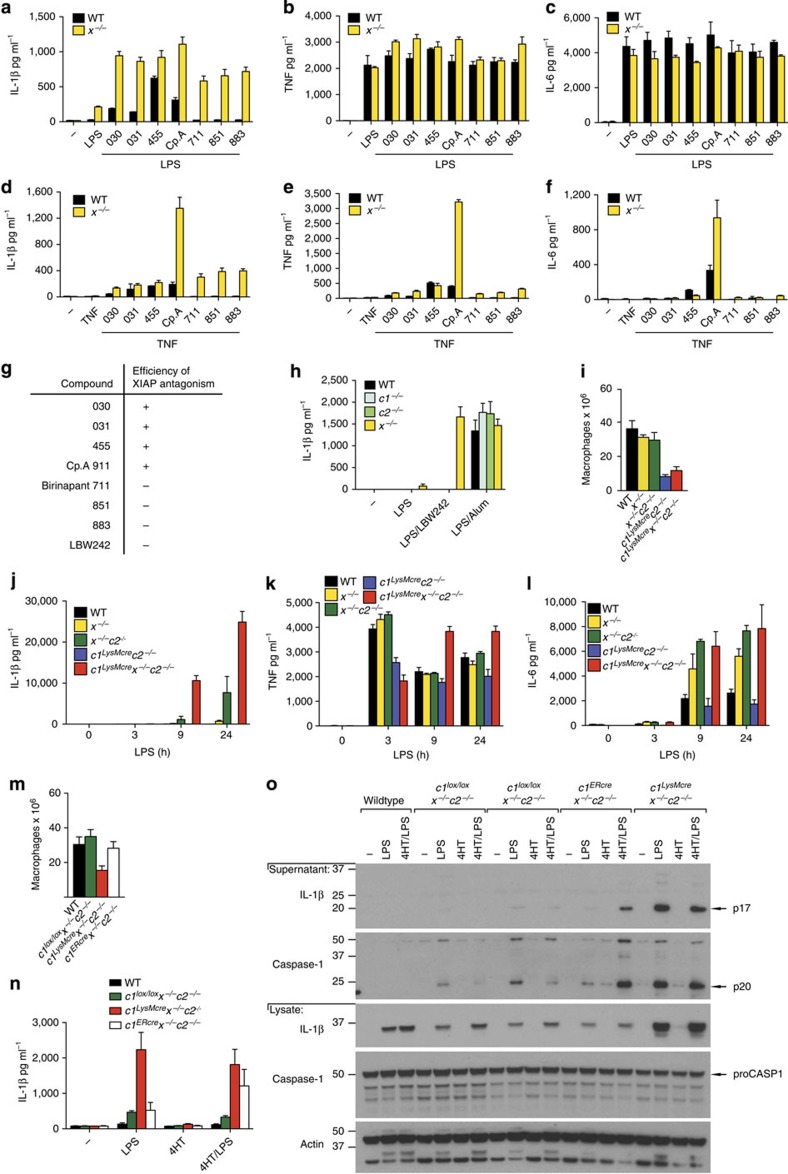
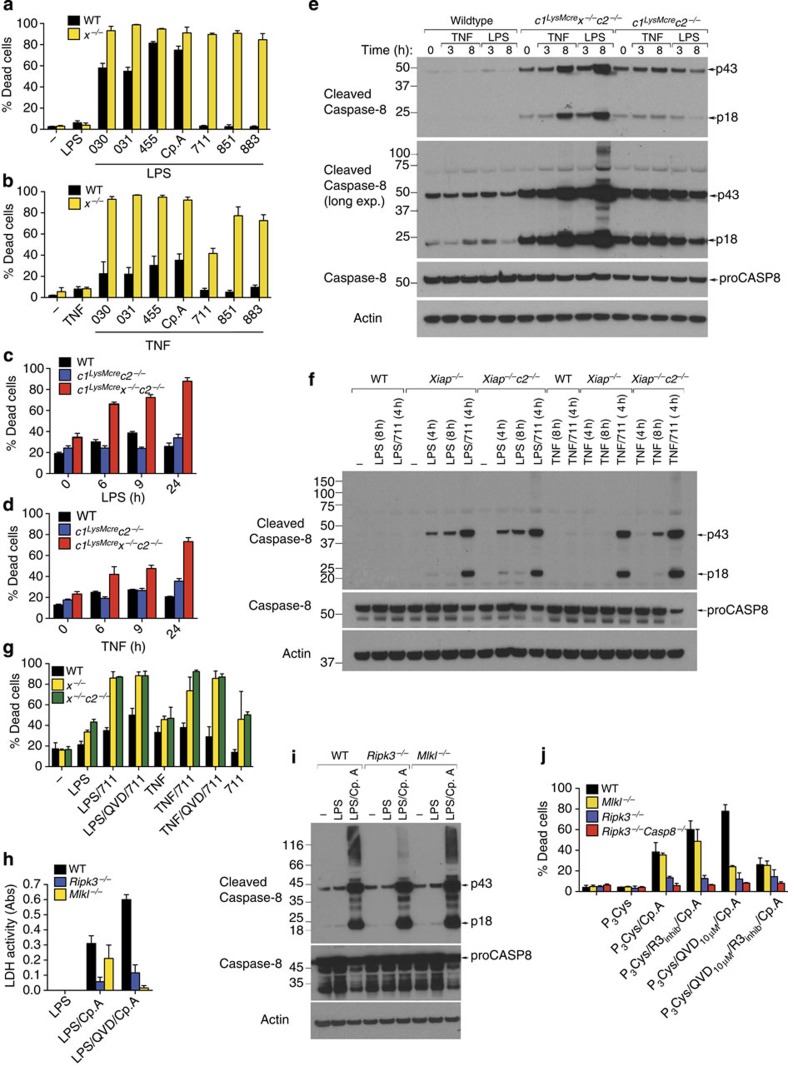
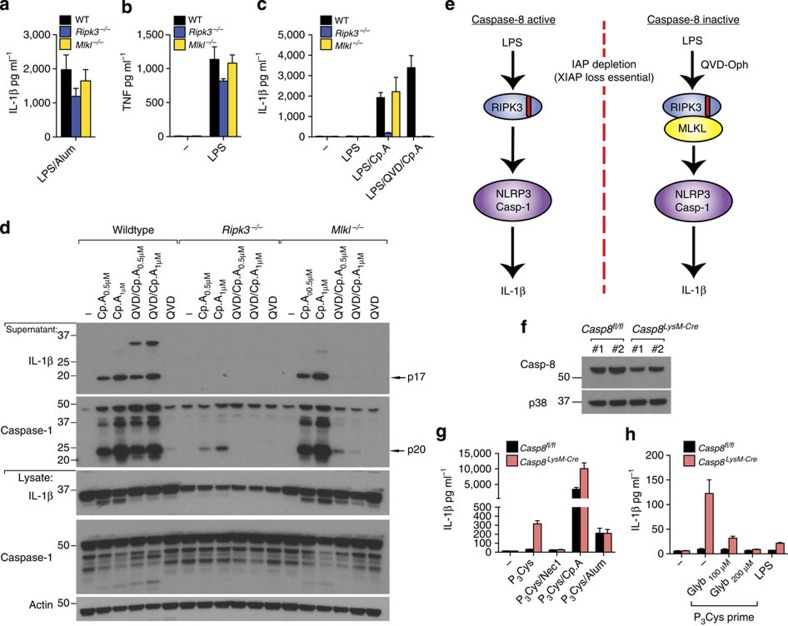
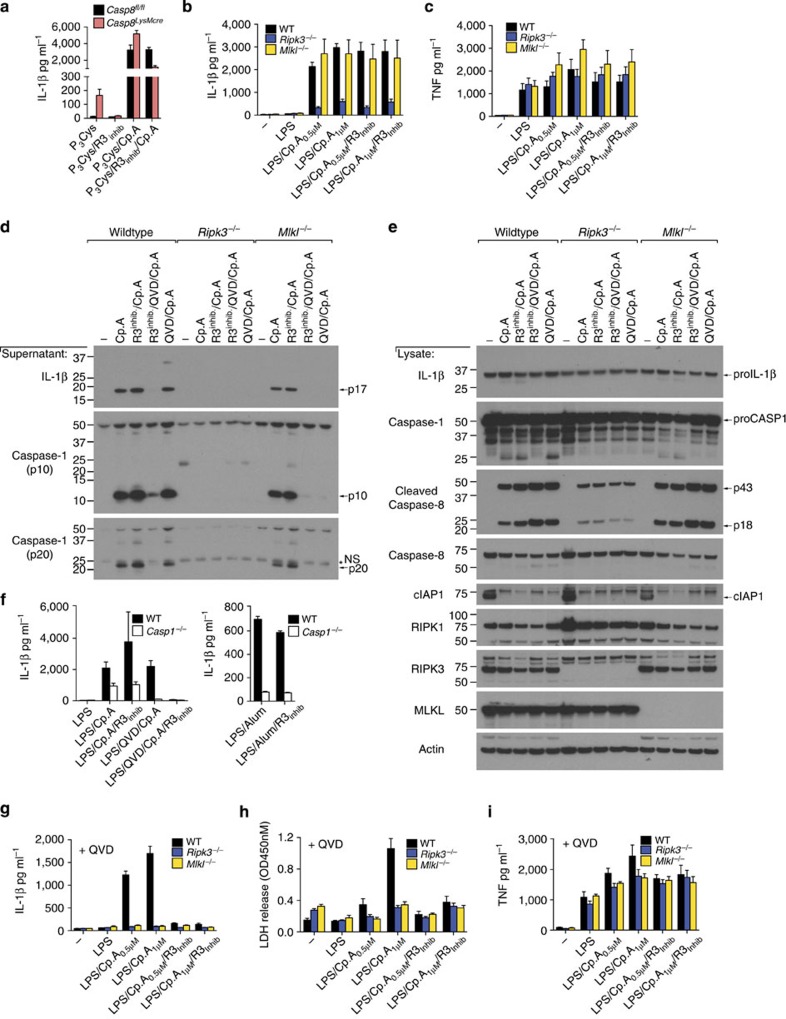
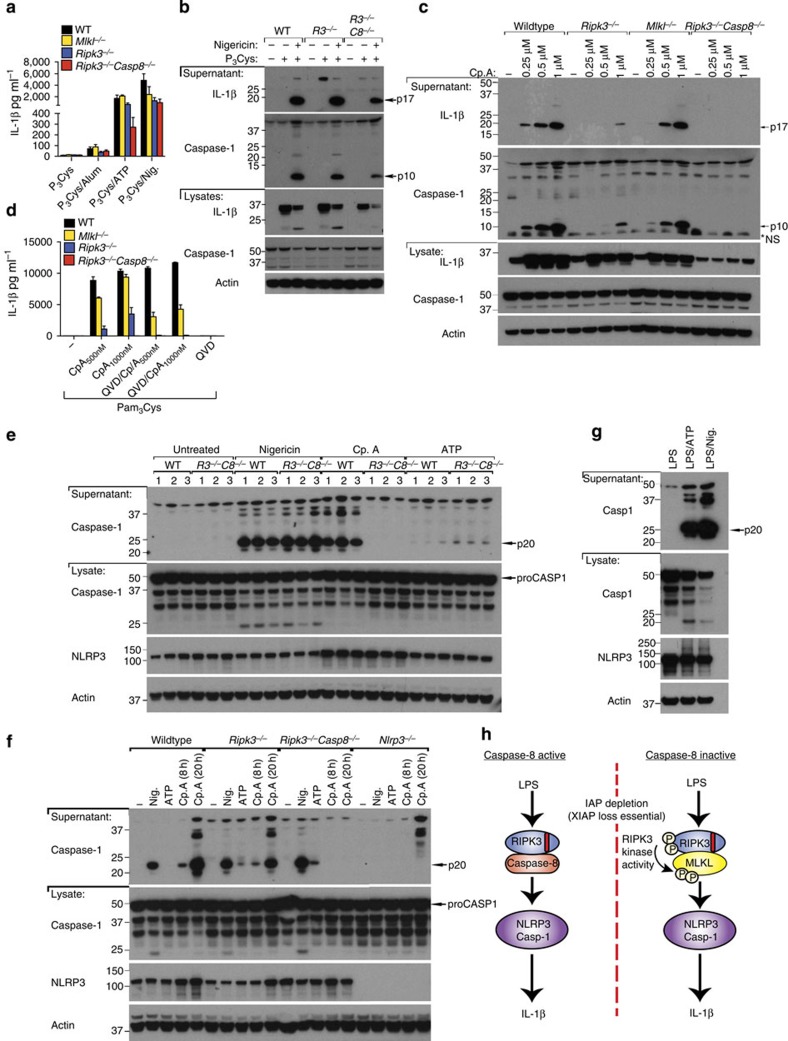
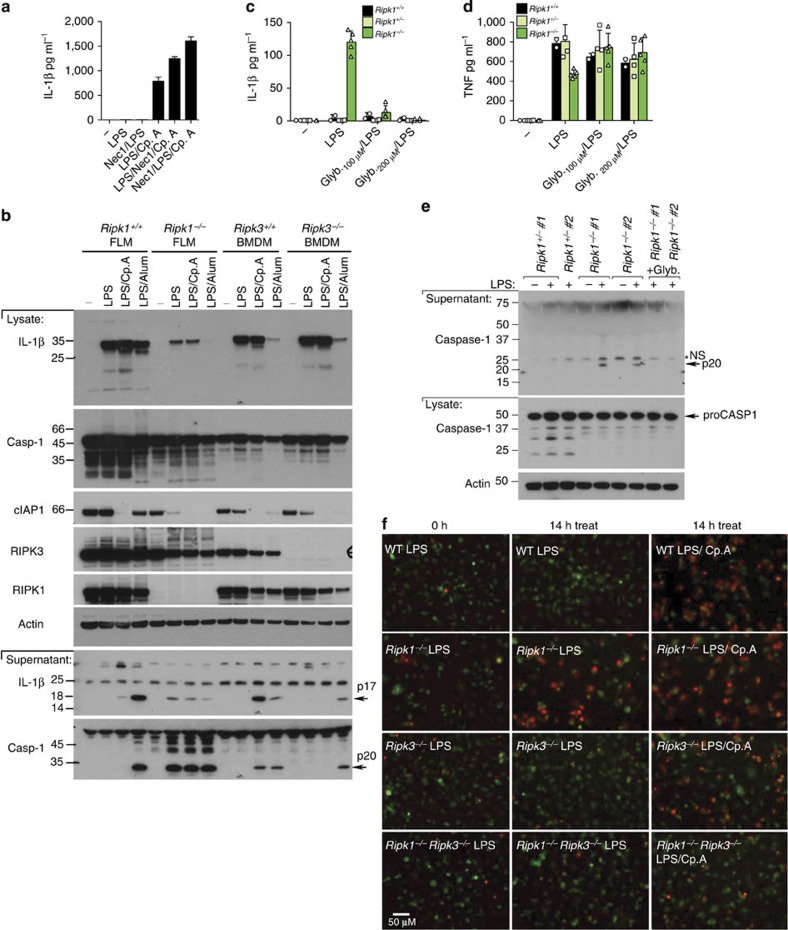
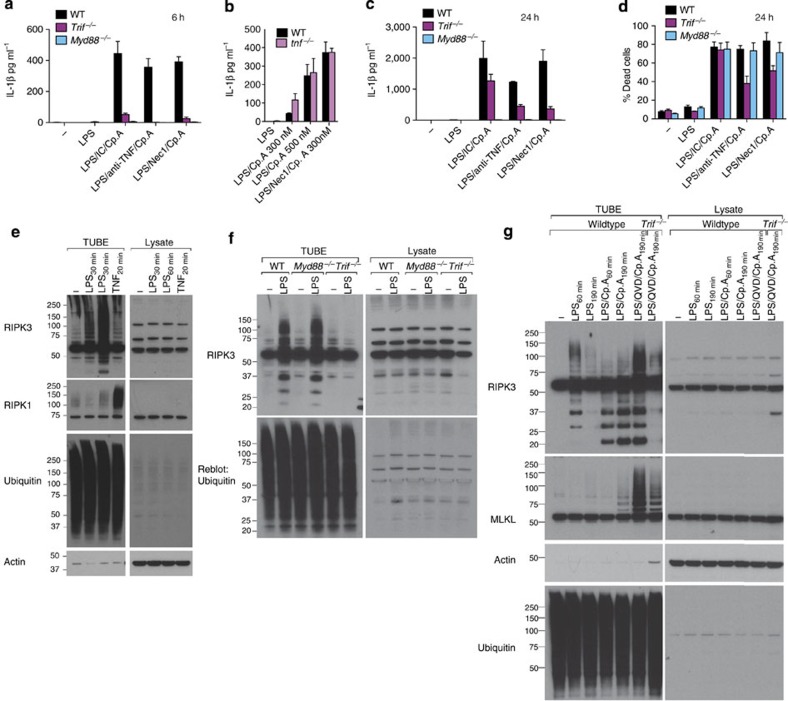
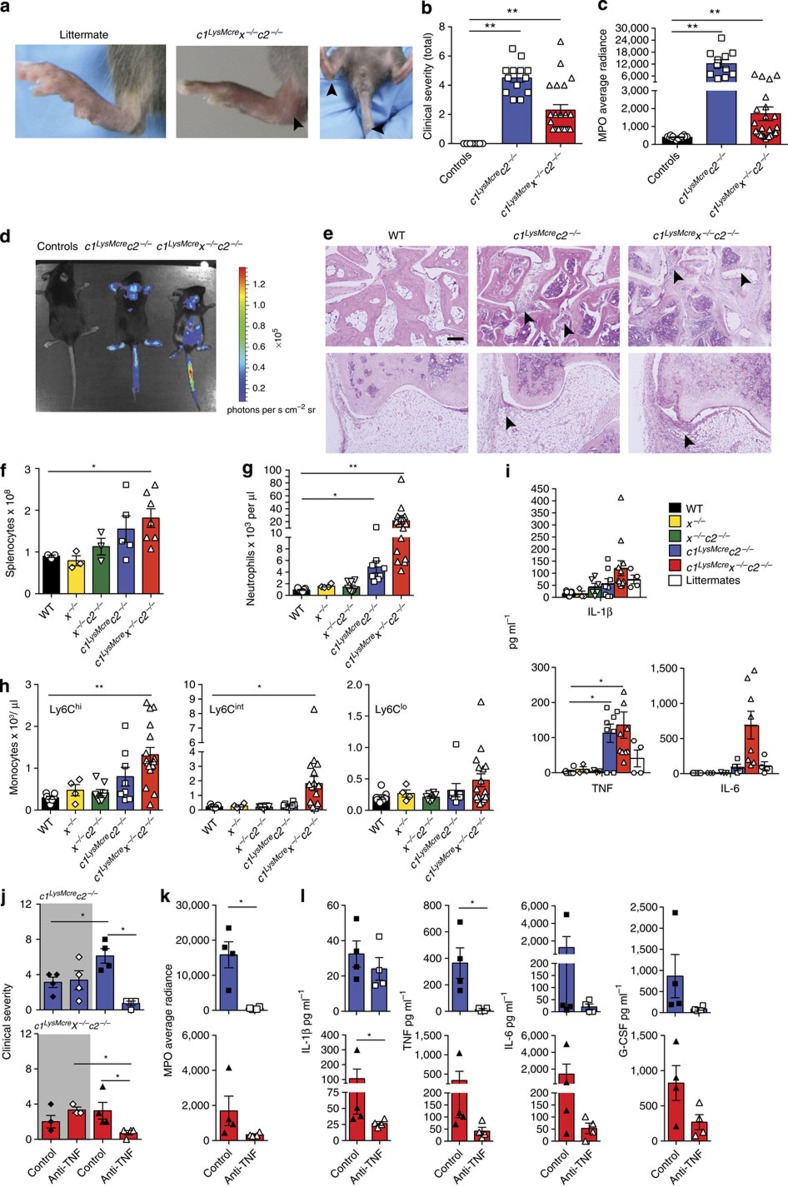
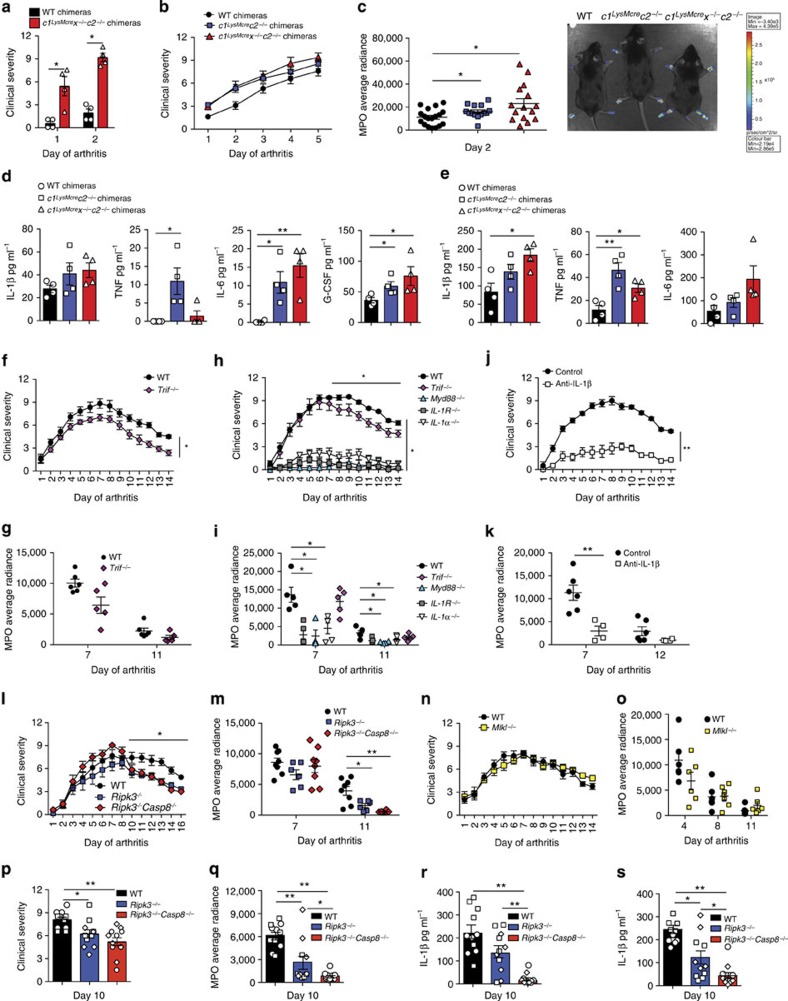
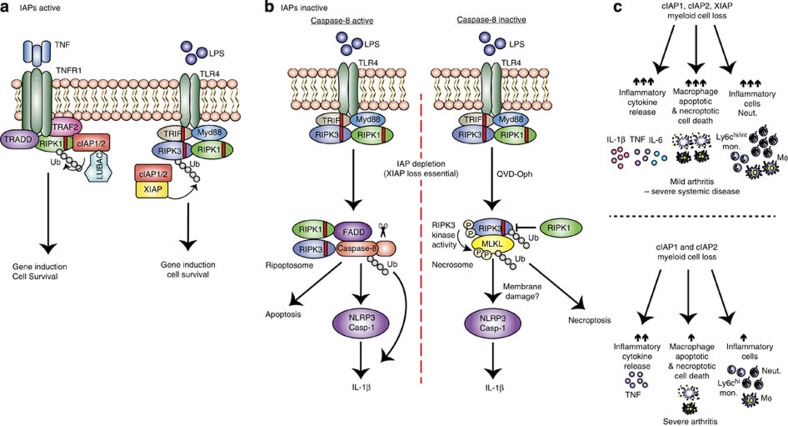
RIPK3 and its substrate MLKL are essential for necroptosis, a lytic cell death proposed to cause inflammation via the release of intracellular molecules. Whether and how RIPK3 might drive inflammation in a manner independent of MLKL and cell lysis remains unclear. Here we show that following LPS treatment, or LPS-induced necroptosis, the TLR adaptor protein TRIF and inhibitor of apoptosis proteins (IAPs: X-linked IAP, cellular IAP1 and IAP2) regulate RIPK3 and MLKL ubiquitylation. Hence, when IAPs are absent, LPS triggers RIPK3 to activate caspase-8, promoting apoptosis and NLRP3-caspase-1 activation, independent of RIPK3 kinase activity and MLKL. In contrast, in the absence of both IAPs and caspase-8, RIPK3 kinase activity and MLKL are essential for TLR-induced NLRP3 activation. Consistent with in vitro experiments, interleukin-1 (IL-1)-dependent autoantibody-mediated arthritis is exacerbated in mice lacking IAPs, and is reduced by deletion of RIPK3, but not MLKL. Therefore RIPK3 can promote NLRP3 inflammasome and IL-1β inflammatory responses independent of MLKL and necroptotic cell death.


Conflict of interest statement

J.S. and D.L.V. are on the Scientific Advisory Board of TetraLogic Pharmaceuticals. Y.M., C.A.B. and S.M.C. are employees of TetraLogic Pharmaceuticals. All other authors declare no other competing financial interests.

Figures

Figure 1
Figure 1. XIAP is required to repress LPS- and TNF-induced IL-1β secretion.
(af) WT and Xiap-deficient (x−/−) macrophages were pre-incubated with or without (ac) LPS (20 ng ml−1) or (df) human Fc-TNF (100 ng ml−1) for 2–3 h and cultured with or without IAP antagonists of differing IAP specificities (see g). After 24 h, cell supernatants were assayed for (a,d) IL-1β, (b,e) TNF and (c,f) IL-6 levels by ELISA. n=3 mice; Data are represented as mean+s.e.m., from one of three experiments. (g) Efficiency of functional XIAP antagonism by IAP antagonist compounds (+, high; −,low). (h) WT, cIAP1−/− (c1−/−), cIAP2−/− (c2−/−) and Xiap−/− (x−/−) BMDM were primed with LPS (20 ng ml−1) for 3 h and cultured with the IAP antagonist LBW242 (20 μM) or alum (320 μg ml−1) for a further 6 h. Secreted IL-1β was measured in supernatants by ELISA. n=3 mice; mean+s.e.m. (i) Yield of macrophages from WT and IAP mutant bone marrow after 6 days of culture with L929 cell conditioned media. n=3–6 mice per genotype, mean+s.e.m. (jl) WT and IAP mutant macrophages were stimulated with LPS (20 ng ml−1) for up to 24 h, and (j) IL-1β, (k) TNF and (l) IL-6 levels were assayed in supernatants by ELISA. n=3–4 mice, data are represented as mean+s.e.m., one of three experiments. (m) Yield of WT, c1lox/loxx−/−c2−/−, c1LysMcrex−/−c2−/− and c1ERcrex−/−c2−/− bone marrow macrophages after 6 days of culture with L929 cell conditioned media. n=3–6 mice per genotype, mean+s.e.m. (n,o) WT, c1lox/loxx−/−c2−/−, c1LysMcrex−/−c2−/− and c1ERcrex−/−c2−/− macrophages were pulsed for 16 h with 4′-hydroxy-tamoxifen (4HT 1000, nM) and then rested for 10 h prior to stimulation with or without LPS (50 ng ml−1) for a further 8 h. (n) Secreted IL-1β was measured in supernatants by ELISA, n=3 mice per group; c1LysMcrex−/−c2−/− (n=2), mean+s.d., one of three experiments, and (o) IL-1β and caspase-1 activation assayed by immunoblot of supernatants and lysates. Representative blot from the analysis of 4 c1ERcrex−/−c2−/− mice. Full-size immunoblots are presented in Supplementary Fig. 9.
Figure 2
Figure 2. XIAP limits LPS- and TNF-induced apoptosis and necroptosis in macrophages.
(a,b) WT and x−/− BMDM were pre-incubated with or without (a) LPS (20 ng ml−1) or (b) TNF (100 ng ml−1) for 2–3 h and were cultured with IAP antagonists of differing IAP specificities (500 nM; see Fig. 1g) as indicated for 24 h. Cell death was assessed by flow cytometric analysis of PI uptake. Data are presented as the % Dead cells, n=3 mice, mean+s.e.m., one of two experiments. (c,d) WT, c1LysMcrec2−/− or c1LysMcrex−/−c2−/− BMDM were stimulated with (c) LPS (20 ng ml−1) or (d) TNF (100 ng ml−1) and cell death (% Dead cells) measured by flow cytometric analysis of PI uptake. n=3 mice, mean+s.e.m., one of three experiments. (e) WT, c1LysMcrec2−/− or c1LysMcrex−/−c2−/− BMDM were stimulated with LPS (20 ng ml−1) or TNF (100 ng ml−1) and lysates were analyzed for caspase-8 processing by immunoblot as indicated. Representative of one of two experiments. Full-size immunoblots are presented in Supplementary Fig. 10. (f) WT, x−/− and x−/−c2−/− BMDM were primed with LPS (20 ng ml−1) or TNF (100 ng ml−1) and cultured with cIAP1/2-selective antagonist, 711 (500 nM), as indicated, and lysates analyzed for caspase-8 processing by immunoblot. Representative of one of three experiments. Full-size immunoblots are presented in Supplementary Fig. 10. (g) WT, x−/−, or x−/−c2−/− BMDM were primed for 3 h with LPS (20 ng ml−1) or TNF (100 ng ml−1), and as indicated cultured with the cIAP1/2-selective antagonist, 711 (500 nM), in the presence or absence of Q-VD-OPh (20 μM, added in the last 20 min of priming). Cell death was measured after 24 h by PI uptake. n=3 mice, mean+s.e.m., one of two experiments. (h) WT, Mlkl−/− and Ripk3−/− BMDM were primed for 3 h with LPS and treated with Q-VD-OPh (20 μM) as indicated for the final 20 min prior to addition of Cp.A (500 nM). Cell death was measured by assaying lactate dehydrogenase (LDH) release (n=3 mice per genotype). (i) Cell lysates of WT, Mlkl−/− and Ripk3−/− BMDM primed with LPS for 3 h and treated with Cp.A (500 nM) for 6 h were analyzed by immunoblot. Representative immunoblot analysis of three mice of each genotype. Full-size immunoblots are presented in Supplementary Fig. 10. (j) WT, Ripk3−/−, Mlkl−/− and Ripk3−/−Caspase-8−/− BMDM were primed with Pam3Cys (2.5 μg ml−1) for 3 h, treated with Q-VD-OPh in the final 20 min of priming, and Cp.A added, as specified, for 24 h. In some cases RIP3 kinase inhibitor (R3 inhib, GSK872; 1 μM) was added 20 min prior to the addition of Cp.A. Cell death was measured by PI uptake and flow cytometric analysis (% Dead cells). n=3 mice, mean+s.e.m.
Figure 3
Figure 3. RIPK3 activates caspase-1 independent of MLKL unless caspase-8 is inhibited.
(ac) WT, Mlkl−/− and Ripk3−/− BMDM were primed with LPS (20 ng ml−1) for 3 h and cultured with Q-VD-OPh (20 μM), where indicated, which was added in the last 20 min of priming. Cells were then stimulated with Cp.A (500 nM) or alum (300 μg ml−1) for a further 6 h. Supernatants were analyzed for (a,c) IL-1β and (b) TNF by ELISA. n=3 mice per genotype. Data are represented as mean+s.e.m. and are representative of one of three independent experiments. (d) WT, Mlkl−/− and Ripk3−/− BMDM were primed with LPS for 2.5 h. In the last 20 min of priming, cells were incubated with Q-VD-OPh (20 μM) and then cultured with Cp.A (1 μM) for 5 h. Cell supernatants and lysates were analyzed by immunoblot. Representative of one of three experiments. Full-size immunoblots are presented in Supplementary Fig. 11. (e) Schematic depicting how RIPK3 signals IL-1β activation based on the data presented in Figs 1, 2, 3. (f) Lysates from WT (Casp8fl/fl) littermate and caspase-8-deficient (Casp8LysMcre) BMDM (n=2 mice) were subjected to immunoblot to assess efficiency of caspase-8 deletion. Full-size immunoblots are presented in Supplementary Fig. 11. (g) WT littermate and Caspase-8LysMcre BMDM were primed for 3 h with Pam3Cys (2 μg ml−1), and as indicated treated with Nec-1 (50 μM) in the last 20 min of priming. Cells were then exposed to Cp.A (500 nM), as specified, for a further 24 h, after which IL-1β release was measured by ELISA. n=3 mice per genotype, mean+s.e.m. Representative of one of three experiments. (h) WT littermate and Caspase-8LysMcre BMDM were pre-incubated with glyburide for 20 min, as indicated, and cultured with Pam3Cys (2 μg ml−1) or LPS (100 ng ml−1) for 24 h. Cell supernatants were assayed for IL-1β by ELISA. n=4 mice per genotype, mean+s.e.m. Representative of one of two experiments.
Figure 4
Figure 4. RIPK3 kinase activity is not required for MLKL-independent activation of NLRP3.
(a) WT littermate and Caspase-8LysMcre BMDM were primed for 3 h with Pam3Cys (2 μg ml−1), and as indicated RIPK3 inhibitor (R3 inhib GSK872; 1 μM) was added in the last 20 min of priming. Cells were then exposed to Cp.A (500 nM), as specified, for a further 24 h. Levels of IL-1β secretion were measured by ELISA. n=4 mice per genotype, mean+s.e.m. (b,c) WT, Ripk3−/− and Mlkl−/− BMDM were primed for 3 h with LPS (20 ng ml−1) in the absence or presence of RIPK3 inhibitor (R3 inhib; 1 μM), prior to addition of Cp.A for a further 6 h. Supernatants were assayed for (b) IL-1β and (c) TNF by ELISA or death assessed by lactate dehydrogenase (LDH) activity (see Supplementary Fig. 2f). n=3 mice per genotype, mean+s.e.m. (d,e) Cell supernatants (d) and lysates (e) from WT, Mlkl−/− and Ripk3−/− BMDM primed with LPS (3 h) and treated with Q-VD-OPh (20 μM) and R3 inhibitor (1 μM, last 20 min of priming), as indicated, and subsequently treated with Cp.A (1 μM, 5 h) were analyzed by immunoblot as indicated. One of three experiments. Full-size immunoblots are presented in Supplementary Fig. 12. (f) WT and caspase-1−/− BMDM were primed for 3 h with LPS, and as indicated treated with Q-VD-OPh (20 μM) and R3 inhib (1 μM) for the last 20 min of priming. BMDM were then cultured with Cp.A (1 μM) or Alum (300 μg ml−1) for a further 6 h. Culture supernatants were assayed for IL-1β levels by ELISA. n=3 mice, mean+s.e.m., one of two experiments. (gi) WT, Ripk3−/− and Mlkl−/− BMDM were primed for 3 h with LPS (20 ng ml−1) in the presence of Q-VD-OPh (20 μM), and where indicated 1 μM RIPK3 inhibitor (R3 inhib), prior to addition of Cp.A for a further 6 h. Supernatants were assayed for (g) IL-1β and (i) TNF by ELISA, and (h) cell death was measured via an LDH assay. n=3 mice per genotype, mean+s.e.m. *NS, non-specific band.
Figure 5
Figure 5. Deletion of both RIPK3 and caspase-8 abrogates TLR- and Cp.A-induced activation of caspase-1 and IL-1β.
(a) WT, Mlkl−/−, Ripk3−/− and Ripk3−/−Caspase-8−/− BMDM were primed with Pam3Cys for 3 h and incubated with Alum (300 μg ml−1) for 6 h, and ATP (5 mM) or nigericin (10 μM) for 40 min. Supernatants were assayed for IL-1β release. n=3 mice per genotype, mean+s.e.m., one of three experiments. (b) WT, Ripk3−/− and Ripk3−/−Caspase-8−/− BMDM were primed with Pam3Cys for 3 h and cultured with Nigericin as indicated for 40 min. Supernatants and lysates were analyzed by immunoblot. One of two experiments. Full-size immunoblots are presented in Supplementary Fig. 13. (c) WT, Mlkl−/−, Ripk3−/− and Ripk3−/−Caspase-8−/− BMDM were primed with Pam3Cys for 3 h and incubated with increasing concentrations of Cp.A for 24 h and supernatants and lysates were analyzed by immunoblot. One of two experiments. Full-size immunoblots are presented in Supplementary Fig. 13. (d) WT, Mlkl−/−, Ripk3−/− and Ripk3−/−Caspase-8−/− BMDM were primed with Pam3Cys for 3 h, and as indicated Q-VD-OPh (20 μM) for the last 20 min of priming, and then cells were treated where shown with Cp.A for a further 6 h. Supernatants were assayed for IL-1β levels. n=3 mice per genotype; mean+s.e.m., representative of one of three experiments. (e) Unprimed WT and Ripk3−/−Caspase-8−/− BMDM were cultured with Nigericin (10 μM, 2 h), Cp.A (1 μM, 20 h) and ATP (5 mM, 2 h), and supernatants and lysates were analyzed by immunoblot for caspase-1 activation and NLRP3 levels. n=3 mice per genotype (numbered). Full-size immunoblots are presented in Supplementary Fig. 13. (f) Unprimed WT, Ripk3−/−, Ripk3−/−Caspase-8−/− and Nlrp3−/− BMDM were stimulated with Nigericin (10 μM, 2 h), Cp.A (1 μM), and ATP (5 mM, 2 h) as indicated, and supernatants and cell lysates were analyzed by immunoblot. One of three experiments. Full-size immunoblots are presented in Supplementary Fig. 13. (g) WT BMDM were primed with LPS (20 ng ml−1) for 3 h, stimulated with Nigericin or ATP, and lysates analyzed by immunoblot. (h) Schematic depicting how RIPK3 signals NLRP3–caspase-1 and IL-1β activation based on the data presented in Figs 1, 2, 3, 4, 5. *NS, non-specific band.
Figure 6
Figure 6. RIPK1 represses LPS-induced RIPK3 activity.
(a) WT BMDM were either pre-treated for 30 min with Nec-1 (50 μM), or cultured with Nec-1 in the final 30 min of priming with LPS (20 ng ml−1) for 3 h. Cp.A (500 nM) was added, as indicated, and cells were cultured for 6 h. Supernatants were assayed for IL-1β. n=3 mice per group, mean+s.e.m. One of two experiments. (b) WT and Ripk1−/− FLM, and WT and Ripk3−/− BMDM were primed with LPS for 3 h and stimulated with Cp.A (500 nM) or Alum (300 μg ml−1) for a further 6 h, and supernatants and lysates were assayed by immunoblot. Full-size immunoblots are presented in Supplementary Fig. 14. (ce) WT, Ripk1+/− and Ripk1−/− FLDM were treated with glyburide for 20 min and then stimulated with LPS (20 ng ml−1) for 6–8 h. Data shows three to five embryos of each genotype. (c,d) Supernatants were assayed for (c) IL-1β and (d) TNF production. Data symbols represent individual mice from three experiments. (e) Cell lysates and supernatants were blotted for caspase-1 cleavage. n=2 individual mice (numbered). Full-size immunoblots are presented in Supplementary Fig. 14. (f) WT Ripk1+/+, Ripk1−/−, Ripk3−/− and Ripk1−/−Ripk3−/− FLDM were labelled with cell tracker green (green) and cultured with LPS (20 ng ml−1) for 1 h, prior to stimulation with Cp.A, as indicated, and PI addition (red). Cells were imaged from 2h post-LPS addition every 30 min for 14 h. Supplementary Figure 4g shows additional treatments (LPS/Cp.A/QVD) used in this experiment. Representative images of one of three experiments. *NS, non-specific band.
Figure 7
Figure 7. TRIF and IAPs regulate LPS-induced ubiquitylation of RIPK3 and MLKL.
(a) WT, Myd88−/− and Trif−/− BMDM were cultured with neutralizing antibodies to TNF (anti-TNF [XT-22] 20 μg ml−1), isotype control antibodies (IC [GL113] 20 μg ml−1) or Nec-1 (50 μM), and primed for 2 h with LPS, as indicated. Cells were then cultured with Cp.A (500 nM), and IL-1β levels were assayed in supernatants by ELISA at 6 h. n=3 mice per group, mean+s.e.m., representative of one of three experiments. (b) WT and Tnf−/− BMDM were primed for 3 h with LPS, and treated with Nec-1 (50 μM) as indicated. Cells were then cultured with Cp.A (500 nM), and after 6 h IL-1β secretion was assayed by ELISA. n=3 mice per genotype, mean+s.e.m., one of three experiments. (c,d) WT, Myd88−/− and Trif−/− BMDM were cultured with neutralizing antibodies to TNF (anti-TNF [XT-22] 20 μg ml−1), isotype control antibodies (IC [GL113] 20 μg ml−1) or Nec-1 (50 μM), and primed for 2 h with LPS, as indicated. Cells were then cultured with Cp.A (500 nM) for 24 h, and (c) IL-1β levels assayed in supernatants by ELISA and (d) cell death (% Dead cells) assessed by PI and FACS. n=3 mice per group, mean+s.e.m., representative of one of three experiments. (e) WT BMDM were treated with 50 ng ml−1 LPS (30 and 60 min) or 100ng ml−1 TNF (20 min) and ubiquitylated proteins were isolated by TUBE and analyzed by immunoblot. One of two experiments. (f) WT, Myd88−/−, and Trif−/− BMDM were treated with LPS (100 ng ml−1) for 60 min and endogenous ubiquitylated proteins isolated by TUBE and analyzed by immunoblot. One of three experiments. (g) WT and Trif−/− BMDM were pre-incubated with Q-VD-OPh (20 μM) for 40 min, cultured with Cp.A 500 nM and subsequently treated with LPS (50 ng ml−1) for 60 or 190 min as indicated. Endogenous ubiquitylated proteins were isolated by TUBE and analyzed by immunoblot. One of three experiments.
Figure 8
Figure 8. Loss of IAPs in myeloid cells drives TNF-dependent inflammatory joint disease.
(ae) WT, littermate controls and c1LysMcrex−/−c2−/− and c1LysMcrec2−/− mice were monitored for spontaneous inflammatory disease. (a) Photos depicting examples of a normal ankle (littermate) and severe swelling in the ankle and tail of a c1LysMcrex−/−c2−/− mouse. (b) Clinical severity score of swelling and redness (0–3 for severity per limb). Data are the clinical score of individual mice (out of 12). Mean±s.e.m., **P<0.01, Mann–Whitney two-sample rank test. (c) Neutrophil activity assessed by myeloperoxidase (MPO) average radiance of four limbs per mouse, measured using an IVIS spectrum after bioluminescent luminol injection. Data are the mean of individual mice. Mean±s.e.m., **P<0.01, Mann–Whitney two-sample rank test. (d) Representative bioluminescent images of MPO activity in control and indicated mutant mice. (e) Representative histological examples of disease in WT control, and diseased c1LysMcrex−/−c2−/− and c1LysMcrec2−/− ankle (top) and knee (bottom) tissue. Magnification, × 10; scale bar, 100 μM. (f) WT and IAP mutant splenocyte counts. Symbols indicate individual mice and data are the mean±s.e.m. *P<0.05, Student’s two-tailed t-test. (g,h) WT and IAP mutant mice peripheral blood (g) neutrophil and (h) monocyte subset number were analyzed by flow cytometry. Symbols indicate individual mice. Mean±s.e.m., *P<0.05, **P<0.01, Student’s two-tailed t-test. (i) Levels of cytokines, IL-1β, TNF and IL-6 were measured in the serum of WT and IAP mutant mice by ELISA. Symbols indicate individual mice Data show the mean±s.e.m. *P<0.05, Student’s two-tailed t-test. (jl) c1LysMcrex−/−c2−/− and c1LysMcrec2−/− mice were treated with anti-TNF monoclonal antibody (XT-22) or isotype control for 3 weeks, after which (j) clinical severity (grey shading indicates pre-treatment clinical scores) and (k) MPO activity in limbs and (l) serological cytokine levels were assessed. Symbols represent individual mice, mean±s.e.m. *P<0.05, Mann–Whitney two-sample rank test (j,k) or Student’s two-tailed t-test (l).
Figure 9
Figure 9. RIPK3 deficiency, but not MLKL loss, decreases innate K/B × N arthritis chronicity.
(ae) WT, c1LysMcrec2−/− and c1LysMcrex−/−c2−/− BM chimeras were injected with 100 μl K/B × N pathogenic serum, and (a,b) clinical severity of disease (0–3 per limb) was measured; data are represented as mean±s.e.m., (a) n=4–5 mice per group, *P<0.05, (b) n≥11 mice per group (WT versus c1LysMcrex−/−c2−/−, P=0.0196; WT versus c1LysMcrec2−/−, P=0.083). P values were calculated using the Mann–Whitney two-sample rank test. (c) MPO activity was measured in limbs of mice at day 2 of model. Data show individual mouse MPO average radiance, and a representative bioluminescent image of MPO levels in arthritic mice. Mean±s.e.m., *P<0.05, Mann–Whitney two-sample rank test. (d,e) Serum (d) and ankle joint secretions (e) from mice at day 5 of K/B × N arthritis were analyzed for cytokine levels by ELISA. Symbols represent individual mice, mean±s.e.m. *P<0.05, **P<0.01, Student’s two-tailed t-test. (fi) WT (n=5–6/ experiment), IL-1 R−/− (n=5), IL-1α−/− (n =5), Myd88−/− (n=4) and Trif−/− (n=5–6 per experiment) mice were injected with 100 μl K/B × N serum and (f,h) clinical severity and (g,i) MPO activity (average radiance of individual mice) measured. Mean±s.e.m. *P<0.05, **P<0.01. (WT versus Trif−/−, total clinical course (f) 0.03, (h) NS, not significant; resolution phase (h) P=0.0079, (f) 0.0173). P values were calculated using the Mann–Whitney two-sample rank test. (j,k) WT mice were treated with 200 μg antibodies to IL-1β (B122, n=4 mice) or control polyclonal hamster antibody (n=6 mice) on days −1, 0, 2, 4, 6, 8 and 10 after injection of 100 μl K/B × N pathogenic serum. Mice were evaluated (j) daily for clinical severity, and (k) MPO activity (average radiance) was measured in limbs on days 7 and 12. Mean±s.e.m. **P<0.01, Mann–Whitney two-sample rank test. One of two experiments. (l,m) WT, Ripk3−/− and Ripk3−/−Caspase-8−/− mice (n≥6 mice per group) were injected with 100 μl K/B × N serum. (l) Clinical severity, (m) MPO activity (average radiance) in limbs of individual mice. Mean±s.e.m. Representative of at least one of two independent experiments. (WT versus Ripk3−/−, clinical course NS, resolution phase P=0.008; WT versus Ripk3−/−Caspase-8−/− clinical course NS, resolution phase P=0.0075). *P<0.05, **P<0.01, Mann–Whitney two-sample rank test. (n,o) WT and Mlkl−/− mice (n=6 mice per group) were injected with 100 μl K/B × N serum. (n) Clinical severity and (o) MPO activity in limbs of individual mice are shown. Mean±s.e.m. (ps) WT, Ripk3−/− and Ripk3−/−Caspase-8−/− mice (n=5–6 mice per group) were injected with 100 μl K/B × N serum and during the resolution phase of disease (day 10) analyzed for (p) clinical severity, (q) MPO activity in limbs, and IL-1β levels measured in (r) serum and (s) ankle joint secretions. Data symbols are individual mice and different symbols within each group indicate separate experiments. Mean±s.e.m. *P<0.05, **P<0.01. P values were calculated using the Mann–Whitney two-sample rank test (p,q) or the Student’s two-tailed t-test (r,s).
Figure 10
Figure 10. Model for how XIAP and cIAPs repress inflammatory cytokine production, apoptosis and necroptosis.
(a) When IAPs are present, TNFR1 or TLR–TRIF signalling results in IAP-mediated ubiquitylation of RIPK1 or RIPK3, respectively, to propagate pro-survival signals and gene induction. (b) If IAPs are inactivated but caspase-8 is present (left panel), LPS stimulation induces the ripoptosome platform to activate caspase-8 (ubiquitylated). Caspase-8 can (i) trigger apoptosis, (ii) cleave pro-IL-1β directly into its mature form or (iii) promote NLRP3-associated caspase-1 activation, by a mechanism yet to be defined. Alternatively, if both IAPs and caspase-8 are inactive (right panel), LPS induces the formation of the RIPK3–MLKL necrosome that, in addition to causing necroptotic cell death, activates the NLRP3 inflammasome. This necroptotic pathway is associated with RIPK3 and MLKL ubiquitylation, which may control RIPK3/MLKL signalling and/or stability. (c) Genetic loss or inhibition of cIAPs alone or XIAP and cIAPs in myeloid cells cause differential effects on cell death, cytokine production and haematopoiesis leading to spontaneous arthritis. Loss of all three IAPs leads to spontaneous systemic inflammatory disease, featuring mild joint inflammation. Disease is associated with increased cytokine release, including IL-1β and TNF, as well as apoptotic and necroptotic cell death and the accumulation of innate inflammatory cells. In contrast, loss of cIAP1/2 causes severe arthritis that is associated specifically with enhanced TNF levels and only modest effects on haematopoiesis.

References

    1. Silke J. & Meier P. Inhibitor of apoptosis (IAP) proteins-modulators of cell death and inflammation. Cold Spring Harb. Perspect. Biol. 5, pii: a008730 (2013). - PMC - PubMed
    1. Vince J. E. et al.. TRAF2 must bind to cellular inhibitors of apoptosis for tumor necrosis factor (tnf) to efficiently activate nf-{kappa}b and to prevent tnf-induced apoptosis. J. Biol. Chem. 284, 35906–35915 (2009). - PMC - PubMed
    1. Mahoney D. J. et al.. Both cIAP1 and cIAP2 regulate TNFalpha-mediated NF-kappaB activation. Proc. Natl Acad. Sci. USA 105, 11778–11783 (2008). - PMC - PubMed
    1. Bertrand M. J. et al.. cIAP1 and cIAP2 facilitate cancer cell survival by functioning as E3 ligases that promote RIP1 ubiquitination. Mol. Cell 30, 689–700 (2008). - PubMed
    1. Haas T. L. et al.. Recruitment of the linear ubiquitin chain assembly complex stabilizes the TNF-R1 signaling complex and is required for TNF-mediated gene induction. Mol. Cell 36, 831–844 (2009). - PubMed

Publication types

MeSH terms