. 2015 Mar;15(3):659-67.
doi: 10.1111/ajt.13099.

Early changes in liver distribution following implementation of Share 35

Affiliations

Early changes in liver distribution following implementation of Share 35

A B Massie et al. Am J Transplant. 2015 Mar.

Abstract

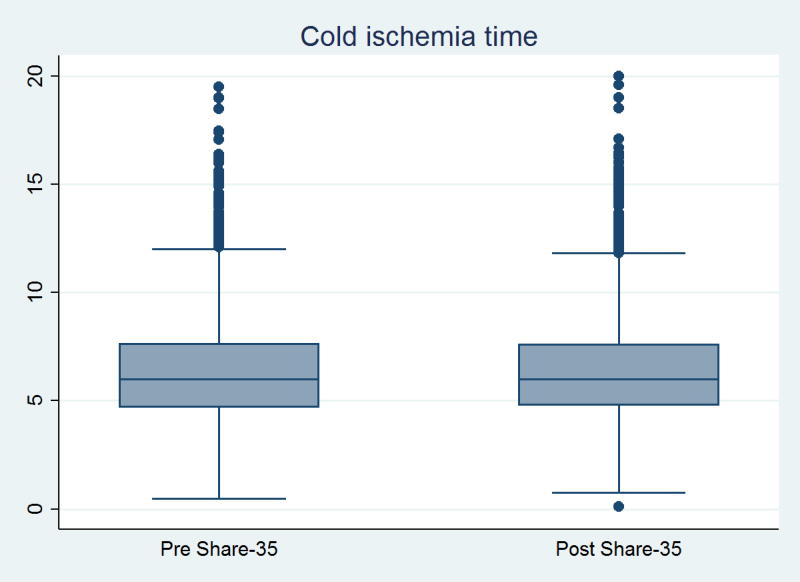
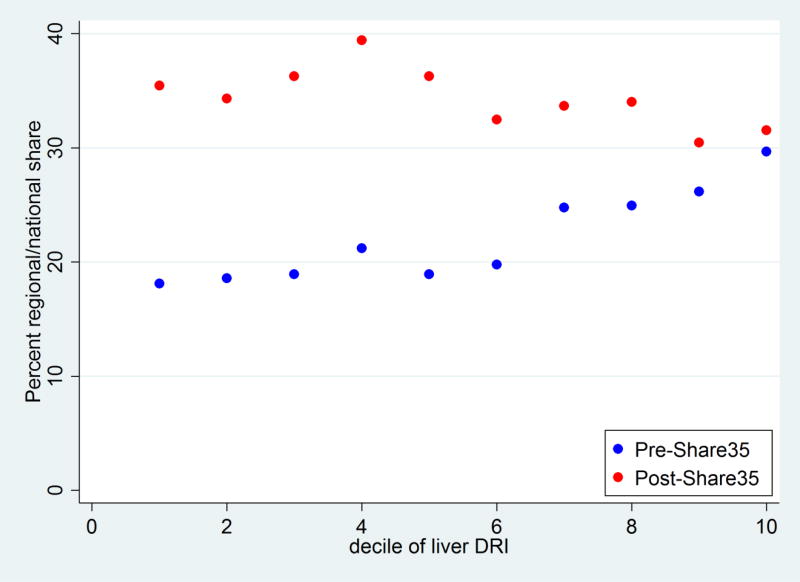
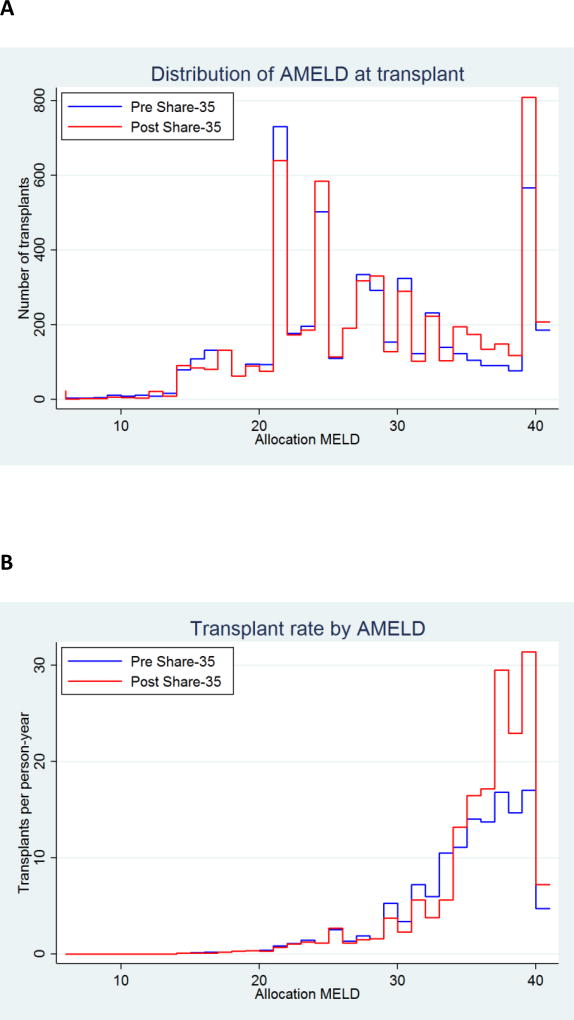
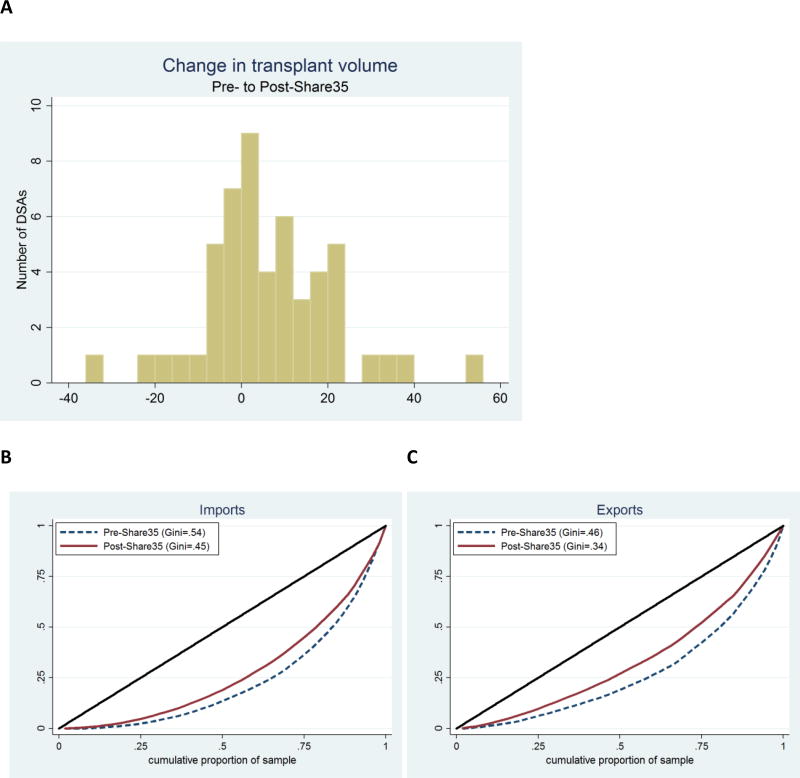
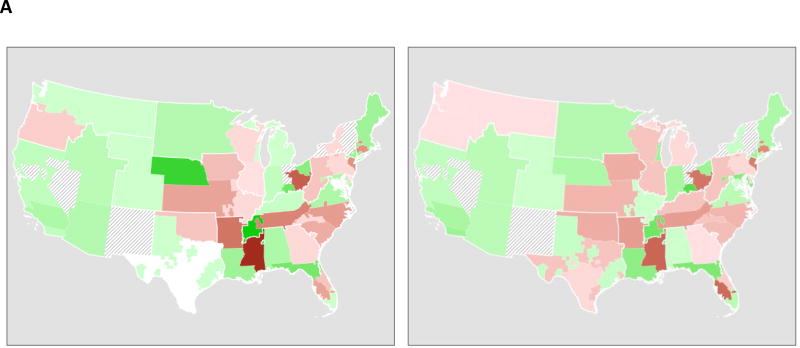
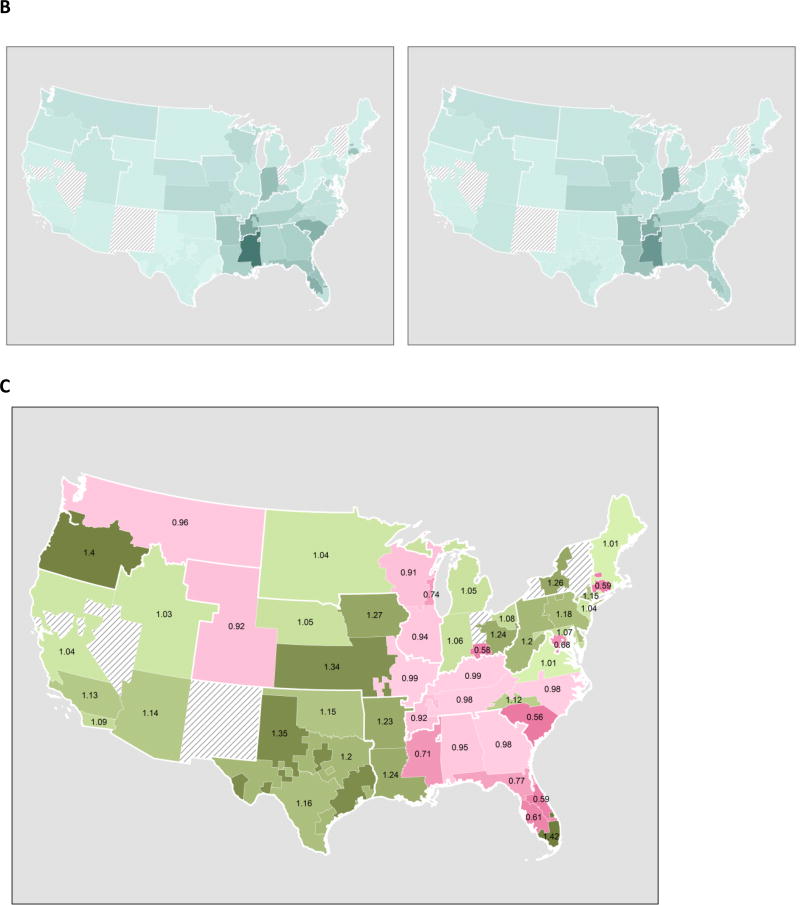
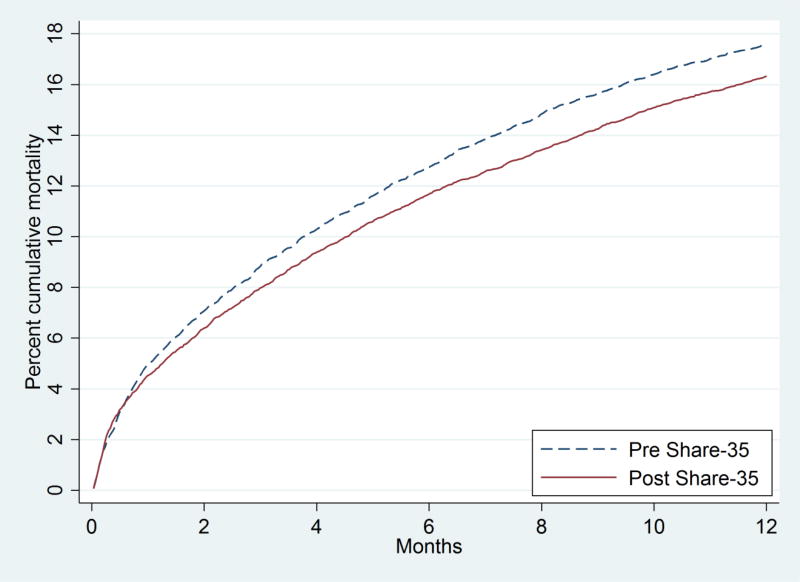
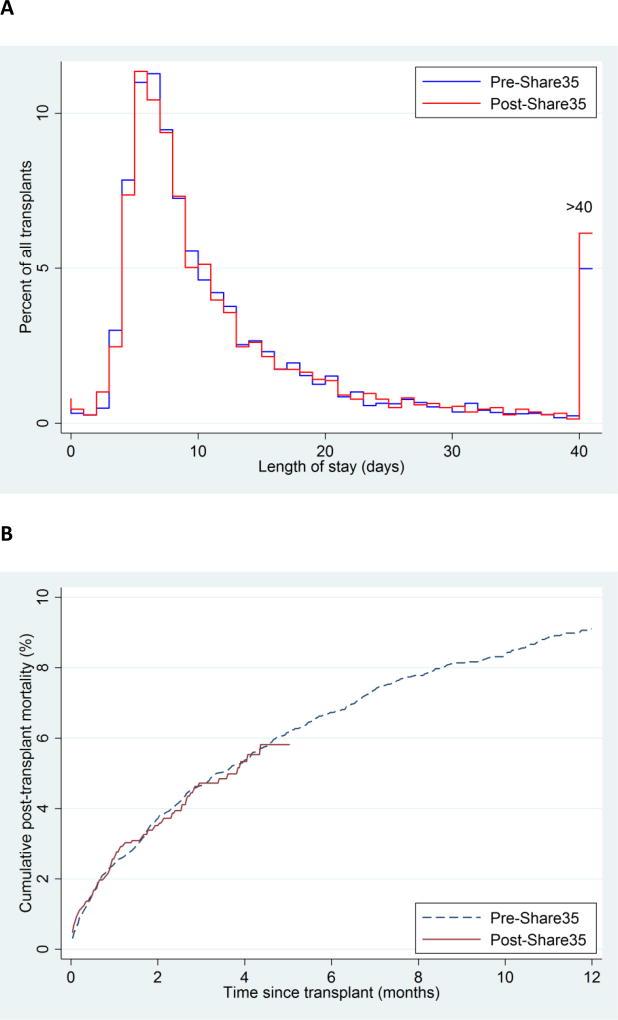
In June 2013, a change to the liver waitlist priority algorithm was implemented. Under Share 35, regional candidates with MELD ≥ 35 receive higher priority than local candidates with MELD < 35. We compared liver distribution and mortality in the first 12 months of Share 35 to an equivalent time period before. Under Share 35, new listings with MELD ≥ 35 increased slightly from 752 (9.2% of listings) to 820 (9.7%, p = 0.3), but the proportion of deceased-donor liver transplants (DDLTs) allocated to recipients with MELD ≥ 35 increased from 23.1% to 30.1% (p < 0.001). The proportion of regional shares increased from 18.9% to 30.4% (p < 0.001). Sharing of exports was less clustered among a handful of centers (Gini coefficient decreased from 0.49 to 0.34), but there was no evidence of change in CIT (p = 0.8). Total adult DDLT volume increased from 4133 to 4369, and adjusted odds of discard decreased by 14% (p = 0.03). Waitlist mortality decreased by 30% among patients with baseline MELD > 30 (SHR = 0.70, p < 0.001) with no change for patients with lower baseline MELD (p = 0.9). Posttransplant length-of-stay (p = 0.2) and posttransplant mortality (p = 0.9) remained unchanged. In the first 12 months, Share 35 was associated with more transplants, fewer discards, and lower waitlist mortality, but not at the expense of CIT or early posttransplant outcomes.

Keywords: United Network for Organ Sharing (UNOS); epidemiology; ethics and public policy; health services and outcomes research; liver transplantation/hepatology; organ allocation; organ procurement and allocation; social sciences.


Conflict of interest statement

DISCLOSURE

The authors of this manuscript have no conflicts of interest to disclose as described by the American Journal of Transplantation.

Figures

Figure 1
Figure 1. Cold ischemia time, before and after implementation of Share-35
Median (IQR) CIT was 6.0 (4.7–7.6) hours pre-Share35 and 6.0 (4.8–7.8) hours post-Share35. There was no statistically significant difference in CIT per ranksum test (p=0.8). For the sake of illustration, outlier points with > 20 hours CIT are omitted (N=30 pre-Share35, N=38 post-Share35).
Figure 2
Figure 2. Probability of regional or national share among transplanted livers, pre-Share35 and post-Share35
Pre-Share35, livers with higher DRI were more likely to be shared (p<0.001). Post-Share35, livers with lower DRI were more likely to be shared (p<0.01), although the association was less strong.
Figure 3
Figure 3. Distribution of AMELD (allocation priority based on MELD or exception points) at transplantation, before and after implementation of Share 35
Status 1 recipients are categorized as AMELD=41. (A) Number of transplants at each AMELD. Post-Share35, there were more total transplants, and more transplants with AMELD ≥35. AMELD at transplant increased under Share-35 (Wilcoxson rank-sum p=<0.001). The proportion of transplants with AMELD ≥35 increased from 22.3% to 30.5% (χ2 p=<0.001). (B) Rate of transplants for waitlist registrants at each AMELD score. Under Share-35, the transplant rate increased for AMELD ≥35, particularly for patients with AMELD ≥38.
Figure 4
Figure 4. DSA-level change in transplant volume and imports/exports
(A) Histogram of DSA change in transplant volume from pre-Share35 to post-Share35. Compared to the pre-share35 period, in the post-Share35 period 32 DSAs had increased volume, three DSAs had the same volume, and 17 DSAs had decreased volume. (B) Lorenz curves of imports by DSA pre-Share35 and post-Share35. The curve for the post-Share35 period is closer to the diagonal line, indicating broader sharing of liver imports. (C) Lorenz curves of exports by DSA pre-Share35 and post-Share35. Similar to imports, the curve for the post-Share35 period is closer to the diagonal line, indicating broader distribution of liver exports.
Figure 5
Figure 5. DSA-level changes associated with Share-35
(A) Net import or export for each DSA, pre-Share35 (left) and post-Share35 (right); green indicates net import (more imports than exports), and brown indicates net export; a darker shade indicates greater magnitude. Hash marks indicate DSAs with no transplant centers performing liver transplantation. Region 8 (Wyoming, Colorado, Nebraska, Kansas, Iowa, and Missouri) and Region 9 (New York) had some regional sharing prior to the implementation of Share-35. Net import and export were largely unchanged with the implementation of Share-35. (B) Transplant rate per DSA, pre-Share35 (left) and post-Share35 (right); a darker shade indicates higher rate of transplant. Rates increased in (C) Ratio of transplant rate pre-Share35 and post-Share35 for each DSA; green indicates a higher MELD-adjusted transplant rate post-Share35, and berry indicates a lower transplant rate post-Share35.
Figure 6
Figure 6. Early Waitlist mortality, before and after implementation of Share 35
The survival curves account for the competing risk of transplantation. Removal from waitlist for deteriorating condition is treated as death. Adjusting for MELD at the start of each period, accounting for the competing risk of transplantation, cumulative incidence of mortality decreased by ten percent (SHR = 0.87 0.92 0.97, p=0.03). Overall there were 2804 deaths in the pre-Share35 period and 2700 deaths in the post-Share35 period.
Figure 7
Figure 7. Early post-transplant length-of-stay and mortality, before and after implementation of Share 35
(A) Distribution of post-transplant length-of-stay (LOS) pre-Share35 and post-Share35. Median LOS after transplant was similar pre-Share35 (9, IQR 7–16) and post-Share35 (9, IQR 7–16) (p=0.2) (B) Cumulative post-transplant mortality pre-Share35 and post-Share35. There was no evidence of change in post-transplant mortality (p=0.9).

References

    1. Washburn K, Pomfret E, Roberts J. Liver allocation and distribution: possible next steps. Liver transplantation : official publication of the American Association for the Study of Liver Diseases and the International Liver Transplantation Society. 2011;17(9):1005–1012. - PubMed
    1. Wedd JP, Harper AM, Biggins SW. MELD score, allocation, and distribution in the United States. Clinical Liver Disease. 2013;2(4):148–151. - PMC - PubMed
    1. Leppke S, Leighton T, Zaun D, Chen SC, Skeans M, Israni AK, et al. Scientific Registry of Transplant Recipients: collecting, analyzing, and reporting data on transplantation in the United States. Transplant Rev (Orlando) 2013;27(2):50–56. - PubMed
    1. Massie AB, Caffo B, Gentry SE, Hall EC, Axelrod DA, Lentine KL, et al. MELD Exceptions and Rates of Waiting List Outcomes. American journal of transplantation : official journal of the American Society of Transplantation and the American Society of Transplant Surgeons. 2011;11(11):2362–2371. - PMC - PubMed
    1. Feng S, Goodrich NP, Bragg-Gresham JL, Dykstra DM, Punch JD, DebRoy MA, et al. Characteristics associated with liver graft failure: the concept of a donor risk index. American journal of transplantation : official journal of the American Society of Transplantation and the American Society of Transplant Surgeons. 2006;6(4):783–790. - PubMed

Publication types