

Id3 induces an Elk-1-caspase-8-dependent apoptotic pathway in squamous carcinoma cells
- PMID: 25693514
- PMCID: PMC4472214
- DOI: 10.1002/cam4.427
Id3 induces an Elk-1-caspase-8-dependent apoptotic pathway in squamous carcinoma cells
Abstract
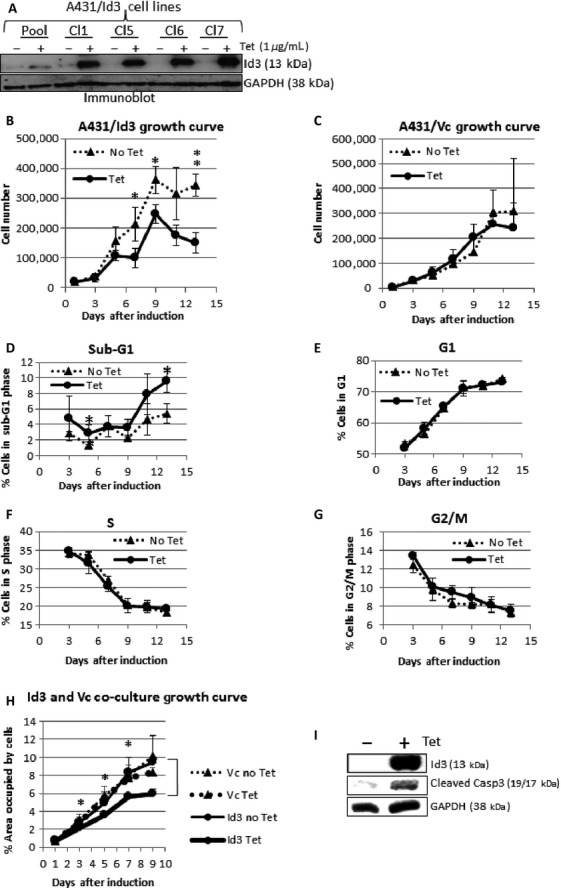
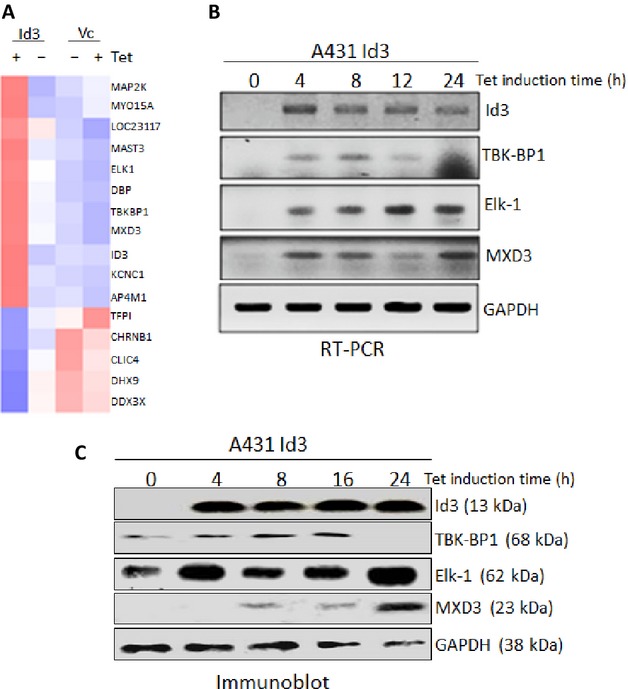
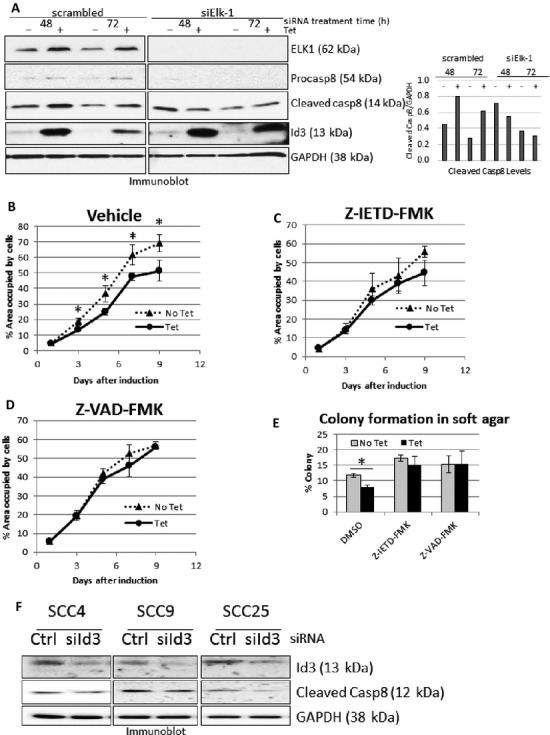
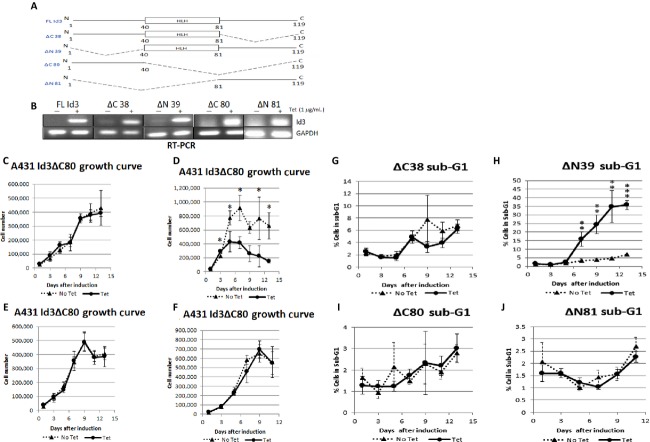
Inhibitor of differentiation/DNA-binding (Id) proteins are helix-loop-helix (HLH) transcription factors. The Id protein family (Id1-Id4) mediates tissue homeostasis by regulating cellular processes including differentiation, proliferation, and apoptosis. Ids typically function as dominant negative HLH proteins, which bind other HLH proteins and sequester them away from DNA promoter regions. Previously, we have found that Id3 induced apoptosis in immortalized human keratinocytes upon UVB exposure, consistent with its role as a tumor suppressor. To investigate the role of Id3 in malignant squamous cell carcinoma (SCC) cells (A431), a tetracycline-regulated inducible system was used to induce Id3 in cell culture and mouse xenograft models. We found that upon Id3 induction, there was a decrease in cell number under low serum conditions, as well as in soft agar. Microarray, RT-PCR, immunoblot, siRNA, and inhibitor studies revealed that Id3 induced expression of Elk-1, an E-twenty-six (ETS)-domain transcription factor, inducing procaspase-8 expression and activation. Id3 deletion mutants revealed that 80 C-terminal amino acids, including the HLH, are important for Id3-induced apoptosis. In a mouse xenograft model, Id3 induction decreased tumor size by 30%. Using immunofluorescent analysis, we determined that the tumor size decrease was also mediated through apoptosis. Furthermore, we show that Id3 synergizes with 5-FU and cisplatin therapies for nonmelanoma skin cancer cells. Our studies have shown a molecular mechanism by which Id3 induces apoptosis in SCC, and this information can potentially be used to develop new treatments for SCC patients.
Keywords: Apoptosis; Elk-1; HLH; Id3; SCC; caspase-8.
© 2015 The Authors. Cancer Medicine published by John Wiley & Sons Ltd.
Figures


Similar articles
-
Id3 induces a caspase-3- and -9-dependent apoptosis and mediates UVB sensitization of HPV16 E6/7 immortalized human keratinocytes.Oncogene. 2006 Jun 22;25(26):3649-60. doi: 10.1038/sj.onc.1209407. Epub 2006 Jan 30. Oncogene. 2006. PMID: 16449966
-
Targeting Id1 and Id3 by a specific peptide aptamer induces E-box promoter activity, cell cycle arrest, and apoptosis in breast cancer cells.Breast Cancer Res Treat. 2010 Dec;124(3):623-33. doi: 10.1007/s10549-010-0810-6. Epub 2010 Feb 27. Breast Cancer Res Treat. 2010. PMID: 20191379
-
The role of caspase family protease, caspase-3 on cisplatin-induced apoptosis in cisplatin-resistant A431 cell line.Cancer Chemother Pharmacol. 2000;46(3):241-5. doi: 10.1007/s002800000145. Cancer Chemother Pharmacol. 2000. PMID: 11021742
-
Inhibitor of differentiation 4 (ID4): From development to cancer.Biochim Biophys Acta. 2015 Jan;1855(1):92-103. doi: 10.1016/j.bbcan.2014.12.002. Epub 2014 Dec 12. Biochim Biophys Acta. 2015. PMID: 25512197 Free PMC article. Review.
-
Id3, E47, and SREBP-1c: fat factors controlling adiponectin expression.Circ Res. 2008 Sep 12;103(6):565-7. doi: 10.1161/CIRCRESAHA.108.184366. Circ Res. 2008. PMID: 18796641 Free PMC article. Review. No abstract available.
Cited by
-
Lapatinib inhibits CIP2A/PP2A/p-Akt signaling and induces apoptosis in triple negative breast cancer cells.Oncotarget. 2016 Feb 23;7(8):9135-49. doi: 10.18632/oncotarget.7035. Oncotarget. 2016. PMID: 26824320 Free PMC article.
-
The Id-protein family in developmental and cancer-associated pathways.Cell Commun Signal. 2017 Jan 25;15(1):7. doi: 10.1186/s12964-016-0161-y. Cell Commun Signal. 2017. PMID: 28122577 Free PMC article. Review.
-
ID1 and ID4 Are Biomarkers of Tumor Aggressiveness and Poor Outcome in Immunophenotypes of Breast Cancer.Cancers (Basel). 2021 Jan 27;13(3):492. doi: 10.3390/cancers13030492. Cancers (Basel). 2021. PMID: 33514024 Free PMC article.
-
LEF1/Id3/HRAS axis promotes the tumorigenesis and progression of esophageal squamous cell carcinoma.Int J Biol Sci. 2020 Jun 29;16(13):2392-2404. doi: 10.7150/ijbs.47035. eCollection 2020. Int J Biol Sci. 2020. PMID: 32760207 Free PMC article.
-
Inhibitor of DNA binding 3 reverses cisplatin resistance in human lung adenocarcinoma cells by regulating the PI3K/Akt pathway.Oncol Lett. 2018 Aug;16(2):1634-1640. doi: 10.3892/ol.2018.8849. Epub 2018 May 31. Oncol Lett. 2018. PMID: 30008847 Free PMC article.
References
-
- Argiris A, Li Y. Forastiere A. Prognostic factors and long-term survivorship in patients with recurrent or metastatic carcinoma of the head and neck. Cancer. 2004;101:2222–2229. - PubMed
-
- Lyden D, Young AZ, Zagzag D, Yan W, Gerald W, O'Reilly R, et al. Id1 and Id3 are required for neurogenesis, angiogenesis and vascularization of tumour xenografts. Nature. 1999;401:670–677. - PubMed
-
- Lasorella A, Noseda M, Beyna M, Yokota Y. Iavarone A. Id2 is a retinoblastoma protein target and mediates signalling by Myc oncoproteins. Nature. 2000;407:592–598. - PubMed
Publication types
MeSH terms
Substances
Grants and funding
LinkOut - more resources
Full Text Sources
Other Literature Sources
Molecular Biology Databases
Research Materials
