. 2015 Feb 19;518(7539):344-9.
doi: 10.1038/nature14233.

Transcription factor binding dynamics during human ES cell differentiation

Affiliations

Transcription factor binding dynamics during human ES cell differentiation

Alexander M Tsankov et al. Nature. .

Abstract

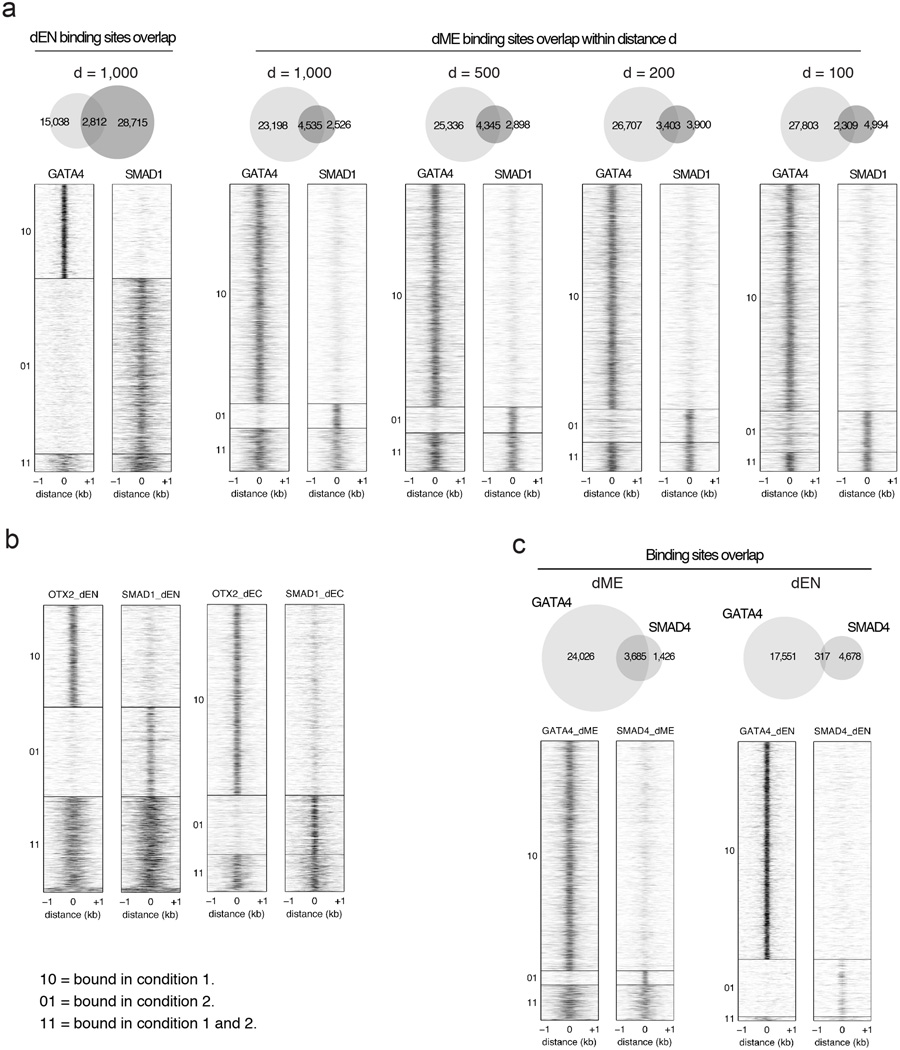
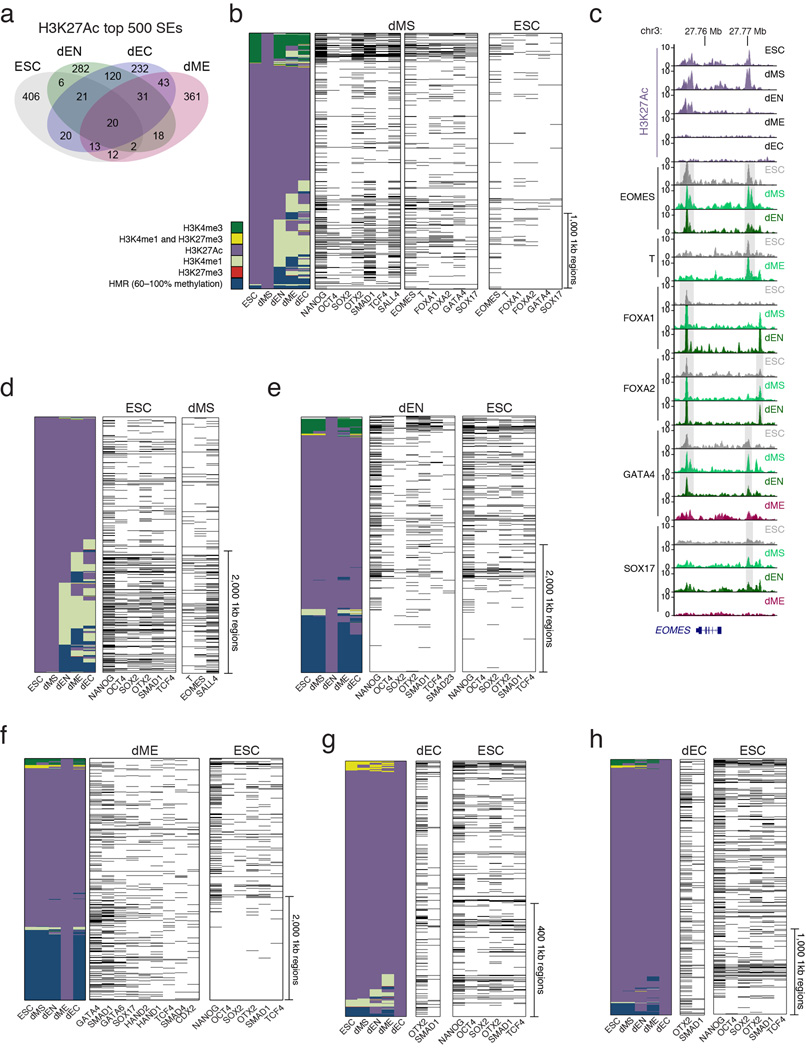
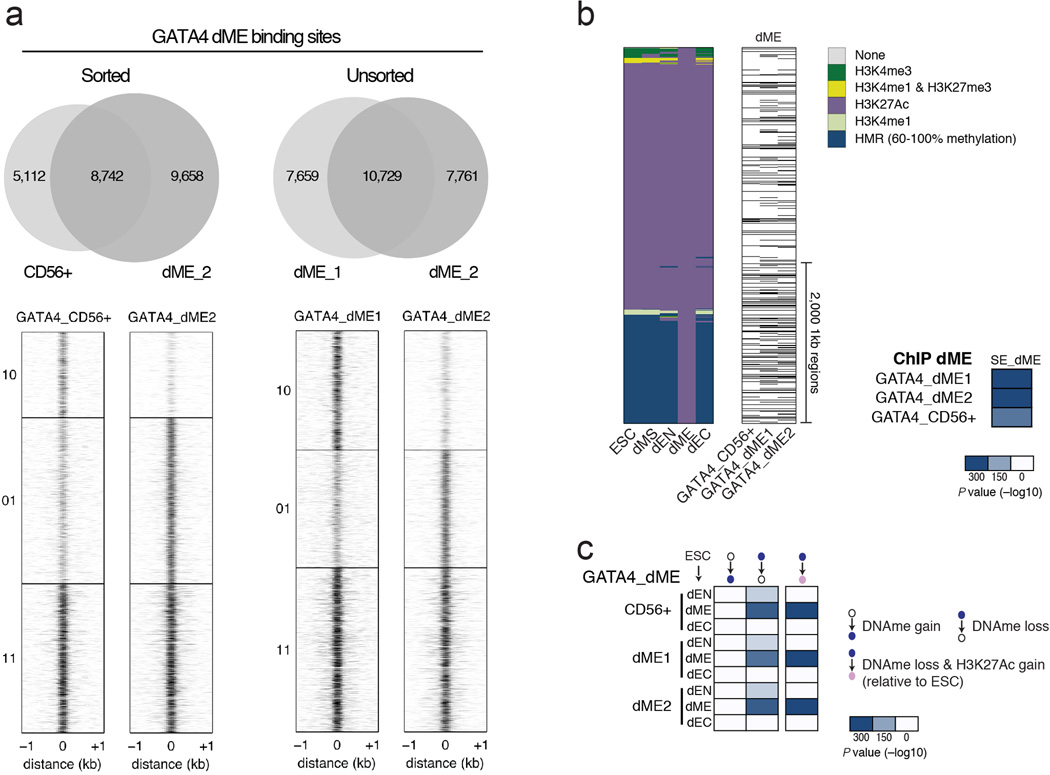
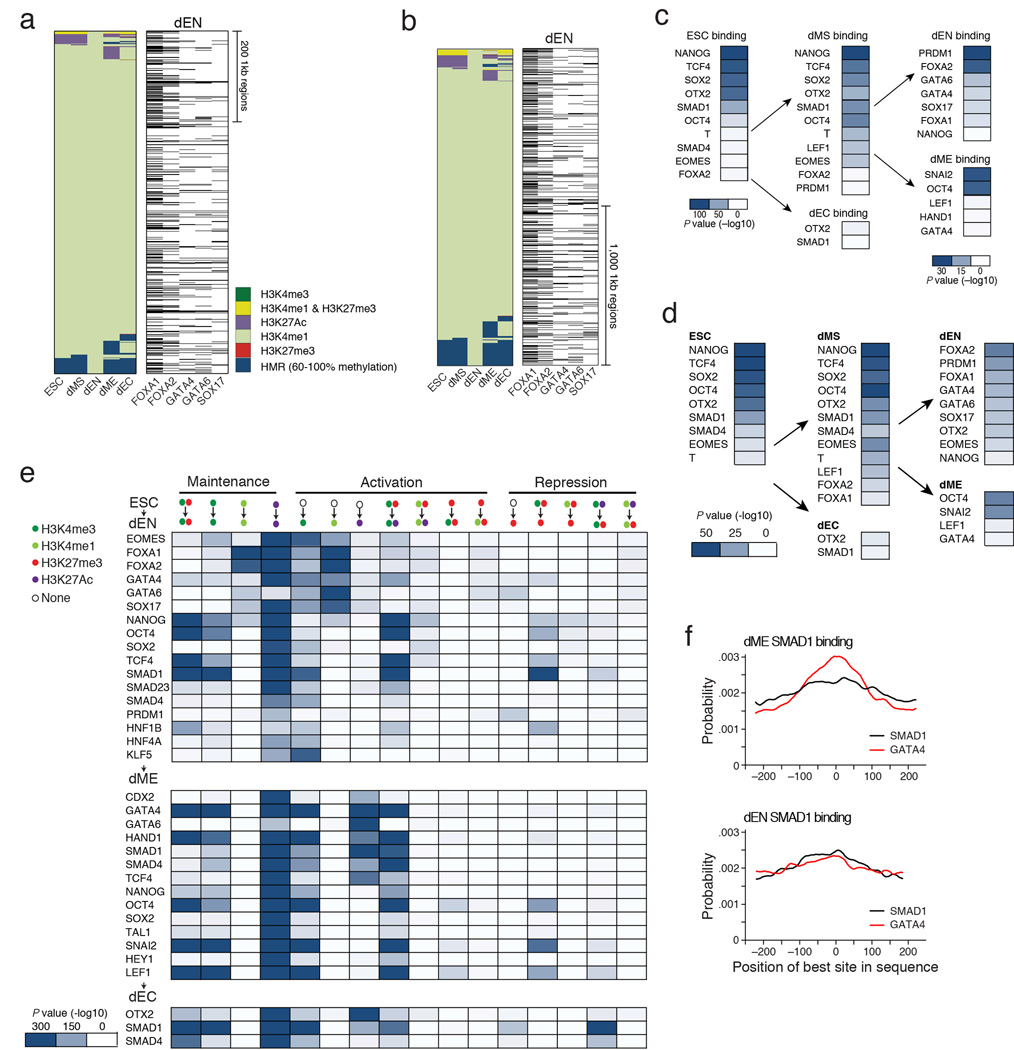
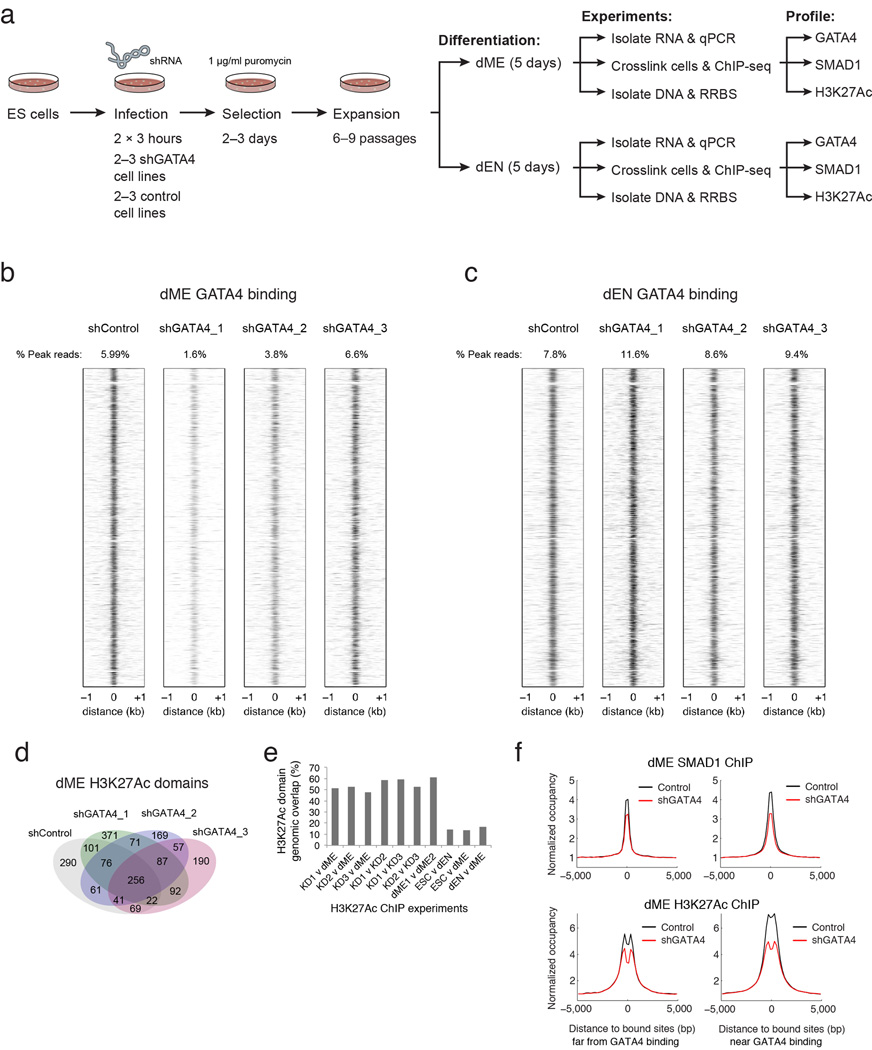
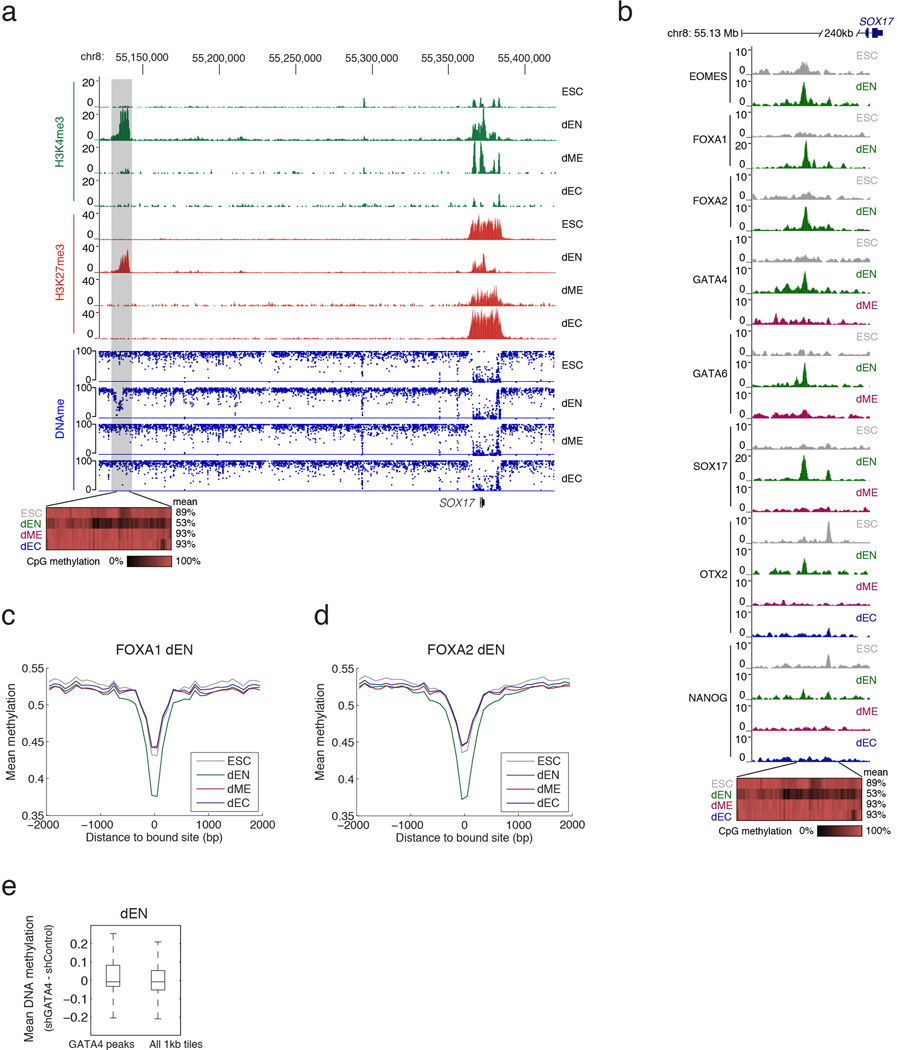
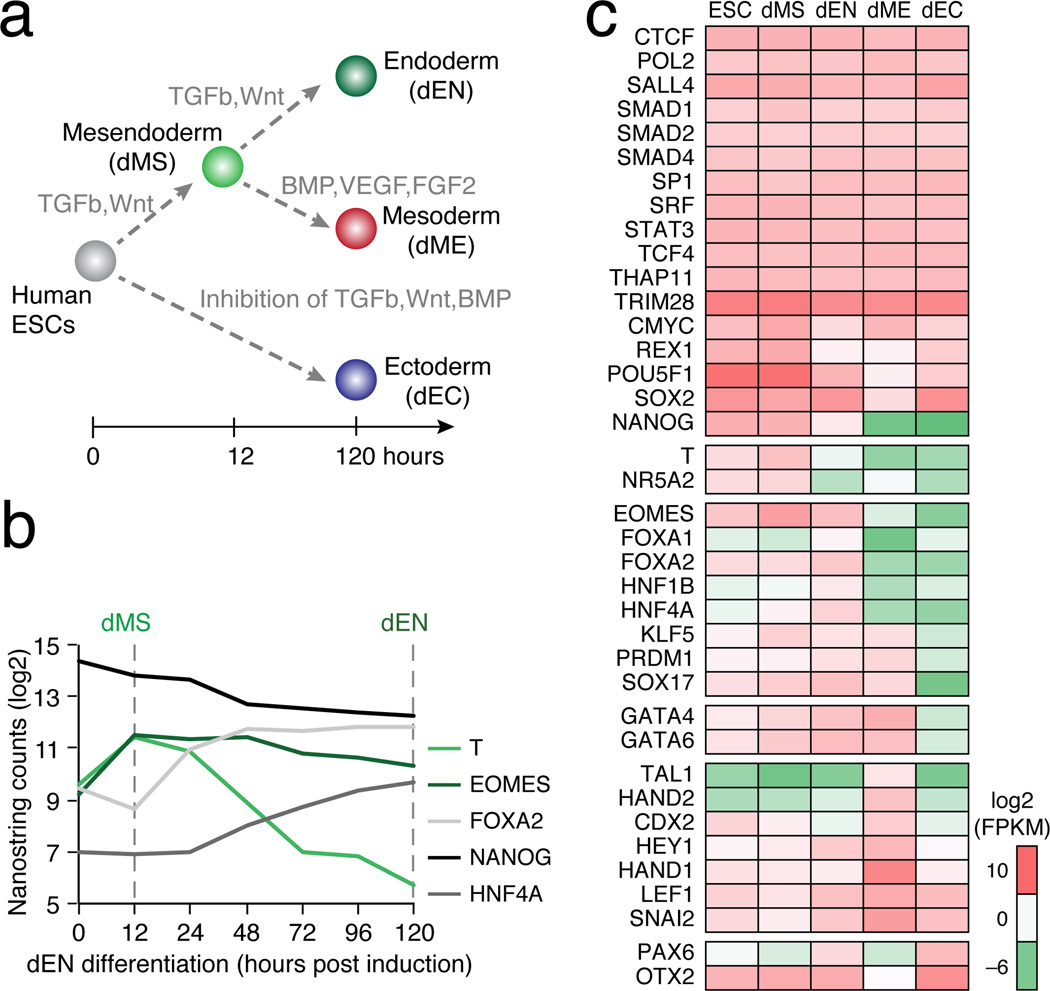
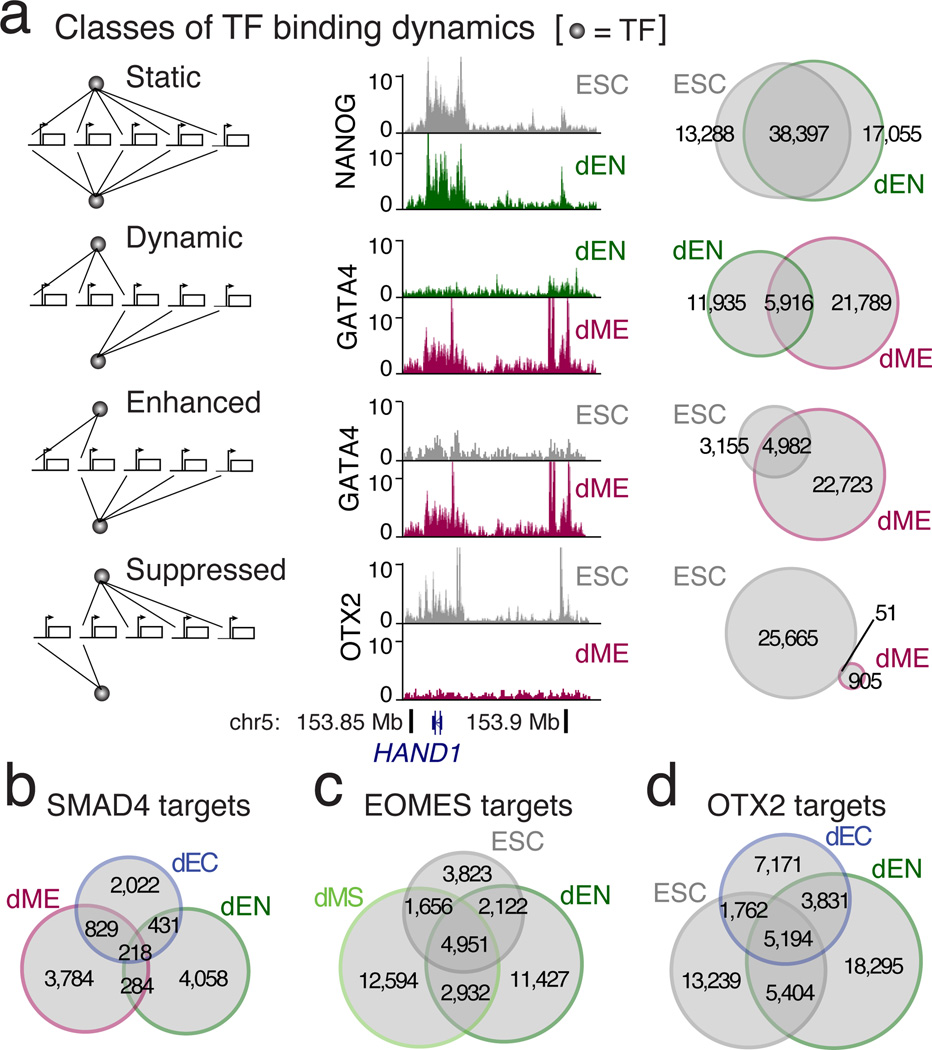
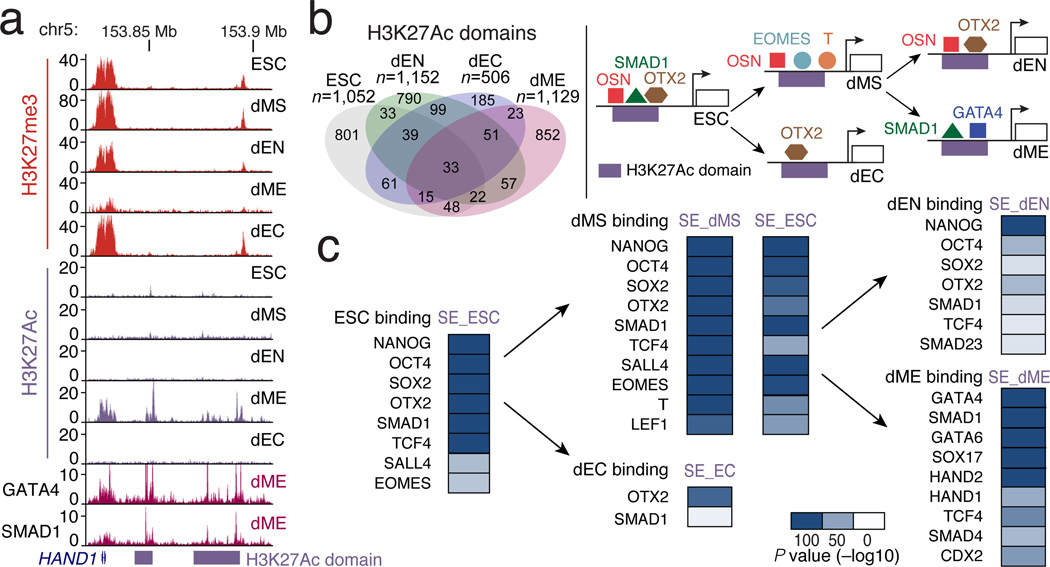
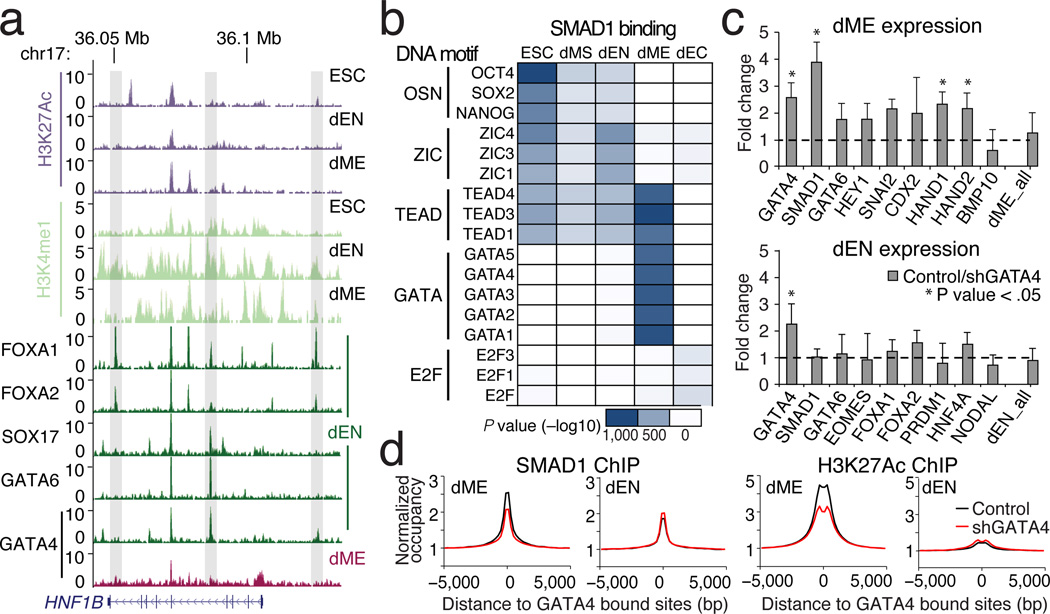
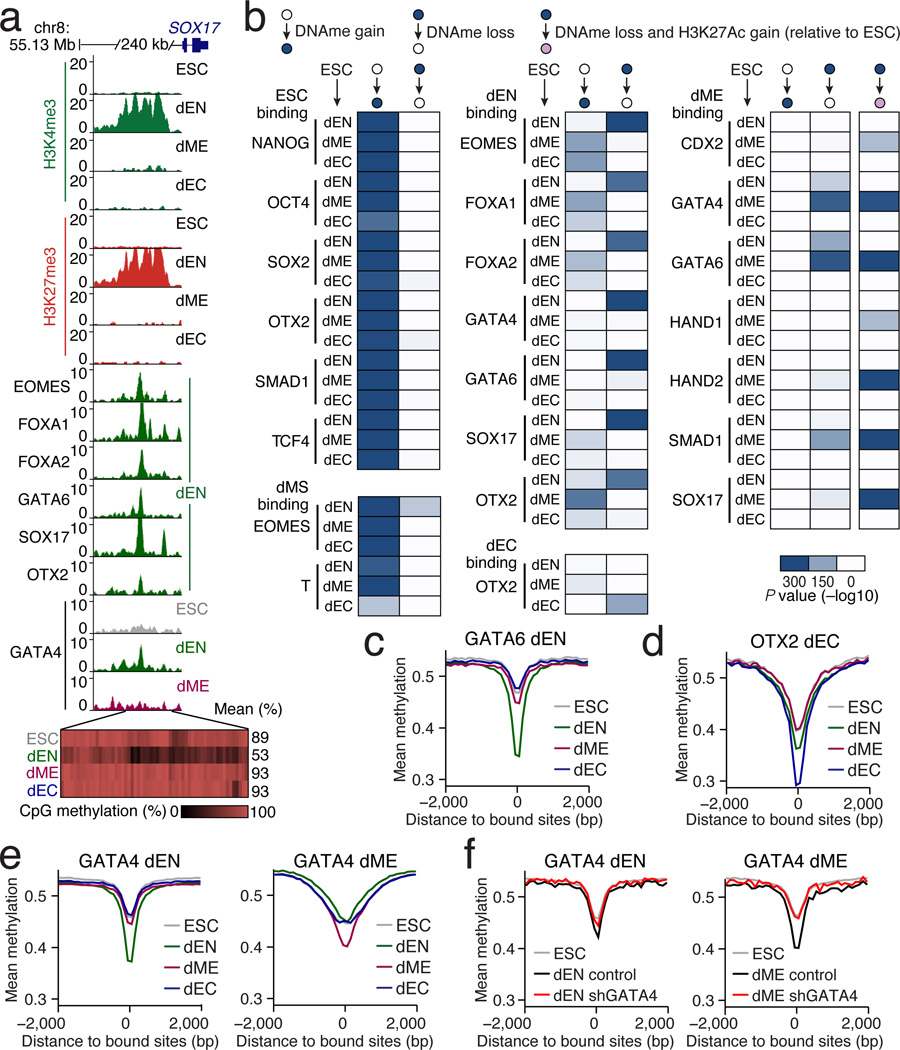
Pluripotent stem cells provide a powerful system to dissect the underlying molecular dynamics that regulate cell fate changes during mammalian development. Here we report the integrative analysis of genome-wide binding data for 38 transcription factors with extensive epigenome and transcriptional data across the differentiation of human embryonic stem cells to the three germ layers. We describe core regulatory dynamics and show the lineage-specific behaviour of selected factors. In addition to the orchestrated remodelling of the chromatin landscape, we find that the binding of several transcription factors is strongly associated with specific loss of DNA methylation in one germ layer, and in many cases a reciprocal gain in the other layers. Taken together, our work shows context-dependent rewiring of transcription factor binding, downstream signalling effectors, and the epigenome during human embryonic stem cell differentiation.


Figures

Extended Data Fig. 1
Extended Data Fig. 1. MNase ChIP-seq (MNChIP-seq) performance compared to sonication based ChIP-Seq
a. Venn diagram (top) and corresponding heatmaps (bottom) show high reproducibility of CTCF binding between biological replicates in ESCs using MNChIP-seq. Heatmaps display normalized binding occupancy averaged using 50bp bins. Regions are centered on the merged binding peaks for the two replicates, where 10=regions bound in replicate 1, 01=bound in replicate 2, and 11=bound in both. b. Venn diagram (top) and corresponding heatmaps (bottom) show high reproducibility of NANOG binding between biological replicates in ESCs using MNChIP-seq. Heatmaps display normalized binding occupancy averaged using 50bp bins. Regions are centered on the merged binding peaks for the two replicates, where 10=regions bound in replicate 1, 01=bound in replicate 2, 11=bound in both. c. Venn diagram (top) and corresponding heatmaps (bottom) show high reproducibility of NANOG binding between biological replicates in ESCs using sonication ChIP-seq. Reproducibility of NANOG binding using sonication based ChIP-seq is similar to reproducibility using MNChIP-seq.10=regions bound in replicate 1, 01=bound in replicate 2, 11=bound in both. d. Venn diagram (top) and corresponding heatmaps (bottom) show a higher sensitivity for capturing NANOG binding sites in ESCs using MNChIP-seq. Heatmaps display normalized binding occupancy averaged using 50bp bins. Regions are centered on the merged binding peaks for the two replicates, where 10=regions bound in replicate 1, 01=bound in replicate 2, 11=bound in both. e. Heatmaps show high reproducibility of GATA4 binding in both dEN and dME using MNChIP-seq. Heatmaps display normalized binding occupancy averaged using 50bp bins. Regions are centered on the merged binding peaks for the two replicates, where 10=regions bound in factor 1, 01=regions bound in factor 2, 11=regions bound in both. f. Top: Number of significant binding peaks in our data set is comparable to that of 1,410 ENCODE TF ChIP-seq profiles (all currently available with matching peak and .bam files at UCSC). Bottom: The level of enrichment over background, as quantified by percentage of reads in peaks, is approximately 1.5 times less than that of the ENCODE TF binding data. ENCODE data was collected in cell types where the factors are known to be active; therefore, for this comparison we excluded all TF binding profiles for timepoints where the factors are not expressed and expected to be active (middle column).
Extended Data Fig. 2
Extended Data Fig. 2. Motif analysis
88% (28/32) of factors significantly associate with their known DNA binding motif (P < 10−75). De novo motif discovery for these factors confirms their known motifs, which provides further validation for the antibody specificity. For SRF, REX1, STAT3, and TAL1 the motifs did not match the database motifs. To be conservative, we excluded these factors from further analyses. For the remaining six factors, (POL2, SALL4, T, NR5A2, THAP11, TRIM28) we did not find a reliable DNA-binding motif in the database of 1,887 motifs combining TRANSFAC and Jolma et al. data sets.
Extended Data Fig. 3
Extended Data Fig. 3. Examples of TF binding dynamics across several loci
a. Binding dynamics for a number of selected TFs in the four differentiated cell types versus ESCs (temporal) and in dEN versus dME (cross-lineage). b. Normalized TF binding of NANOG, EOMES, GATA4, and SMAD1 shows distinct and germ layer specific regulation of the GATA6 locus. WCE = whole cell extract. c. Normalized TF binding at the HAND1 locus shows very static binding for NANOG between cell types, somewhat dynamic binding of OTX2 in dEN and dEC, and more dynamic binding of GATA4 in dEN and dME. Purple boxes upstream of HAND1 mark long domains of H3K27Ac, which are highly enriched for GATA4 and SMAD1 binding in dME (bottom tracks). d. Normalized MNChIP-seq binding of multiple factors across different cell types show strong enrichments over whole cell extract (WCE) control (bottom track). The high similarity in CTCF binding between cell types might suggest that chromatin loops, nuclear lamina interactions, and chromatin boundaries regulated by CTCF are largely preserved during early human ESC differentiation.
Extended Data Fig. 4
Extended Data Fig. 4. Venn diagrams and heatmaps highlighting different TF binding dynamics in human ESCs and their derivatives
a. Heatmaps show that CTCF binding overlaps highly in dEN and dME. Heatmaps display normalized binding occupancy averaged using 50bp bins. Regions are centered on the merged binding peaks for the two cell types, where 10=regions bound in dME, 01=bound in dEN, 11=bound in both. b. Heatmaps show that NANOG binding is static in ESCs and dEN and suppressed in dME (left). In contrast, GATA4 binding is highly dynamic between dEN and dME and enhanced in the germ layers relative to ESCs (middle). Finally, OTX2 binding is dynamic in dEN and dEC relative to ESCs, but suppressed in dME (right). Heatmaps display normalized binding occupancy averaged using 50bp bins. Regions are centered on the merged binding peaks for the three conditions, where regions 100, 010, 001, 110, 101, 111 are defined in legend on bottom right (panel 4f). c. Venn diagrams (top) and heatmaps (bottom) show the binding dynamics of SOX2 (left) and OCT4 (right). Heatmaps display normalized binding occupancy averaged using 50bp bins. Regions are centered on the merged binding peaks for the three conditions, where regions 100, 010, 001, 110, 101, 111 are defined in legend in panel 4f. d. Venn diagram (top) and heatmaps (bottom) show that TCF4 binding is temporally static in dMS and dEN (left) and suppressed in dME and dEC relative to dEN (right). e. Heatmaps show that SMAD4 predominantly binds to unique regions in the three germ layers. f. Heatmaps show that EOMES binding is enhanced from ESCs to dMS and dynamic in dEN. Heatmaps display normalized binding occupancy averaged using 50bp bins. Regions are centered on the merged binding peaks for the three conditions, where regions 100, 010, 001, 110, 101, 111 are defined in legend on the right.
Extended Data Fig. 5
Extended Data Fig. 5. Heatmaps of GATA4 and OTX2 co-binding relationship with SMAD1 in germ layers
a. Heatmaps show that overlap in binding between GATA4 and SMAD1 is smaller in dEN (left) than in dME (right). Heatmaps display normalized binding occupancy averaged using 50bp bins. Regions are centered on the merged binding peaks for the three conditions, where 10=regions bound by factor 1, 01=regions bound by factor 2, 11=regions bound by both factors. Regions were considered co-bound if peaks for both factors occurred within distance d, set to 1000bp for most analyses. Decreasing the distance d for dME to 500bp has little effect. Setting d to 200bp and 100bp decreases co-bound peaks in dME by about 25% and 50%, respectively. b. Heatmaps show that overlap in binding between OTX2 and SMAD1 is higher in dEN (left) than in dEC (right). Heatmaps display normalized binding occupancy averaged using 50bp bins. Regions are centered on the merged binding peaks for the three conditions, where 10=regions bound by factor 1, 01=regions bound by factor 2, 11=regions bound by both factors. c. Venn diagrams (top) and heatmaps (bottom) show that the overlap in binding between GATA4 and SMAD4 is greater in dME than in dEN. Heatmaps display normalized binding occupancy averaged using 50bp bins. Regions are centered on the merged binding peaks for the three conditions, where 10=regions bound by factor 1, 01=regions bound by factor 2, 11=regions bound by both factors.
Extended Data Fig. 6
Extended Data Fig. 6. related to Fig. 4: Extended H3K27Ac domains in the germ layers
a. Overlap of top 500 extended H3K27Ac domains shows little overlap of these regions between cell types. b. Left: Alternative lineage chromatin states of stitched dMS H3K27Ac super-enhancers (n=698, merging 3,441 1kb regions shown as columns in the heatmap). Chromatin states (see Supplementary Information for detailed definitions of “extended H3K27Ac domains” and “H3K27Ac chromatin states”) that are displayed in the panel are explained in the legend (bottom left, HMR=Highly Methylated Region). Center: Corresponding binding of the most enriched TFs in dMS. Black bars indicate TF binding. Right: Corresponding binding of selected factors in ESCs. c. Genome browser tracks for H3K27Ac across all cell types and normalized TF binding in selected cell types for EOMES, T, FOXA1/2, GATA4, and SOX17 over the EOMES locus. Grey bars highlight regions where TF binding is present in ESCs and at later stages in differentiation, suggesting that these loci are primed for binding by these factors in ESCs. Although we cannot distinguish whether this happens in all cells or just a subpopulation, it is tempting to speculate that this binding occurs in the subset of cells in G1, which is the population that is most responsive to differentiation cues. This would also be in line with DNAseI footprint studies that reported usage of EOMES DNA-binding sites in human ESCs. d. Left: Alternative lineage chromatin states of stitched H3K27Ac super-enhancers in ESCs (n=1,052, merging 4,191 1kb regions shown as columns in the heatmap). Chromatin states that are displayed in the panel are explained in the legend in panel b (bottom left, HMR=Highly Methylated Region). Center: Corresponding binding of the most enriched TFs in ESCs. Black bars indicate TF binding. OSN and OTX2 are the most enriched factors. Interestingly, OTX2 was recently shown to play an important role in the mouse naïve to primed pluripotent state transition, a cellular state considered to be similar to human ES cells26. Right: Corresponding binding data for T, EOMES, and SALL4 in dMS, showing that these key dMS regulators are present at many of these super-enhancers in the next stage of differentiation. e. Left: Alternative lineage chromatin states of stitched H3K27Ac super-enhancers in dEN (n=1,152, merging 4,051 1kb regions shown as columns in the heatmap). States are defined as in panel b. Center: Corresponding binding of the most enriched TFs in dEN. Black bars indicate TF binding. Right: Corresponding binding of selected TFs in ESCs shows that these factors occupy many of these regions in the undifferentiated state. Despite the fact that H3K27Ac domains are highly unique in the different cell types, we note that OSN, OTX2 and SMAD1 binding in undifferentiated ESCs is observed prior to the other factors that will mediate the transition to super-enhancer status in the three germ layers (Extended Data Fig. 6e–h, right panels). Similarly, as noted above, regulators of super-enhancers in the germ layers also associate with these regions already in the pluripotent state. This might suggests that TF binding at germ layer specific H3K27Ac domains in the ESCs could be involved or necessary for the future handoff. Possible roles could include active regulatory binding or a way to simply mark super-enhancers; alternatively, it could also provide an active protection from silencing by the highly expressed DNA methylation machinery. In this context it is worth noting that OSN binding in the undifferentiated cells is depleted in a subset of super-enhancers that are highly methylated (Extended Data Fig. 6e–h, bottom right) suggesting a possible binding sensitivity to DNA methylation, which has been reported for OCT4 (Ref 45). f. Left: Alternative lineage chromatin states of dME H3K27Ac super-enhancers (n=1,129, merging 4,717 1kb regions shown as columns in the heatmap). States are defined as in panel c. Center: Corresponding binding of the most enriched TFs in dME. Black bars indicate TF binding. Right: Corresponding binding of selected factors in ESCs. GATA4 and SMAD1 are the most highly enriched factors at dME super-enhancers (Extended Data Fig. 6e, 7). Globally, GATA4 also interacts significantly with SMAD1 and SMAD4 in dME (hypergeometric P < 10−300) but less so in dEN (Fig. 3a, Extended Data Fig. 5c). This suggests that GATA4 interacts with SMAD1/4 at genomic targets and specifically at super-enhancers to act as a possible key regulator of the transition from pluripotent to a mesodermal state in response to BMP signaling. Recent studies have reported that master regulators in various cell types interact with TFs downstream of key signaling pathways in a similar manner. g. Left: Alternative lineage chromatin states of stitched H3K27Ac super-enhancers in dEC (n=506, merging 908 1kb regions shown as columns in the heatmap). States are defined as in panel b. Center: Corresponding binding of the most enriched TFs in dEC. Black bars indicate TF binding. Right: Corresponding binding of selected TFs in ESCs shows that these factors occupy many of these regions in the undifferentiated state. OTX2 is known to play important roles in brain, craniofacial, and sensory organ development,,. In mice, Otx2 is required from E10.5 onward to regulate neuronal subtype identity and neurogenesis in the midbrain, and inhibition of FGF signaling upregulates OTX2 and subsequently induces the neuroectodermal regulator PAX6 (Ref 48). Complementing these previous studies, our results suggest that it may play a central role in mediating the transition from pluripotency to early ectoderm. Interestingly, in dEC OTX2 does not globally associate with SMAD1 outside of super-enhancers to the same degree as in dEN (Fig. 3a). Taken together, we observe differential co-binding between SMAD1 and GATA4 or OTX2 in the respective germ layers that is linked to differential signaling, which may guide the remodeling of the associated chromatin. h. Left: Alternative lineage chromatin states of the top 3,000, 1kb-long H3K27Ac enhancers in dEC, showing a comparable number of genomic regions as in the other cell types. States are defined as in panel b. Center: Corresponding binding of OTX2 and SMAD1 in dEC shows a higher enrichment for these factors at H3K27Ac enhancers than when only surveying the top 908 1kb regions (panel d). Black bars indicate TF binding. Right: Corresponding binding of selected TFs in ESCs shows that these factors occupy many of these regions in the undifferentiated state.
Extended Data Fig. 7
Extended Data Fig. 7. Quantification of cell sorting in dME on GATA4 binding
a. Left: Venn diagrams (top) and heatmaps (bottom) show that the overlap in binding between GATA4 ChIP-seq in sorted CD56+ cells and unsorted dME cells is very similar. In particular, the unique binding sites in unsorted cells (y-axis label 01) also show visible but less significant binding in sorted cells, arguing that unsorted cells do not add many false positive peaks. Conversely, unique binding sites in sorted cells (y-axis label 10) show that less than half of these sites are truly unique, or with no detectable binding in unsorted cells. Right: Venn diagrams (top) and heatmaps (bottom) shows the overlap in binding between two GATA ChIP-seq replicates in unsorted dME populations. The overlap in binding between replicates using unsorted cells is similar to the overlap in binding between sorted and unsorted cells shown on the left. b. Left: Alternative lineage chromatin states of dME H3K27Ac super-enhancers (n=1,129, merging 4,717 1kb regions shown as columns in the heatmap). States are defined in legend (top right, HMR=Highly Methylated Region). Center: Corresponding binding of GATA4 in sorted CD56+ cells, and two unsorted dME replicates (dME1 and dME2). Black bars indicate TF binding. Right: Enrichment P values (−log10) for GATA4 binding at H3K27Ac super-enhancers are slightly more significant (hypergeometric P < 10−300) for unsorted cells than for sorted cells (hypergeometric P < 10−225). This shows that the conclusions for GATA4 in dME are largely unaffected by cell sorting. Moreover, since our enrichment analysis compares overlaps of binding at thousands of sites, this comparison argues that the analysis is in general robust to using unsorted cell populations. c. Enrichment P values (−log10) for the overlap in TF binding and regions that gain or lose DNA methylation relative to ESCs (see Supplementary Information). Possible transition states are defined at the top. Heatmaps display the enrichment of GATA4 binding in sorted CD56+ cells, and two unsorted dME replicates (dME1 and dME2). Unsorted cells have similar enrichment P values (hypergeometric P < 10−300) than sorted cells(hypergeometric P < 10−300). This shows that the methylation conclusions for GATA4 in dME are largely unaffected by cell sorting and again argues that our enrichment analysis is robust to using unsorted cell populations.
Extended Data Fig. 8
Extended Data Fig. 8. related to Fig. 5: Regulation of poised enhancers and other epigenetic state transitions
a. Left: Alternative lineage chromatin states of dEN H3K4me1 super-enhancers (n=309, merging 760 1kb regions shown as columns in the heatmap). Chromatin states that are displayed in the panel are explained in the legend (bottom right, HMR=Highly Methylated Region). Right: Corresponding binding of the most enriched TFs in dEN, where the black bars indicate TF binding. b. Left: Alternative lineage chromatin states of the top 2,000 1kb-long dEN H3K4me1 enhancers in dEN (shown as columns in the heatmap). Chromatin states that are displayed in the panel are defined in the legend (bottom right, HMR=Highly Methylated Region). Right: Corresponding binding of the most enriched TFs in dEN, where the black bars indicate TF binding. Increasing the number of regions displayed shows a higher enrichment for dEN factors at H3K4me1 enhancers than when only surveying the top 760 1kb regions (Extended Data Fig. 8a). c. Enrichment P values (−log10) for the most significant overlaps between all poised putative enhancers (H3K27me3 & H3K4me1) and each TF’s binding profile in the respective cell type. Enrichment P values for dEN and dME (right column) are lower than in ESCs, which is likely the result of the overall smaller number of poised enhancers in those two germ layers. The scale is therefore adjusted for dEN and dME as shown in the respective legends. In ESCs, we find that poised enhancers are highly enriched for binding by OSN, OTX2, TCF4 and SMAD1 in the pluripotent state (Extended Data Fig. 8c–d). In dMS, we see the same regulators along with T, EOMES, and LEF1 are present at poised enhancers (Extended Data Fig. 8c–d, center). In contrast, poised enhancers in dEN show strong enrichment for PRDM1 and many of the regulators mentioned above (Extended Data Fig. 8c–d, right). Lastly, in dME, we find enrichment for SNAI2, which is known for its activity in mesoderm including blood development. d. Summary table of enrichment P values (−log10) displaying the most significant overlaps between the top 500 poised enhancers (H2K27me3 & H3K4me1) and each TF’s binding profile within a given cell type (ESCs, left; dMS, center; dEC, bottom center; dEN and dME, right). Enrichment values are more comparable between ESCs and the germ layers, since we compare TF binding with the same number of poised enhancers (500) in each cell type. The results are consistent with Extended Data Fig. 8c, showing that the same factors are most enriched as when comparing to all poised enhancers. e. Table of enrichment P values (−log10) in overlap between TF binding and regions with different chromatin state transitions (relative to ESCs) within each germ layer (dEN, top; dME, middle; dEC, bottom; see Supplementary Information). Possible epigenetic state transitions are shown on top and states are defined in legend on the top left. Globally, we find a much stronger enrichment for gain of H3K4me1 in dEN than in dME, particularly for the endoderm factors present at the most methylated H3K4me1 domains. Conversely, in dME we find a strong association between remodeling of H3K27Ac and the dME factors that reside at H3K27Ac genomic regions. In concordance with this global trend, GATA4 is associated with dynamics of H3K4me1 in dEN and H3K27Ac in dME. f. Probability (y-axis) of the best match to a given motif (SMAD1 and GATA4) occurring at a given position at regions centered on SMAD1 binding in dME (top) and dEN (bottom). This probability is based only on regions that contain at least one match with score greater than the minimum score defined for this motif by Centrimo. The position of the best GATA4 DNA binding sites (red) are more centrally enriched (P < 10−241, Centrimo) at SMAD1 ChIP-seq peaks in dME (top) than in dEN (bottom).
Extended Data Fig. 9
Extended Data Fig. 9. GATA4 knock down experiments in dEN and dME
a. Experimental design and data collected for the GATA4 knock down (KD) and control experiments in dEN and dME (see Supplementary Information for details). b. Heatmaps of GATA4 normalized occupancy at GATA4 targets (columns) in control and KD cell lines at corresponding genomic regions. GATA4 occupies very similar loci in control and KD cell lines in dME. c. Heatmaps of GATA4 normalized occupancy at GATA4 targets (columns) in control and KD cell lines at corresponding genomic regions. GATA4 occupies very similar loci in control and KD cell lines in dEN. d. Venn diagram of dME H3K27Ac super-enhancers detected using H3K27Ac data in shControl and 3 shGATA4 KD cell lines. Super-enhancers in the shGATA4 KD lines 1, 2, and 3 overlap with super-enhancers in the shControl cell line at a much higher rate than different cell types in Figure 4b. e. Pairwise rate of overlap between super-enhancers detected using different H3K27Ac ChIP experiments. Super-enhancers in the shGATA4 KD lines 1, 2, and 3 overlap with super-enhancers in the shControl cell line at a rate of 51.6%, 52.7%, and 47.4% (left-most bars). In comparison, the KD replicates overlap with one another at a rate of 58.8%, 59.3%, and 52.3%, and wildtype dME replicates overlap at a rate of 61.2% (middle bars). The number of super-enhancers in common between different cell types ESC, dEN, and dME is 14.3%, 13.7%, and 16.7% (right-most bars). Percentages are calculated relative to the experiment with fewer super-enhancers detected. f. Normalized SMAD1 (top) and H3K27Ac (bottom) mean occupancy is lower in dME for the shRNA KD lines versus control lines at SMAD1 sites both far from (distance > 1kb, left panel) and near (distance ≤ 1kb, right panel) from GATA4 binding (see Supplementary Information for details). The smaller decrease in occupancy away from GATA4 binding may be due to indirect effects, such as lower SMAD1 expression or co-binding with other unknown TFs.
Extended Data Fig. 10
Extended Data Fig. 10. related to Fig. 6: TF binding associates with specific loss of DNA methylation in dEN
a. Top: Genome browser tracks for H3K4me3 and H3K27me3 across four of the cell types over the SOX17 locus, zooming out on the region shown in Figure 6a. Bottom: Whole genome bisulfite sequencing (WGBS) based CpG methylation measurements. Specific loss of DNA methylation in dEN and associated chromatin remodeling to a poised state (H3K4me3 and H3K27me3) occurs 240kb upstream of SOX17, which coincides with loss of H3K27me3 and gain of H3K4me3 mark near the SOX17 gene. b. Top: Genome browser tracks for selected TFs in different cell types upstream of SOX17. Bottom: Whole genome bisulfite sequencing (WGBS) based CpG methylation measurements, where each rectangle represents a single CpG. Specific loss of DNA methylation in dEN coincides with specific binding of several endoderm factors. OTX2 and NANOG also bind nearby this region in ESCs. c. WGBS-based average CpG methylation level of 100bp tiles over FOXA1 bound dEN targets in ESCs and the three germ layers shows a specific depletion of DNA methylation in dEN. d. WGBS-based average CpG methylation level of 100bp tiles over FOXA2 bound dEN targets in ESCs and the three germ layers shows a specific depletion of DNA methylation in dEN. e. Distributions of mean DNA methylation difference in dEN between GATA4 KD and control cell lines at 1kb regions centered on dEN GATA4 targets (left, P < 10−10, paired t-test) and at all 1kb regions in the genome (right, P = 1, paired t-test).
Figure 1
Figure 1. TF dynamics during human ESC differentiation
a. Schematic of the human ESC differentiation system including timeline and key signaling pathways that are modulated. b. Normalized RNA expression of selected TFs over the differentiation timeline towards endoderm. c. RNA-seq data of the selected TFs. Factors are ordered by condition where they are most active: ESCs on top, followed by dMS, dEN, dME, and dEC.
Figure 2
Figure 2. Classes of TF binding dynamics in germ layers
a. Classes of dynamics comparing TF binding between successive timepoints (temporal) or between different germ layers (cross-lineage). The schematics, browser images, and Venn diagrams illustrate examples of each class. b. SMAD4 predominantly binds to unique regions in the three germ layers. c. EOMES binding is enhanced from ESCs to dMS and dynamic in dEN. d. OTX2 binding is dynamic in dEN and dEC when compared to ESCs.
Figure 3
Figure 3. TF co-binding relationships and genomic targets
a. Left: Overlap in binding between GATA4 and SMAD1 is greater in dME than in dEN. Similarly, overlap in binding between OTX2 and SMAD1 is greater in dEN than in dEC. Right: Highly significant TF co-binding relationships are assigned a dark blue color, representing −log10 of interaction P value. All TF dynamics and co-binding interactions are clustered and displayed in a matrix, where each row/column represent a single ChIP-seq experiment. The color code indicates the cell type identity for the majority of ChIP-seq profiles making up each cluster. b. Genomic annotations for factors that bind more than 15,000 regions in multiple conditions. c. GATA4 (top) and OTX2 (bottom) binding is associated with different chromatin marks between lineages.
Figure 4
Figure 4. Extended H3K27Ac domains highlight unique TF transitions
a. Browser tracks for H3K27me3 and H3K27Ac across all five cell types as well as GATA4/SMAD1 enrichment over the HAND1 locus in dME. b. Limited overlap of extended H3K27Ac domains between cell types. c. Top: Schematic of different hand-offs in TF regulation at super-enhancers. Bottom: P values (−log10) displaying the most significant overlaps in H3K27Ac super-enhancers (SE) and TF binding for each cell type.
Figure 5
Figure 5. Regulatory dynamics at putative poised enhancers
a. Selected browser tracks for H3K27Ac and H3K4me1 and normalized binding of FOXA1/2, SOX17, and GATA4/6 over the HNF1b locus. Grey vertical bars highlight regions enriched for H3K4me1 in dEN. b. P values (−log10) for three or more of the most enriched DNA binding motifs (rows) at SMAD1 binding per cell type (columns). c. RT-qPCR-based gene expression of selected lineage markers in dME (top) and dEN (bottom), comparing three GATA4 KD and control lines. The mean expression for 22 dEN and 24 dME marker genes (excluding GATA4 and SMAD1) is shown as the last bar in each panel. Error bars display the standard deviation in fold expression change. Asterisk highlights genes with significant (P < .05) change in expression between control and KD replicates. d. Normalized SMAD1 (left) and H3K27Ac (right) occupancy decreases in shRNA KD versus control lines in dME but not in dEN.
Figure 6
Figure 6. Specific loss of DNAme at targets of key lineage TFs
a. Top: Browser tracks for H3K4me3 and H3K27me3 as well as enrichment of selected TFs upstream of SOX17. Bottom: Each rectangle represents a single CpG and its methylation state. Loss of DNAme occurs specifically in dEN, which coincides with changes in chromatin state and specific binding of several known endoderm factors. b. Enrichment P values (−log10) for the overlap in TF binding and regions that gain or lose DNAme relative to ESCs. Possible transition states are defined at the top. Heatmaps display the enrichment of TF binding in ESCs, dMS (left), dEN, dEC (center), and dME (right) at differentially methylated regions in the three germ layers (rows). c. WGBS based average CpG methylation level of 100bp tiles over GATA6 bound dEN targets. d. WGBS mean methylation level at OTX2 dEC targets. e. WGBS mean methylation level at GATA4 dEN and dME targets. f. RRBS based average CpG methylation level of 100bp tiles over GATA4 targets in control and GATA4 KD cell lines in dEN (left) and dME (right). For comparison, WGBS ESC mean methylation level is also shown (grey).

References

    1. Boyer LA, et al. Core transcriptional regulatory circuitry in human embryonic stem cells. Cell. 2005;122:947–956. - PMC - PubMed
    1. Young RA. Control of the embryonic stem cell state. Cell. 2011;144:940–954. - PMC - PubMed
    1. Kunarso G, et al. Transposable elements have rewired the core regulatory network of human embryonic stem cells. Nature genetics. 2010;42:631–634. - PubMed
    1. Villar D, Flicek P, Odom DT. Evolution of transcription factor binding in metazoans - mechanisms and functional implications. Nature reviews. Genetics. 2014;15:221–233. - PMC - PubMed
    1. Smith ZD, Meissner A. DNA methylation: roles in mammalian development. Nature reviews. Genetics. 2013;14:204–220. - PubMed

Publication types

MeSH terms

Associated data