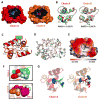
Opposing orientations of the anti-psychotic drug trifluoperazine selected by alternate conformations of M144 in calmodulin
- PMID: 25694384
- PMCID: PMC4400249
- DOI: 10.1002/prot.24781
Opposing orientations of the anti-psychotic drug trifluoperazine selected by alternate conformations of M144 in calmodulin
Abstract
The anti-psychotic drug trifluoperazine (TFP) is an antagonist observed to bind to calcium-saturated calmodulin ((Ca(2+) )4 -CaM) at ratios of 1:1 (1CTR), 2:1 (1A29), and 4:1 (1LIN). Each structure contains one TFP bound in the hydrophobic cleft of the C-domain of CaM. However, the orientation of the trifluoromethyl (CF3 ) moiety differs among them: it is buried in the C-domain cleft of 1A29 and 1LIN, but protrudes from 1CTR. We report a 2.0 Å resolution crystallographic structure (4RJD) of TFP bound to the (Ca(2+) )-saturated C-domain of CaM (CaMC ). The asymmetric unit contains two molecules of (Ca(2+) )2 -CaMC . Chain backbones were nearly identical, but the orientation of TFP in the cleft of Chain A matched 1A29/1LIN, while TFP bound to Chain B matched 1CTR. This was accommodated by a flip of the M144 sidechain and small changes in sidechains of M109 and M145. Docking simulations suggested that the rotamer conformation of M144 determined the orientation of TFP within the cleft of (Ca(2+) )2 -CaMC . Chains A and B show that the open cleft of (Ca(2+) )2 -CaMC is promiscuous in accepting TFP in reversed directions under the same crystallization conditions. Observing multiple orientations of an antagonist bound to a single protein highlights the challenge of designing highly specific pharmaceuticals, and may have importance for QSAR of other CF3 -containing drugs such as fluoxetine (anti-depressant) or efavirenz (reverse transcriptase inhibitor). This study emphasizes that a single structure of a complex represents an energetically accessible state, but does not necessarily show the full range of energetically equivalent states.
Keywords: CF3; QSAR; TFP; alternate conformers; drug specificity; energetics; molecular recognition; pharmaceuticals; promiscuous binding; thermodynamics; trifluoromethyl.
© 2015 Wiley Periodicals, Inc.
Figures


Similar articles
-
Allosteric effects of the antipsychotic drug trifluoperazine on the energetics of calcium binding by calmodulin.Proteins. 2010 Aug 1;78(10):2265-82. doi: 10.1002/prot.22739. Proteins. 2010. PMID: 20544963 Free PMC article.
-
Molecular dynamics simulation of the calmodulin-trifluoperazine complex in aqueous solution.Biopolymers. 2001 Apr 5;58(4):410-21. doi: 10.1002/1097-0282(20010405)58:4<410::AID-BIP1017>3.0.CO;2-0. Biopolymers. 2001. PMID: 11180054
-
Drug binding by calmodulin: crystal structure of a calmodulin-trifluoperazine complex.Biochemistry. 1994 Dec 27;33(51):15259-65. doi: 10.1021/bi00255a006. Biochemistry. 1994. PMID: 7803388
-
Ca2+-bound calmodulin forms a compact globular structure on binding four trifluoperazine molecules in solution.Biochem J. 2000 Apr 1;347 Pt 1(Pt 1):211-5. Biochem J. 2000. PMID: 10727421 Free PMC article.
-
Structure, dynamics and interaction with kinase targets: computer simulations of calmodulin.Biochim Biophys Acta. 2004 Mar 11;1697(1-2):289-300. doi: 10.1016/j.bbapap.2003.11.032. Biochim Biophys Acta. 2004. PMID: 15023369 Review.
Cited by
-
Ca2+-saturated calmodulin binds tightly to the N-terminal domain of A-type fibroblast growth factor homologous factors.J Biol Chem. 2021 Jan-Jun;296:100458. doi: 10.1016/j.jbc.2021.100458. Epub 2021 Feb 24. J Biol Chem. 2021. PMID: 33639159 Free PMC article.
-
Markov state modelling reveals heterogeneous drug-inhibition mechanism of Calmodulin.PLoS Comput Biol. 2022 Oct 7;18(10):e1010583. doi: 10.1371/journal.pcbi.1010583. eCollection 2022 Oct. PLoS Comput Biol. 2022. PMID: 36206305 Free PMC article.
-
S100 proteins as therapeutic targets.Biophys Rev. 2018 Dec;10(6):1617-1629. doi: 10.1007/s12551-018-0471-y. Epub 2018 Oct 31. Biophys Rev. 2018. PMID: 30382555 Free PMC article. Review.
References
-
- Babu YS, Bugg CE, Cook WJ. Three-dimensional structure of calmodulin. In: Cohen P, Klee CB, editors. Calmodulin. 256. Elsevier; 1988. pp. 83–89.
-
- Barbato G, Ikura M, Kay LE, Pastor RW, Bax A. Backbone dynamics of calmodulin studied by 15N relaxation using inverse detected two-dimensional NMR spectroscopy: The central helix is flexible. Biochemistry. 1992;31:5269–5278. - PubMed
-
- Crouch TH, Klee CB. Positive Cooperative Binding of Calcium to Bovine Brain Calmodulin. Biochemistry. 1980;19:3692–3698. - PubMed
-
- Shea MA, Verhoeven AS, Pedigo S. Calcium-Induced Interactions of Calmodulin Domains Revealed by Quantitative Thrombin Footprinting of Arg37 and Arg106. Biochemistry. 1996;35:2943–2957. - PubMed
-
- Pedigo S, Shea MA. Quantitative endoproteinase GluC footprinting of cooperative Ca2+ binding to calmodulin: Proteolytic susceptibility of E31 and E87 indicates interdomain interactions. Biochemistry. 1995;34:1179–1196. - PubMed
Publication types
MeSH terms
Substances
Associated data
- Actions
Grants and funding
LinkOut - more resources
Full Text Sources
Other Literature Sources
Miscellaneous

