. 2015 Mar 15;194(6):2683-95.
doi: 10.4049/jimmunol.1402125. Epub 2015 Feb 18.

Immunoprevention of chemical carcinogenesis through early recognition of oncogene mutations

Affiliations

Immunoprevention of chemical carcinogenesis through early recognition of oncogene mutations

Tahseen H Nasti et al. J Immunol. .

Abstract

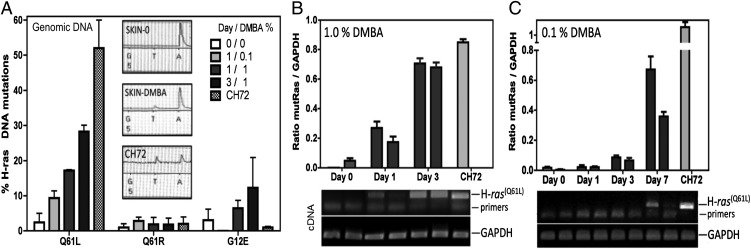
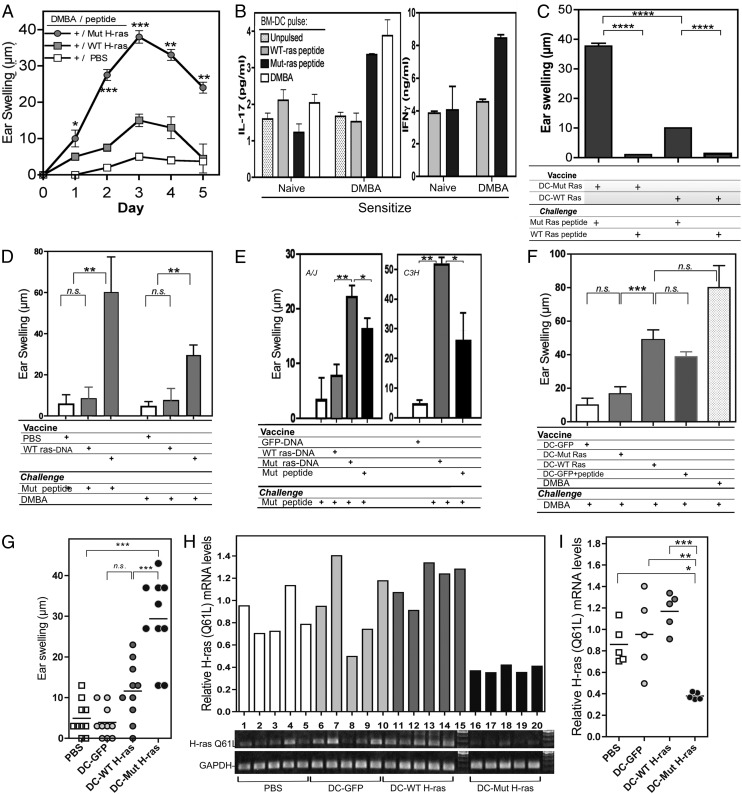
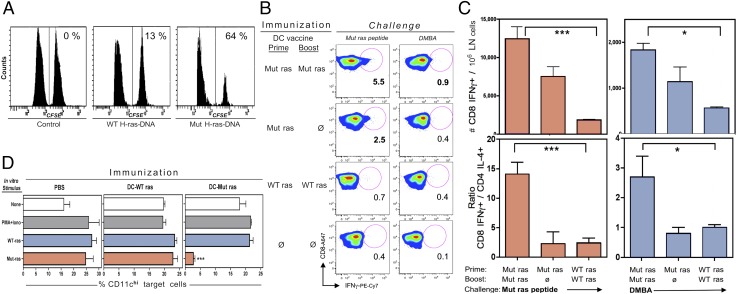
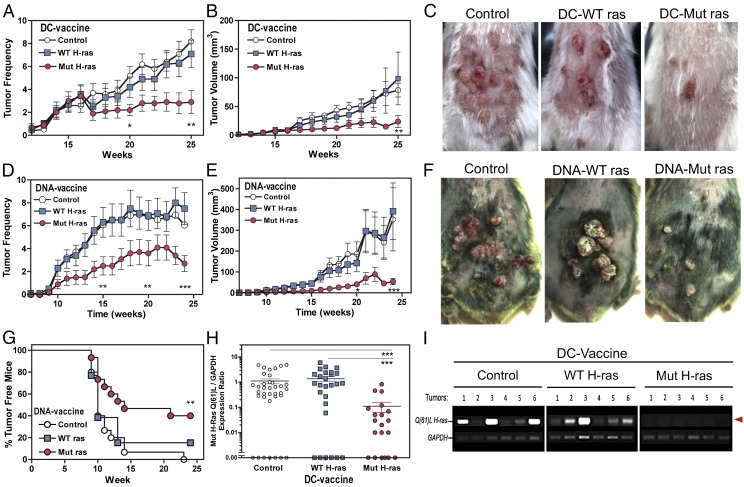
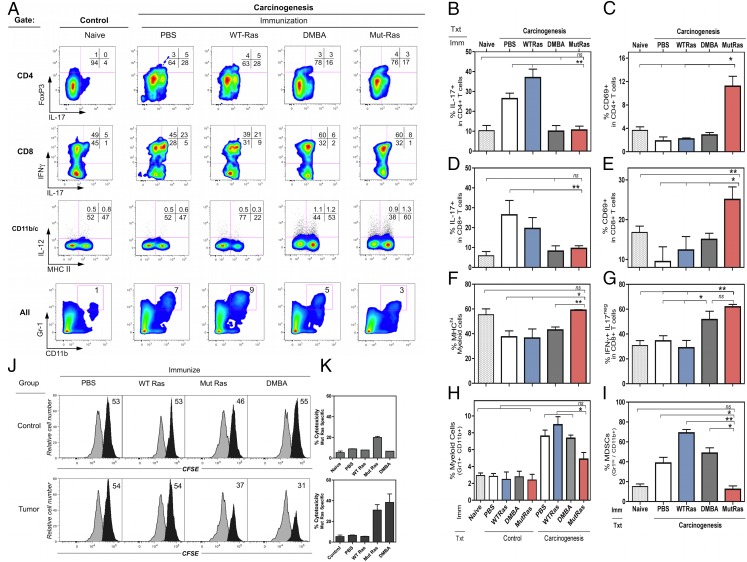
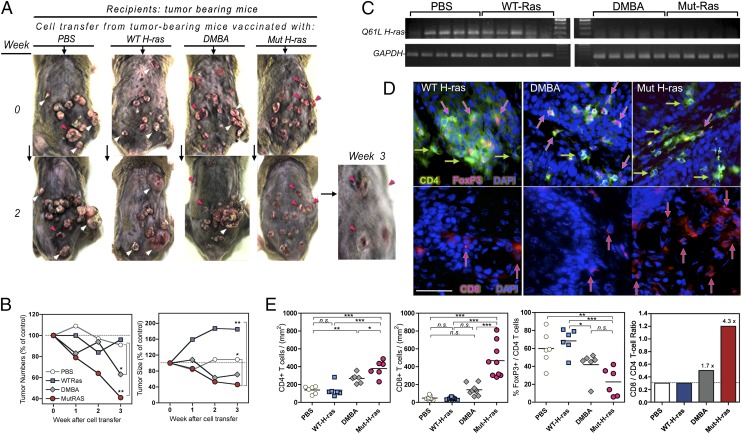
Prevention of tumors induced by environmental carcinogens has not been achieved. Skin tumors produced by polyaromatic hydrocarbons, such as 7,12-dimethylbenz(a)anthracene (DMBA), often harbor an H-ras point mutation, suggesting that it is a poor target for early immunosurveillance. The application of pyrosequencing and allele-specific PCR techniques established that mutations in the genome and expression of the Mut H-ras gene could be detected as early as 1 d after DMBA application. Further, DMBA sensitization raised Mut H-ras epitope-specific CTLs capable of eliminating Mut H-ras(+) preneoplastic skin cells, demonstrating that immunosurveillance is normally induced but may be ineffective owing to insufficient effector pool size and/or immunosuppression. To test whether selective pre-expansion of CD8 T cells with specificity for the single Mut H-ras epitope was sufficient for tumor prevention, MHC class I epitope-focused lentivector-infected dendritic cell- and DNA-based vaccines were designed to bias toward CTL rather than regulatory T cell induction. Mut H-ras, but not wild-type H-ras, epitope-focused vaccination generated specific CTLs and inhibited DMBA-induced tumor initiation, growth, and progression in preventative and therapeutic settings. Transferred Mut H-ras-specific effectors induced rapid tumor regression, overcoming established tumor suppression in tumor-bearing mice. These studies support further evaluation of oncogenic mutations for their potential to act as early tumor-specific, immunogenic epitopes in expanding relevant immunosurveillance effectors to block tumor formation, rather than treating established tumors.


Figures

FIGURE 1.
FIGURE 1.
Early detection of H-ras mutations and oncogene expression in DMBA-treated skin. (A) Identification of DMBA-induced H-ras codon 61 mutations by pyrosequencing. Quantification of Q61L, Q61R, and G12E mutant H-ras alleles in genomic DNA from samples of skin treated with 0, 0.1 (400 nmol), or 1% (4 μmol) DMBA after 1 or 3 d (n = 2 mice per treatment; mean ± range is shown). Insets: pyrosequence tracing peaks for missense codon 61 mutation A → T. Pyrosequence quantification validation: the CH72 cell line, heterozygous for the H-ras Q61L allele, indicates 50% of its H-ras alleles are mutated. (B and C) Relative expression of Mut H-ras mRNA in (B) 1% or (C) 0.1% DMBA-treated skin samples. Skin samples from two mice per condition were examined. Densitometry of amplicons generated by H-ras Q61L-specific ACB-PCR and GAPDH-specific PCR of cDNA made from individual skin tissues. CH72 mRNA serves as a positive control. Bar graphs display Mut-H-ras gene expression levels when normalized to expression levels of a housekeeping gene GAPDH, as shown. The corresponding gel used to provide densitometry readings is shown below each bar graph (mean ± range of duplicate densitometry readings for each sample is shown). The data are from one of two separate experiments.
FIGURE 2.
FIGURE 2.
Specificity of DMBA and Mut H-ras T cell responses. (A) DMBA-sensitized T cells respond to Mut H-ras peptide elicitation. (A) DTH responses. Ear-swelling responses elicited by the indicated peptide after DMBA sensitization are shown (n = 5 per group). (B) Cytokine production by DMBA-sensitized T cells stimulated by Mut H-ras peptide–pulsed BMDCs. T cells from the LNs of DMBA-sensitized mice were cocultured with DMBA-pulsed or unpulsed BMDCs from naive mice at a 1:10 ratio for 48 h. The mean and range concentration values of duplicate wells for IL-17 and IFN-γ ELISAs are shown. (CF) Mut H-ras vaccines induce responses that can be elicited by DMBA. (C) Specificity of DC-based vaccine. Mice were vaccinated, then challenged by i.d. injection of the ear with WT or Mut H-ras peptide. Specific ear-swelling responses on day 3 are shown (n = 3 per group, repeated twice). (D) Engineered DC vaccination induces responses that are elicited by DMBA challenge. DC-GFP serves as a specificity control. Note that day 3 responses induced by Mut H-ras–engineered DC and peptide-pulsed DC-GFP to DMBA elicitation are equivalent. DC-GFP serves as a specificity control. (E) Specificity of DNA-based vaccine in A/J and C3H/HeN mice. A/J (left) or C3H/HeN (right) mice receiving DNA-based vaccines generate comparable responses to Mut H-ras peptide. Day 3 response is shown. (F) Mut H-ras DNA vaccination responses can be elicited by Mut H-ras peptide or DMBA. Day 3 response is shown (n = 5 per group, more than two experiments each). (GI) DC–Mut H-ras vaccines eradicate Mut-H-ras mRNA expression in DMBA-treated skin. DC-vaccinated mice were challenged by either (G) i.d. injection of Mut H-ras peptide (100 μg) or (H and I) painting the dorsal skin with 100 μL 0.1% DMBA (400 nmol) (n = 5 mice per group). (G) Specific ear-swelling responses on day 3 and (H and I) Mut H-ras mRNA expression levels in skin, assessed by ACB-PCR on day 7. (H) gel (bottom). GAPDH expression is a loading control (bottom row). (H, top) Relative H-ras (Q61L) mRNA expression: the ratio of Mut H-ras over the GAPDH densitometry values is shown for tumors per mouse (3 tumors pooled per mouse, n = 5 mice per group). (I) Scatter plot of data in (H). Significant differences (by Student t test) between Mut H-ras–immunized samples from controls are shown. *p < 0.05, **p < 0.01, ***p < 0.001. n.s., not significant.
FIGURE 3.
FIGURE 3.
Vaccine-induced CTL activity and CD8 T cell expansion. (A) In vivo CTL assay. C3H/HeN mice were immunized and boosted with DNA-based vaccines or PBS (Control), then injected with CFSE-labeled splenocytes pulsed with WT H-ras (CFSElo) or Mut H-ras (CFSEhi) peptides. The CFSE-stained cells remaining in spleen were analyzed the following day. The % specific cytotoxicity is indicated. (B and C) DC-based immunization raises DMBA-responsive Mut H-ras–specific effector T cells. A/J mice were immunized with DC vaccines once (Prime only) or twice (Prime/Boost), as indicated. At 10 d later, mice were challenged with either Mut H-ras peptide or DMBA. At 3 d later, LN cells were prepared and cultured with PMA + ionophore (B and C) or the indicated stimulus (D) and then stained for intracellular cytokines and phenotypic markers. (B and C) IFN-γ+ CD8 T cells expand in a vaccine dose–dependent manner. (B) IFN-γ+ CD8+ T cells. Mut ras peptide or DMBA elicits IFN-γ+ CD8 cells. The % of IFN-γ+ gated CD8 cells is shown. (C) Selective expansion of CD8 over CD4 T cells. The absolute number of IFN-γ+ CD8 T cells per million LN cells expanded in vivo by either Mut ras peptide or DMBA challenge (top row). CD8/CD4 effector cell ratio = the number of IFN-γ+ CD8 T cells over the number of IL-4+ CD4 T cells per million LN cells (mean ± SEM of triplicate mice). (D) Ag specificity of CTL. Bar graphs display the % of CD11chi target cells within the CD11c+ gate for each set of stimuli per immunized group. LN cells from immunized mice were harvested 3 d after DMBA Ag elicitation and then cultured for 6 h with PMA + ionophore or overnight with peptides, as indicated. The percentage of CD11chi target cells in the CD11c DC gate was determined by flow cytometric analysis. The presence of WT H-ras peptide or PMA + ionophore did not affect DC profiles; however, Mut H-ras peptide cultures lost 87% of CD11chi cells. (n = 3 per group). Student t test: *p < 0.05, ***p < 0.001 (one of more than three similar experiments).
FIGURE 4.
FIGURE 4.
Immunoprevention against chemical carcinogenesis in two mouse strains and evidence for immunoediting. (AC) Engineered DC-based vaccination of A/J mice. Mice were immunized twice with the indicated DC vaccine, then subjected to DMBA/TPA carcinogenesis over 25 wk (n = 20 per group). The individual number of tumors per mouse (A) and the average tumor volume per mouse (B) per group are shown (mean ± SEM). Tumor incidence and growth rates were inhibited by 70% and 90%, respectively (the Tukey significance test, p < 0.01). (A and B) Two-way ANOVA and the Tukey posttest calculated significance are indicated: *p < 0.05, **p < 0.01. (C) Photodocumentation of representative mice per vaccination group is shown. (DG) DNA-based epicutaneous vaccination of C3H/HeN mice. Mice received three vaccinations over 15 d, then were subjected to DMBA/TPA carcinogenesis over 24 wk (n = 20 per group). (D) The average tumor numbers per mouse in each group. (E) The average tumor volume per mouse in each group. The Mut H-ras DNA–vaccinated group developed 50% fewer tumors, and tumor growth was inhibited by >85% (p < 0.01, p < 0.001, respectively). (F) Representative photographs of tumors that develop in DNA-vaccinated mice. (G) Tumor-free plot. Tumor penetrance was inhibited in C3H/HeN mice immunized with Mut H-ras DNA–based vaccine. Tumor-free mice are defined as having no tumors or only small tumors < 3 mm3. (H and I) Immunoediting in tumors from Mut H-ras–vaccinated mice. (H) Relative quantification of Mut H-ras mRNA expression levels in individual tumors. The densitometry ratio for Mut H-ras ACB-PCR and matched GAPDH amplicon products of each tumor sample, as shown for six tumors in (I), as individual data points. The number of tumors screened was as follows: PBS, n = 30; DC–WT H-ras, n = 25; DC–Mut H-ras, n = 20. Expression was negligible in 45% of tumors from Mut H-ras–vaccinated mice and in 15–22% of tumors from the control groups. (G and H) Two-way ANOVA statistical significance is indicated: **p < 0.01, ***p < 0.001. (I) Loss of H-ras Q61L mutation expression in tumors from DC–Mut H-ras–vaccinated mice. The Q61L H-ras allele (upper band, red arrow) detected by ACB-PCR in mRNA from individual tumors harvested from A/J mice after 25 wk of carcinogenesis. GAPDH serves as an internal gene expression control.
FIGURE 5.
FIGURE 5.
Phenotypic and functional characterization of tumor-bearing vaccinated mice: (A) Flow cytometry multivariate plots. (BI) Subset quantification in LNs (duplicate mice; mean ± range): (B) IL-17+ CD4 T cells; (C) CD69+ CD4 T cells; (D) IL-17+ CD8 T cells; (E) CD69+ CD8 T cells; (F) IL-12+ MHChi cells; (G) IFN-γ+ IL-17 CD8 T cells; (H) Gr1+ CD11c+ cells. Control: mice are vaccinated, DMBA treated, but not TPA treated. Carcinogenesis: mice are vaccinated, DMBA and TPA treated for 20 wk. (I) Gr-1hi, CD11b+ cells. Fold change from control (dotted line). Student t test: *p < 0.05, **p < 0.01. (J and K) In vivo CTL activity detected in immunized control and tumor-bearing mice. (J). Histogram display of CFSElo and CFSEhi target cells in the spleen, 1 d after target cell transfer. Gated CFSE-labeled target cells: CFSElo control (white) and the % of CFSEhi peptide–pulsed population (black) per sample (n = 3). (K) The % of Mut-H-ras–specific cytotoxicity for each group (mean ± SEM).
FIGURE 6.
FIGURE 6.
Therapeutic regression of established tumors by transfer of cells from Mut H-ras–immunized, tumor-bearing mice. LN and splenocytes (1:4 cells) from carcinogenesis-treated vaccinated mice were harvested at 28 wk and pooled for infusion into control GFP-vaccinated tumor-bearing mice (n = 2 per group). Phenotypic analysis indicated there were no significant differences in T cells contained in each pool: 3 million CD4 (range: 2.8–3.3) and 1 million CD8 (range: 1.4–1.6) T cells were transferred. (A) Effect of cell transfer on established tumors. Photos of tumors in recipient mice over 3 wk; arrows highlight tumor progression (white) and regression (red). Magnified view (original magnification ×3.6): tumor regression in Mut H-ras recipient mice at 3 wk. (B) Kinetics of tumor growth and regression. Tumor change from week 0: average tumor number per mouse (left), average tumor size per tumor (right). (C) Immunoediting of tumor H-ras expression. Tumor biopsy specimens obtained at 30 wk were analyzed for Mut H-ras mRNA expression by ACB-PCR (n = 5 per group). GAPDH gene expression of each sample is a loading control (upper panels). (D) Skin tumor infiltrating CD4 T cells. Cryosections of tumors stained with conjugated Abs: mouse CD4 (FITC+, green), Foxp3+ (PE), and DAPI (blue nuclei). Foxp3+ cells have pink nuclear staining (pink arrows). Foxp3 CD4+ T cells are indicated by green arrows (upper panels). CD8+ T cell infiltration in and around cutaneous tumors. Mouse CD8+ T cells [PE, red arrows (lower panels)]. Scale bar, 50 μm. (E) Enumeration of T cell subsets in tumor sections. Tumors infiltrating CD8, CD4, and Foxp3+ T cells were counted in at least five non-overlapping views per section. (n = 6–8 tumors per group). The % of CD4 (green) T cells stained with Foxp3 (pink)+ nuclei was determined in the same view, as described. Bar graph depicts the ratio of CD8:CD4 average values per group. Text indicates the fold increase in the CD8:CD4 ratio compared with mock (PBS)–vaccinated mice. *p < 0.05, **p < 0.01, ***p < 0.001. n.s., not significant.

Similar articles

Cited by

References

    1. Rosenberg S. A., Yang J. C., Restifo N. P. 2004. Cancer immunotherapy: moving beyond current vaccines. Nat. Med. 10: 909–915. - PMC - PubMed
    1. Burnet F. M. 1970. The concept of immunological surveillance. Prog. Exp. Tumor Res. 13: 1–27. - PubMed
    1. Everall J. D., Dowd P. M. 1978. Influence of environmental factors excluding ultra violet radiation on the incidence of skin cancer. Bull. Cancer 65: 241–247. - PubMed
    1. Hoffmann D., Rivenson A., Hecht S. S. 1996. The biological significance of tobacco-specific N-nitrosamines: smoking and adenocarcinoma of the lung. Crit. Rev. Toxicol. 26: 199–211. - PubMed
    1. Hecht S. S. 2002. Cigarette smoking and lung cancer: chemical mechanisms and approaches to prevention. Lancet Oncol. 3: 461–469. - PubMed

Publication types

MeSH terms