. 2015 Feb;5(1):69-77.
doi: 10.3978/j.issn.2223-4292.2014.11.32.

Real-time automated thickness measurement of the in vivo human tympanic membrane using optical coherence tomography

Affiliations

Real-time automated thickness measurement of the in vivo human tympanic membrane using optical coherence tomography

Zita Hubler et al. Quant Imaging Med Surg. 2015 Feb.

Abstract

Background: Otitis media (OM), an infection in the middle ear, is extremely common in the pediatric population. Current gold-standard methods for diagnosis include otoscopy for visualizing the surface features of the tympanic membrane (TM) and making qualitative assessments to determine middle ear content. OM typically presents as an acute infection, but can progress to chronic OM, and after numerous infections and antibiotic treatments over the course of many months, this disease is often treated by surgically inserting small tubes in the TM to relieve pressure, enable drainage, and provide aeration to the middle ear. Diagnosis and monitoring of OM is critical for successful management, but remains largely qualitative.

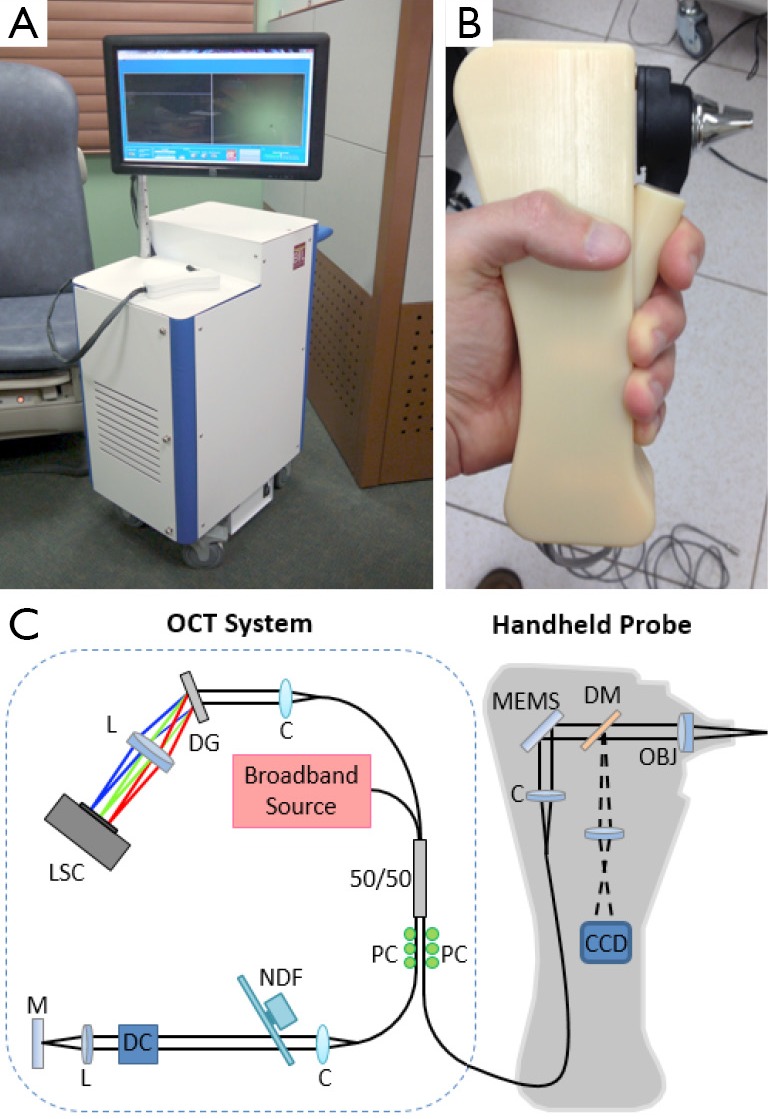
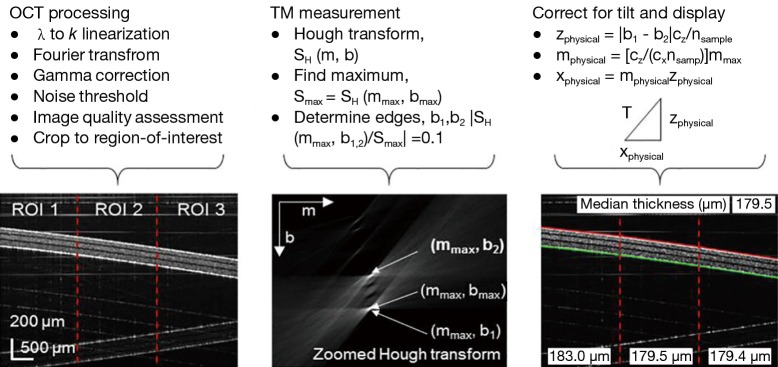
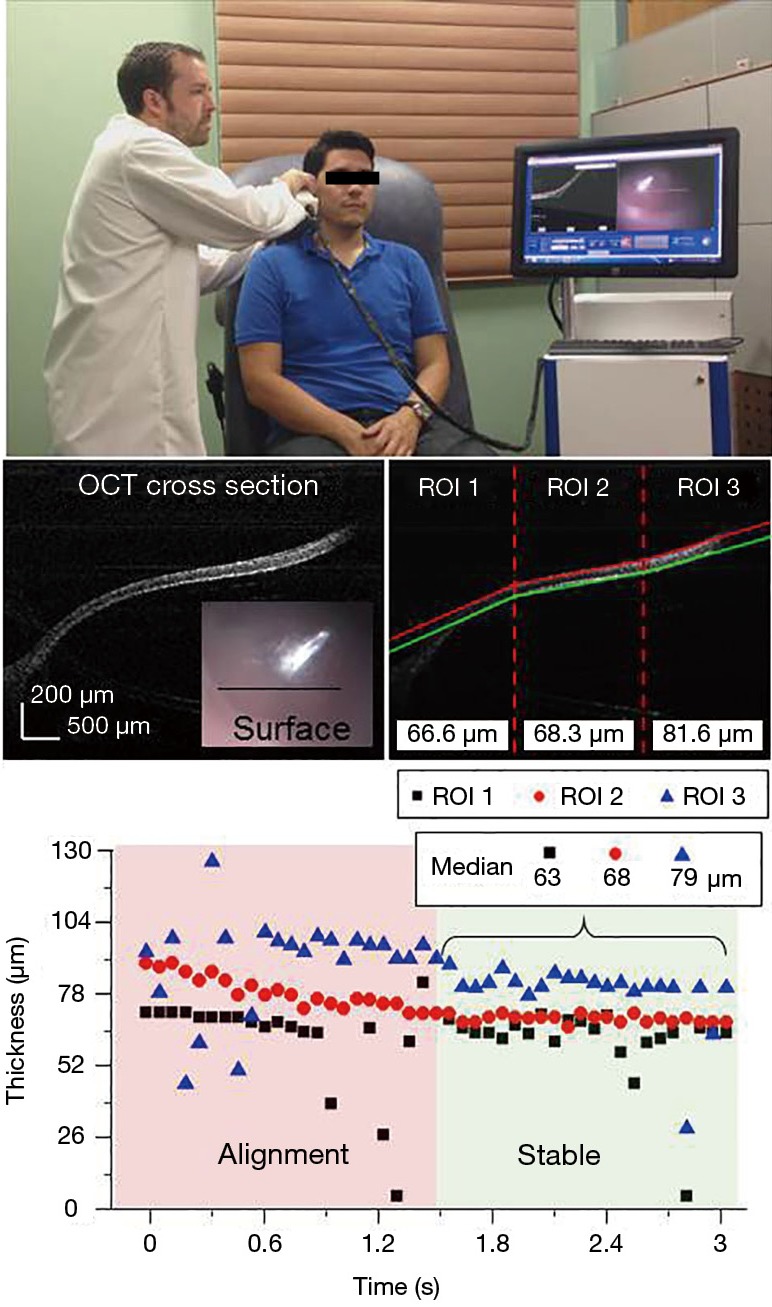
Methods: We have developed an optical coherence tomography (OCT) system for high-resolution, depth-resolved, cross-sectional imaging of the TM and middle ear content, and for the quantitative assessment of in vivo TM thickness including the presence or absence of a middle ear biofilm. A novel algorithm was developed and demonstrated for automatic, real-time, and accurate measurement of TM thickness to aid in the diagnosis and monitoring of OM and other middle ear conditions. The segmentation algorithm applies a Hough transform to the OCT image data to determine the boundaries of the TM to calculate thickness.

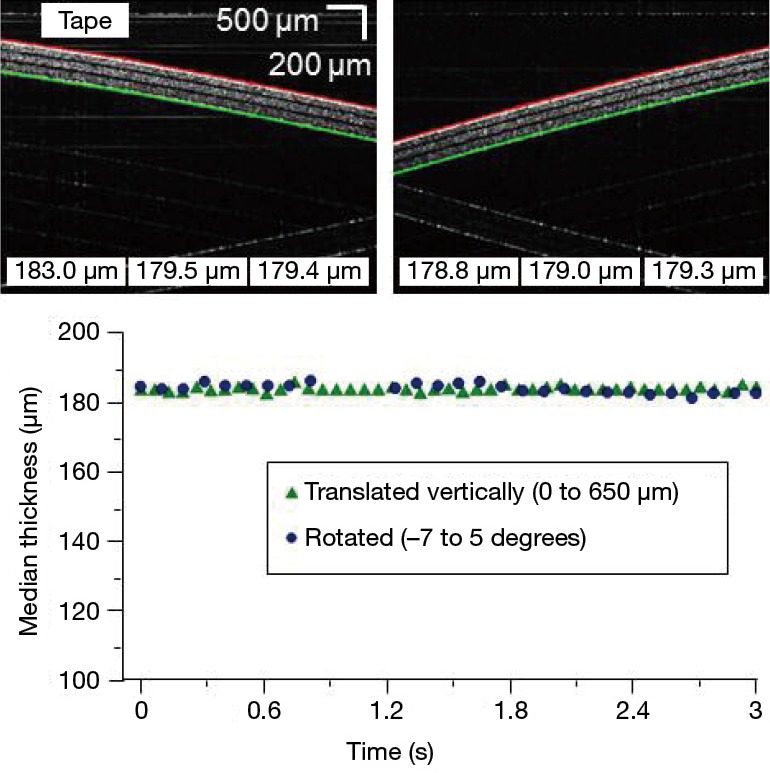
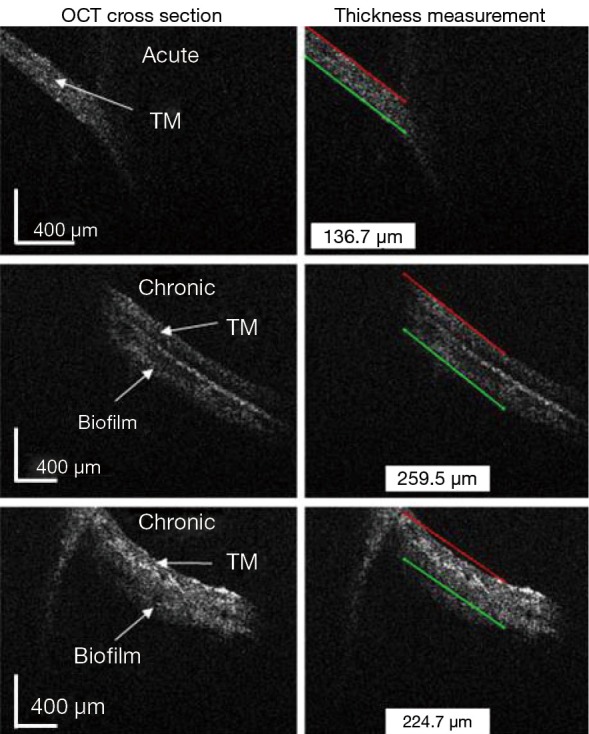
Results: The use of OCT and this segmentation algorithm is demonstrated first on layered phantoms and then during real-time acquisition of in vivo OCT from humans. For the layered phantoms, measured thicknesses varied by approximately 5 µm over time in the presence of large axial and rotational motion. In vivo data also demonstrated differences in thicknesses both spatially on a single TM, and across normal, acute, and chronic OM cases.

Conclusions: Real-time segmentation and thickness measurements of image data from both healthy subjects and those with acute and chronic OM demonstrate the use of OCT and this algorithm as a robust, quantitative, and accurate method for use during real-time in vivo human imaging.

Keywords: Optical coherence tomography (OCT); automated; ear infection; otitis media (OM); real-time; tympanic membrane (TM).


Figures

Figure 1
Figure 1
Photos and schematic of an OCT imaging system with a handheld probe. (A) Photo of the portable cart with touch screen display; (B) photo of the handheld imaging probe compatible with otoscope ear specula; (C) schematic of OCT system with handheld imaging probe. OBJ, objective; DM, dichroic mirror; MEMS, micro-electro-mechanical-system mirror; C, collimator; CCD, charge-coupled device camera; PC, polarization controller; 50/50, two-by-two fiber coupler; NDF, neutral density filter; DC, dispersion compensation; L, lens; M, mirror; DG: diffraction grating; LSC, line-scan camera; OCT, optical coherence tomography.
Figure 2
Figure 2
Thickness measurement steps. Starting from the far left, standard OCT processing is performed on the raw data and an image quality metric is calculated. If sufficient signal is measured, the algorithm continues. A Hough transform is then performed to find the angle and thickness of the TM. To correct for the tilt of the TM, a right triangle was formed and the hypotenuse (T) measured the thickness of the TM. OCT, optical coherence tomography; TM, tympanic membrane; ROI, regions-of-interest.
Figure 3
Figure 3
Real-time OCT imaging and automated segmentation and thickness measurement of a tape phantom under user rotation and at various incident angles of imaging (27). The multi-layer tape phantom is used to as a model of the human TM. The numerical values across the bottom indicate the automated thickness measurement at different points across the image. The median thickness (in microns) is given in the upper right corner. OCT, optical coherence tomography; TM, tympanic membrane. Available online: http://www.asvide.com/articles/386
Figure 4
Figure 4
Real-time OCT imaging and automated segmentation and thickness measurement of a tape phantom under user translation along the direction of imaging (28). The numerical values across the bottom indicate the automated thickness measurement at different points across the image. The median thickness (in microns) is given in the upper right corner. OCT, optical coherence tomography. Available online: http://www.asvide.com/articles/387
Figure 5
Figure 5
Testing on a phantom sample. Shown on top are still shots from layers of tape at different angles along with the corresponding thickness measurements. Below, the median of all three values is plotted over time for two different datasets (Figures 3,4). The peak-to-peak variation over time for both datasets was approximately 5 µm.
Figure 6
Figure 6
In vivo OCT imaging of the human tympanic membrane using a portable OCT system with a handheld probe (29). The probe and system enables real-time acquisition and display of a CCD-based image of the surface of the TM, a cross-sectional OCT image, and the automated segmentation and thickness measurement of the TM. OCT, optical coherence tomography; TM, tympanic membrane; CCD, charge-coupled device camera. Available online: http://www.asvide.com/articles/388
Figure 7
Figure 7
In vivo normal TM imaging. Shown on top is a still shot from Figure 6, imaging a healthy human volunteer. In the middle is an OCT cross section with thicknesses measured in real time for each ROI (Figure 8). The traditional surface image of the TM is shown as an inset. On the bottom is a plot over time of the measured thickness in each ROI. The varying thickness across the scan is highlighted with the calculated median using the second half of the data. TM, tympanic membrane; OCT, optical coherence tomography; ROI, regions-of-interest.
Figure 8
Figure 8
Real-time OCT imaging and automated segmentation and thickness measurement of the in vivo human tympanic membrane (normal) (30). This data was collected during the imaging session shown in Figure 6. The numerical values across the bottom indicate the automated thickness measurement at different points across the image. The median thickness (in microns) is given in the upper right corner. OCT, optical coherence tomography. Available online: http://www.asvide.com/articles/389
Figure 9
Figure 9
In vivo acute and chronic OM imaging. Shown are in vivo OCT cross sections with the corresponding thickness measurements for one acute and two chronic OM cases. Inflammation in the acute case and the possible presence of biofilm in the chronic cases resulted in varying thickness measurements. OM, otitis media; OCT, optical coherence tomography; TM, tympanic membrane

References

    1. Klein JO. Otitis media. Clin Infect Dis 1994;19:823-33. - PubMed
    1. Shekelle P, Takata G, Chan LS, Mangione-Smith R, Corley PM, Morphew T, Morton S. Diagnosis, natural history, and late effects of otitis media with effusion. Evid Rep Technol Assess (Summ) 2002;(55):1-5. - PMC - PubMed
    1. Lieberthal AS, Carroll AE, Chonmaitree T, Ganiats TG, Hoberman A, Jackson MA, Joffe MD, Miller DT, Rosenfeld RM, Sevilla XD, Schwartz RH, Thomas PA, Tunkel DE. The diagnosis and management of acute otitis media. Pediatrics 2013;131:e964-99. - PubMed
    1. Shelton RL, Jung W, Sayegh SI, McCormick DT, Kim J, Boppart SA. Optical coherence tomography for advanced screening in the primary care office. J Biophotonics 2014;7:525-33. - PMC - PubMed
    1. Jung W, Kim J, Jeon M, Chaney EJ, Stewart CN, Boppart SA. Handheld optical coherence tomography scanner for primary care diagnostics. IEEE Trans Biomed Eng 2011;58:741-4. - PMC - PubMed