. 2015 Apr 1;113(7):2934-52.
doi: 10.1152/jn.01054.2014. Epub 2015 Feb 18.

Diverse cortical codes for scene segmentation in primate auditory cortex

Affiliations

Diverse cortical codes for scene segmentation in primate auditory cortex

Brian J Malone et al. J Neurophysiol. .

Abstract

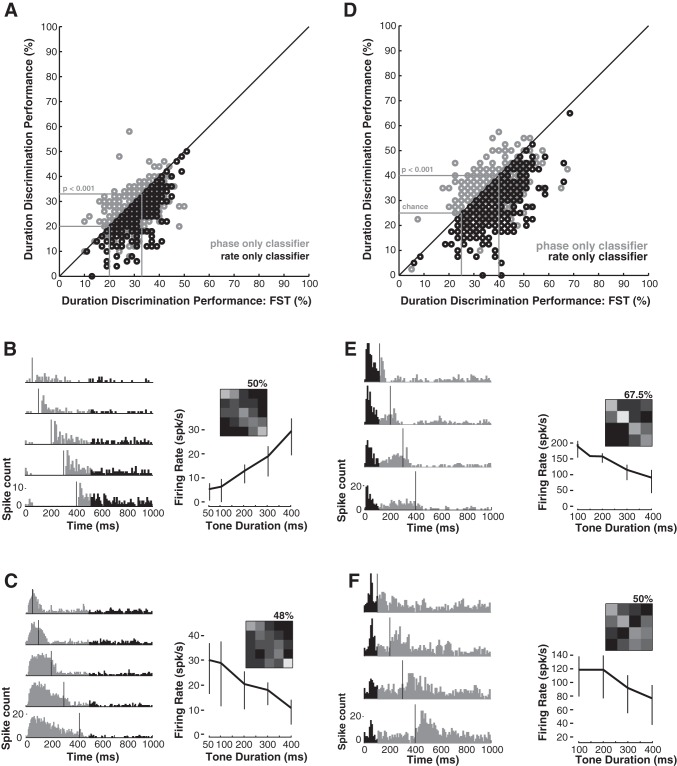
The temporal coherence of amplitude fluctuations is a critical cue for segmentation of complex auditory scenes. The auditory system must accurately demarcate the onsets and offsets of acoustic signals. We explored how and how well the timing of onsets and offsets of gated tones are encoded by auditory cortical neurons in awake rhesus macaques. Temporal features of this representation were isolated by presenting otherwise identical pure tones of differing durations. Cortical response patterns were diverse, including selective encoding of onset and offset transients, tonic firing, and sustained suppression. Spike train classification methods revealed that many neurons robustly encoded tone duration despite substantial diversity in the encoding process. Excellent discrimination performance was achieved by neurons whose responses were primarily phasic at tone offset and by those that responded robustly while the tone persisted. Although diverse cortical response patterns converged on effective duration discrimination, this diversity significantly constrained the utility of decoding models referenced to a spiking pattern averaged across all responses or averaged within the same response category. Using maximum likelihood-based decoding models, we demonstrated that the spike train recorded in a single trial could support direct estimation of stimulus onset and offset. Comparisons between different decoding models established the substantial contribution of bursts of activity at sound onset and offset to demarcating the temporal boundaries of gated tones. Our results indicate that relatively few neurons suffice to provide temporally precise estimates of such auditory "edges," particularly for models that assume and exploit the heterogeneity of neural responses in awake cortex.

Keywords: cortex; decoding; encoding; primate; scene analysis.


Figures

Fig. 1.
Fig. 1.
Examples of 4 different response types obtained in 4 different cortical neurons (1 per column) in response to tones ranging in duration from 50 to 400 ms. A: the set of peristimulus time histograms (PSTHs) indicating how responses vary as a function of tone duration. Tone onset is 0 ms, and tone offset is indicated by the gray vertical lines on each panel. B: the set of 3 confusion matrices indicates how often individual spike trains (from 0 to 500 ms, referenced to stimulus onset) were correctly associated with the stimulus that elicited each spike train. Actual durations (unlabeled) are grouped by columns, and estimated durations are grouped by rows, such that entries along the diagonal represent correct assignment of tone duration. Grayscale indicates the fraction of trials in each cell of the matrix, where black = 0, and white = 10, the number of trials presented for each duration. All columns sum to 10, since each trial for a given tone duration is assigned to an estimated duration. The 3 confusion matrices represent the results obtained for the full spike train (top left), phase-only (top right), and rate-only (bottom) classifiers (see methods). The percent of correctly assigned trials is shown below each confusion matrix. The duration tuning function (DTF, black) in the lower panel shows the firing rate averaged over the initial 500 ms of each trial, for each tone duration. Vertical lines indicate ±2 SE. The gray line indicates the average firing rate measured in the last 500 ms of each trial and is used as an estimate of the spontaneous rate. The remaining panels (CH) are displayed similarly.
Fig. 2.
Fig. 2.
Categorization of cortical response profiles to pure tones of varying duration. A: the response cube illustrates the relative magnitude of responses for 3 intervals: Onset (within 50 ms of tone onset), Offset (within 50 ms of tone offset), and On (throughout the tone duration, excluding the Onset interval). Response magnitudes were expressed relative to the spontaneous rate and then normalized to map the response of each cell to a face of the response cube. The color of each filled circle indicates the response category, and the size of each filled circle indicates the percent correct when discriminating tone duration using the full spike train classifier (see methods). B: composite PSTHs for the full population (binned at 5 ms resolution) are shown for all standard durations (50, 100, 20, 300, and 400 ms), and vertical black lines indicate the time of tone offset. Similarly, composite PSTHs were constructed for all cells categorized as Mixed (C), Phasic (D), Sustained (E), and Suppressed (F).
Fig. 3.
Fig. 3.
All response categories include neurons with both poor and excellent duration discrimination performance. A: circles representing the percent correct for each cell are color coded using the conventions in Fig. 2. Duration discrimination is compared for the full spike train (x-axis) and phase-only classifiers (y-axis). The diagonal line indicates parity in performance across the two classifiers. The smaller gray box indicates performance expected by chance for a set of 5 durations (i.e., 20%), and the larger indicates values corresponding to the listed statistical criterion. B: duration discrimination is compared for the full spike train (x-axis) and rate-only classifiers (y-axis).
Fig. 4.
Fig. 4.
Response categories capture important features of the substantial diversity of cortical responses. A: the matrix illustrates the distribution of correlation coefficients for the response PSTHs concatenated across the 5 standard durations at a temporal resolution of 25 ms. The color bar indicates the value of the correlations. B: this matrix indicates the median duration discrimination performance for the cells in each response category (grouped by rows) when the spike trains to be classified are compared against different templates, grouped by columns. The color bar indicates the mapping of discrimination performance (in percent correct) to color; for convenience, the values indicates by the colors appear within each cell of the matrix.
Fig. 5.
Fig. 5.
The sets of curves in this figure indicate the average duration discrimination performance for each of the classifier types as functions of the numbers of cells included in the classification process. When the number of cells is 2 or greater, the curves reflect the mean performance averaged over 1,000 random draws of n cells in the database. Vertical lines indicate ±2 SE. The color coding scheme is the same introduced in Fig. 2. Heavier line weights are used to indicate results for the full spike train classifier. Results from the phase-only classifier are often difficult to discern because they overlap almost entirely with results from the full spike train classifier. Results for Suppressed responses terminate at n = 16 since there were only 24 cases in total. A: all curves reflect performance of the Convergence model. B: all curves reflect performance of the Labeled Line model. C: these curves indicate the difference in performance between the 2 population coding models (Convergence − Labeled Line). Filled circles on the colored curves indicate significant differences (P < 0.0001) from the black curve representing pooling of data without regard to response group.
Fig. 6.
Fig. 6.
Estimation of stimulus offset for the Tonic and Phasic+Tonic maximum likelihood models. AD: the results of the Tonic model when estimating tone duration based on the 4 sets of PSTHs illustrated in Fig. 1. Each curve represents the trial-averaged, sum-normalized likelihood of tone durations from 0 to 450 ms, given the recorded cortical responses (see methods). Gray vertical lines indicate the actual tested durations, and colored vertical lines indicate the maxima of each curve. The colors correspond to the actual tone durations of 50 (red), 100 (yellow), 200 (green), 300 (blue), and 400 (purple). EH show the corresponding curves for the Phasic+Tonic model. I and J show population histograms of the estimated tone durations from each neuron, for each of the tested tone durations. The estimated tone duration was defined as the peak of the likelihood function (identified by vertical lines in AH). Colored vertical lines indicate the actual tested durations.
Fig. 7.
Fig. 7.
Estimation of stimulus onset for the Tonic and Phasic+Tonic maximum likelihood models. AD show the results of the Tonic model when estimating tone onset based on the 4 sets of PSTHs illustrated in Fig. 1. Each curve represents the trial-averaged, sum-normalized likelihood of tone onset (i.e., 0 ms), given the recorded cortical responses (see methods). Inset in c shows the same data on an expanded time axis. The color conventions used in Fig. 6 were retained, even though the correct onset estimate is 0 ms for all tone durations. Estimated onset times are both positive and negative due to the circularization of the time axis (see methods). EH show the corresponding curves for the Phasic+Tonic model, including inset panels with an expanded time axis. I and J show population histograms of the estimated onset time from each neuron for each of the 5 most commonly tested tone durations. Estimated onset time was defined as the peak of the likelihood function (identified by vertical lines in AH).
Fig. 8.
Fig. 8.
Contextual modulation of cortical responses permits the discrimination of tone duration from the “spontaneous” rates and onset responses. A: the scatterplot compares performance of the different spike train classifiers when the data are limited to spiking patterns recorded from 500-1,000 ms in each trial, at least 100 ms after cessation of the longest duration tones. To reduce icon overlap, results for the full spike train vs. rate-only classifier comparison (black circles) were shifted 1% to the right in A and D. Results for the full spike train vs. phase-only classifier comparison are indicated by gray circles. The smaller of the 2 gray boxes indicates chance performance, while the larger box indicates performance equivalent to the indicated P value (0.001). B and C show the responses of 2 different cells that exhibited the best discrimination of tone duration on the basis of changes in the spontaneous rates. Responses contributing to the discrimination are indicated by black histogram bars; excluded data are indicated by gray histogram bars. Thin vertical lines on the PSTHs indicate tone offset. DTFs to the right of each panel. Vertical lines on the DTF indicate ±2 SE. Performance of the full spike train classifier is indicated by the inset confusion matrix on each panel, and the percent correct is included at the top right of the matrix. D: the scatterplot is analogous to that in A, but the analysis interval is limited to the first 100 ms of the response, and only durations of 100 ms or greater (n = 4) are discriminated, which shifts both chance and the statistical criterion to larger values, as indicated by the gray boxes. E and F obey the same conventions as B and C.

Similar articles

Cited by

References

    1. Abbott L, Dayan P. The effect of correlated variability on the accuracy of a population code. Neural Comput 11: 91–101, 1999. - PubMed
    1. Abel SM. Duration discrimination of noise and tone bursts. J Acoust Soc Am 51: 1219–1223, 1972. - PubMed
    1. Atencio CA, Schreiner CE. Auditory cortical local subnetworks are characterized by sharply synchronous activity. J Neurosci 33: 18503–18514, 2013. - PMC - PubMed
    1. Aubie B, Sayegh R, Faure PA. Duration tuning across vertebrates. J Neurosci 32: 6373–6390, 2012. - PMC - PubMed
    1. Aubie B, Sayegh R, Fremouw T, Covey E, Faure PA. Decoding stimulus duration from neural responses in the auditory midbrain. J Neurophysiol 112: 2432–2445, 2014. - PMC - PubMed

Publication types

LinkOut - more resources