

Developmental programming by androgen affects the circadian timing system in female mice
- PMID: 25695720
- PMCID: PMC6366477
- DOI: 10.1095/biolreprod.114.126409
Developmental programming by androgen affects the circadian timing system in female mice
Abstract
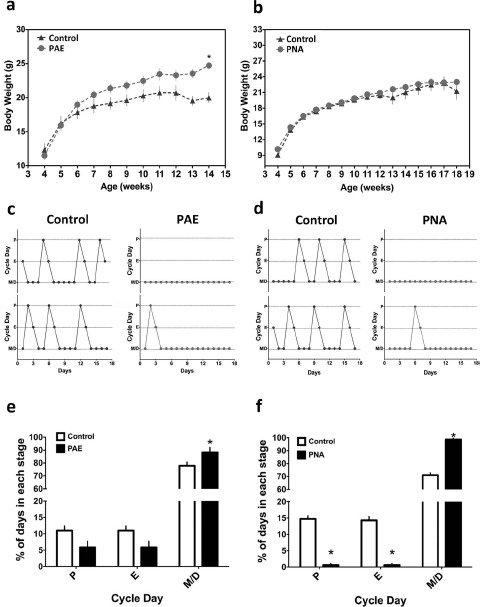
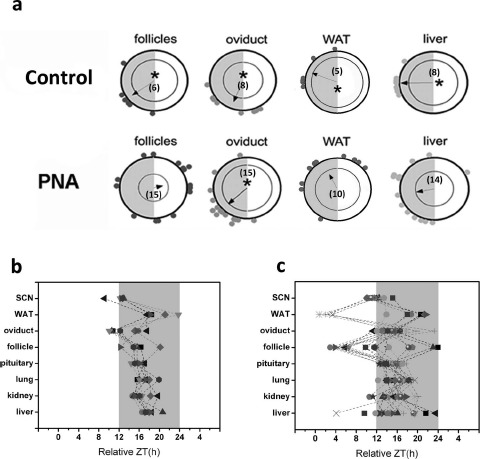
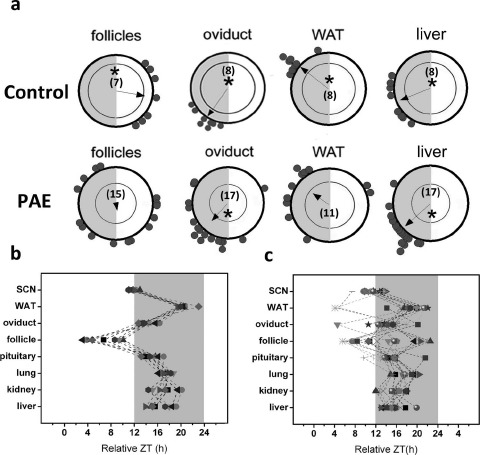
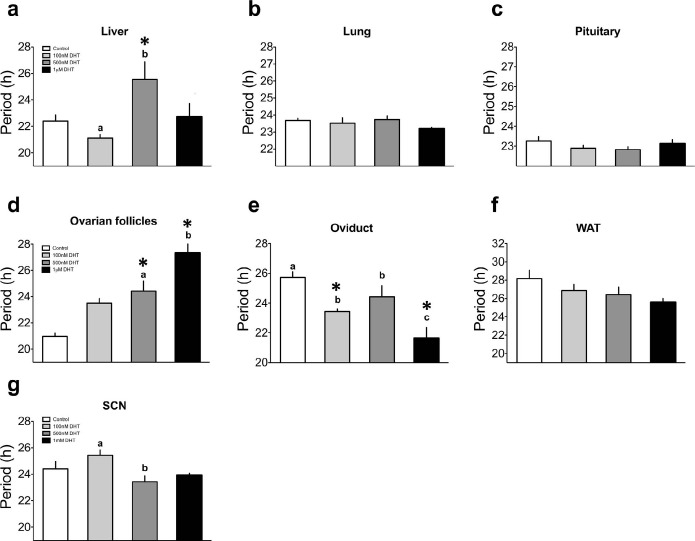
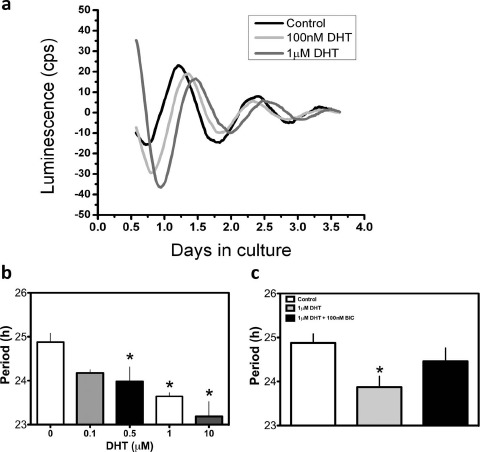
Circadian clocks play essential roles in the timing of events in the mammalian hypothalamo-pituitary-ovarian (HPO) axis. The molecular oscillator driving these rhythms has been localized to tissues of the HPO axis. It has been suggested that synchrony among these oscillators is a feature of normal reproductive function. The impact of fertility disorders on clock function and the role of the clock in the etiology of endocrine pathology remain unknown. Polycystic ovarian syndrome (PCOS) is a particularly devastating fertility disorder, affecting 5%-10% of women at childbearing age with features including a polycystic ovary, anovulation, and elevated serum androgen. Approximately 40% of these women have metabolic syndrome, marked by hyperinsulinemia, dyslipidemia, and insulin resistance. It has been suggested that developmental exposure to excess androgen contributes to the etiology of fertility disorders, including PCOS. To better define the role of the timing system in these disorders, we determined the effects of androgen-dependent developmental programming on clock gene expression in tissues of the metabolic and HPO axes. Female PERIOD2::luciferase (PER2::LUC) mice were exposed to androgen (dihydrotestosterone [DHT]) in utero (Days 16-18 of gestation) or for 9-10 wk (DHT pellet) beginning at weaning (pubertal androgen excess [PAE]). As expected, both groups of androgen-treated mice had disrupted estrous cycles. Analysis of PER2::LUC expression in tissue explants revealed that excess androgen produced circadian misalignment via tissue-dependent effects on phase distribution. In vitro treatment with DHT differentially affected the period of PER2::LUC expression in tissue explants and granulosa cells, indicating that androgen has direct and tissue-specific effects on clock gene expression that may account for the effects of developmental programming on the timing system.
Keywords: PCOS; PER2::luciferase; androgens/androgen receptors; circadian rhythm; clock genes; developmental origins of health and disease; female reproductive tract; fertility; mechanisms of hormone action; mouse; reproduction.
© 2015 by the Society for the Study of Reproduction, Inc.
Figures
Similar articles
-
Excess androgen during puberty disrupts circadian organization in female rats.Endocrinology. 2013 Apr;154(4):1636-47. doi: 10.1210/en.2012-2066. Epub 2013 Feb 15. Endocrinology. 2013. PMID: 23417420 Free PMC article.
-
Derailed peripheral circadian genes in polycystic ovary syndrome patients alters peripheral conversion of androgens synthesis.Hum Reprod. 2022 Jul 30;37(8):1835-1855. doi: 10.1093/humrep/deac139. Hum Reprod. 2022. PMID: 35728080
-
Neuroendocrine androgen action is a key extraovarian mediator in the development of polycystic ovary syndrome.Proc Natl Acad Sci U S A. 2017 Apr 18;114(16):E3334-E3343. doi: 10.1073/pnas.1616467114. Epub 2017 Mar 20. Proc Natl Acad Sci U S A. 2017. PMID: 28320971 Free PMC article.
-
Circadian clock function in the mammalian ovary.J Biol Rhythms. 2015 Feb;30(1):7-19. doi: 10.1177/0748730414554222. Epub 2014 Nov 3. J Biol Rhythms. 2015. PMID: 25367899 Review.
-
Androgen excess fetal programming of female reproduction: a developmental aetiology for polycystic ovary syndrome?Hum Reprod Update. 2005 Jul-Aug;11(4):357-74. doi: 10.1093/humupd/dmi013. Hum Reprod Update. 2005. PMID: 15941725 Review.
Cited by
-
Inhibition of Col6a5 Improve Lipid Metabolism Disorder in Dihydrotestosterone-Induced Hyperandrogenic Mice.Front Cell Dev Biol. 2021 May 24;9:669189. doi: 10.3389/fcell.2021.669189. eCollection 2021. Front Cell Dev Biol. 2021. PMID: 34109177 Free PMC article.
-
The Contribution of the Circadian Gene Bmal1 to Female Fertility and the Generation of the Preovulatory Luteinizing Hormone Surge.J Endocr Soc. 2019 Feb 13;3(4):716-733. doi: 10.1210/js.2018-00228. eCollection 2019 Apr 1. J Endocr Soc. 2019. PMID: 30906911 Free PMC article.
-
Role of core circadian clock genes in hormone release and target tissue sensitivity in the reproductive axis.Mol Cell Endocrinol. 2020 Feb 5;501:110655. doi: 10.1016/j.mce.2019.110655. Epub 2019 Nov 19. Mol Cell Endocrinol. 2020. PMID: 31756424 Free PMC article. Review.
-
Conditional Deletion of Bmal1 in Ovarian Theca Cells Disrupts Ovulation in Female Mice.Endocrinology. 2016 Feb;157(2):913-27. doi: 10.1210/en.2015-1645. Epub 2015 Dec 15. Endocrinology. 2016. PMID: 26671182 Free PMC article.
-
Prenatal androgen treatment impairs the suprachiasmatic nucleus arginine-vasopressin to kisspeptin neuron circuit in female mice.Front Endocrinol (Lausanne). 2022 Aug 5;13:951344. doi: 10.3389/fendo.2022.951344. eCollection 2022. Front Endocrinol (Lausanne). 2022. PMID: 35992143 Free PMC article.
References
-
- Albrecht U. Timing to perfection: the biology of central and peripheral circadian clocks. Neuron 2012; 74:246–260. - PubMed
-
- Boden MJ, Varcoe TJ, Kennaway DJ.. Circadian regulation of reproduction: from gamete to offspring. Prog Biophys Mol Biol 2013; 113:387–397. - PubMed
-
- Sellix MT. Circadian clock function in the mammalian ovary. J Biol Rhythms 2015; 30:7–19. - PubMed
-
- Bronson FH. Vom Saal FS. Control of the preovulatory release of luteinizing hormone by steroids in the mouse. Endocrinology 1979; 104:1247–1255. - PubMed
-
- Goldman BD. The circadian timing system and reproduction in mammals. Steroids 1999; 64:679–685. - PubMed
Publication types
MeSH terms
Substances
Grants and funding
LinkOut - more resources
Full Text Sources
Other Literature Sources
Molecular Biology Databases
Research Materials
