. 2015 Feb 19;10(2):e0116703.
doi: 10.1371/journal.pone.0116703. eCollection 2015.

Guanine-modified inhibitory oligonucleotides efficiently impair TLR7- and TLR9-mediated immune responses of human immune cells

Affiliations

Guanine-modified inhibitory oligonucleotides efficiently impair TLR7- and TLR9-mediated immune responses of human immune cells

Franziska Römmler et al. PLoS One. .

Abstract

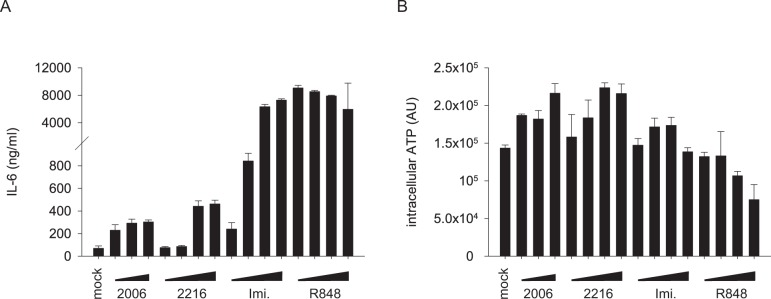
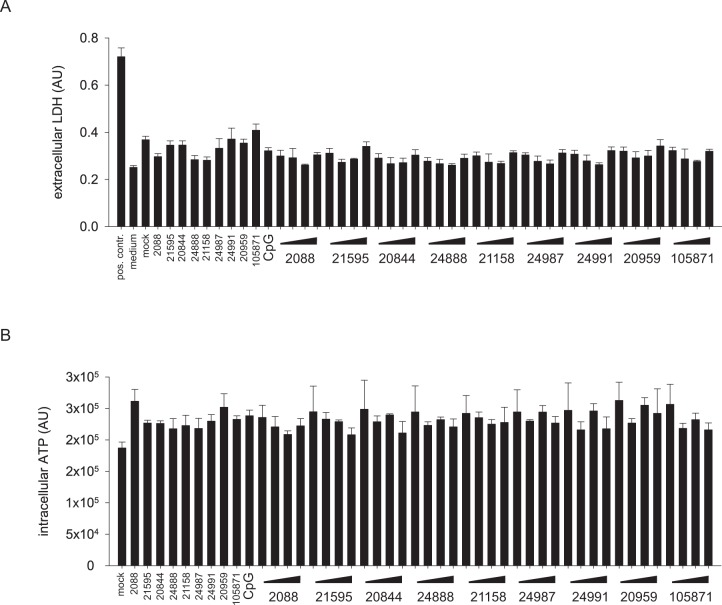
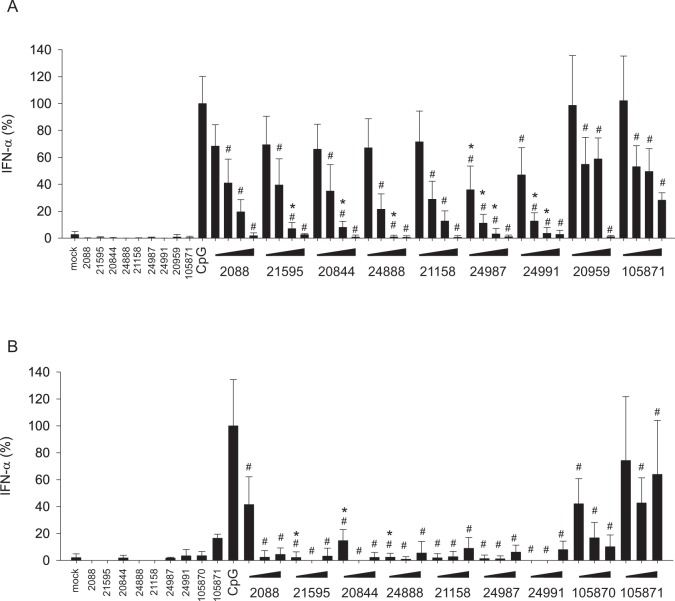
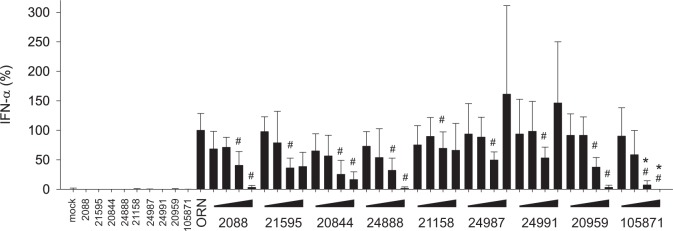
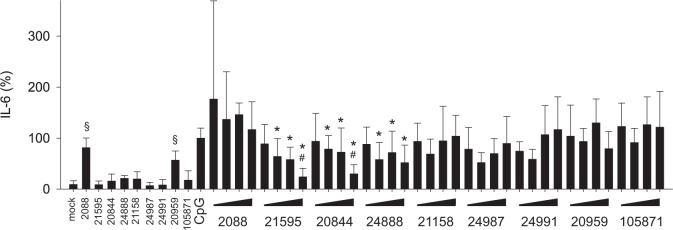
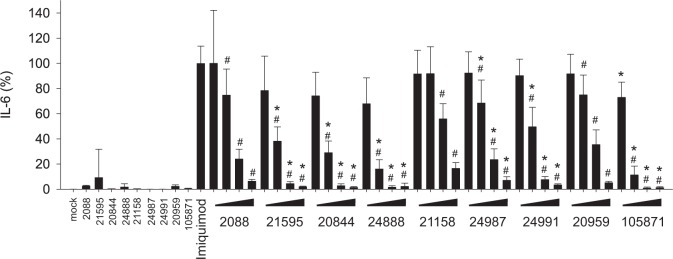
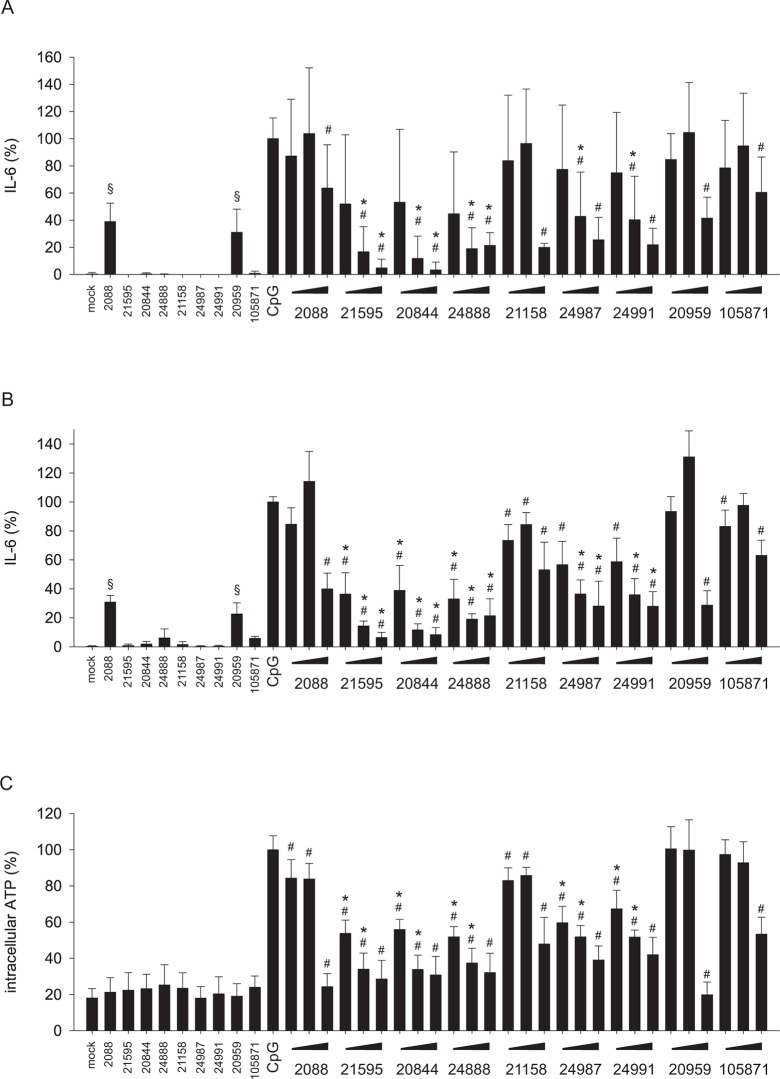
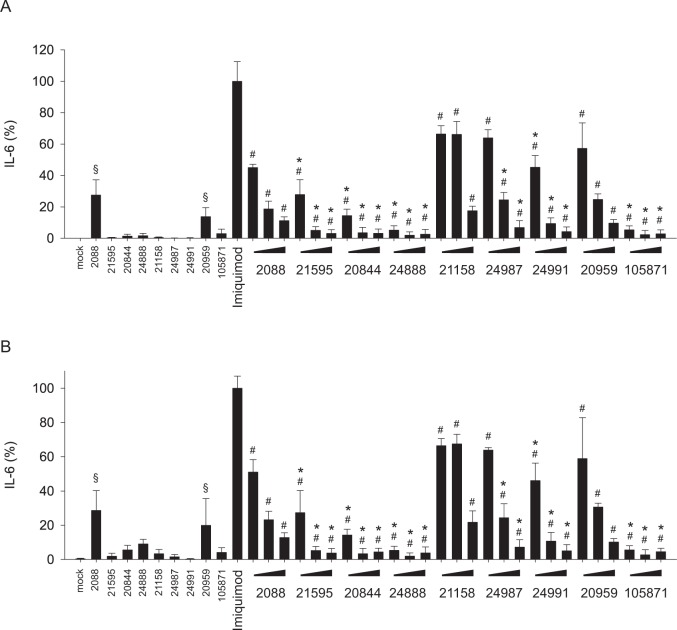
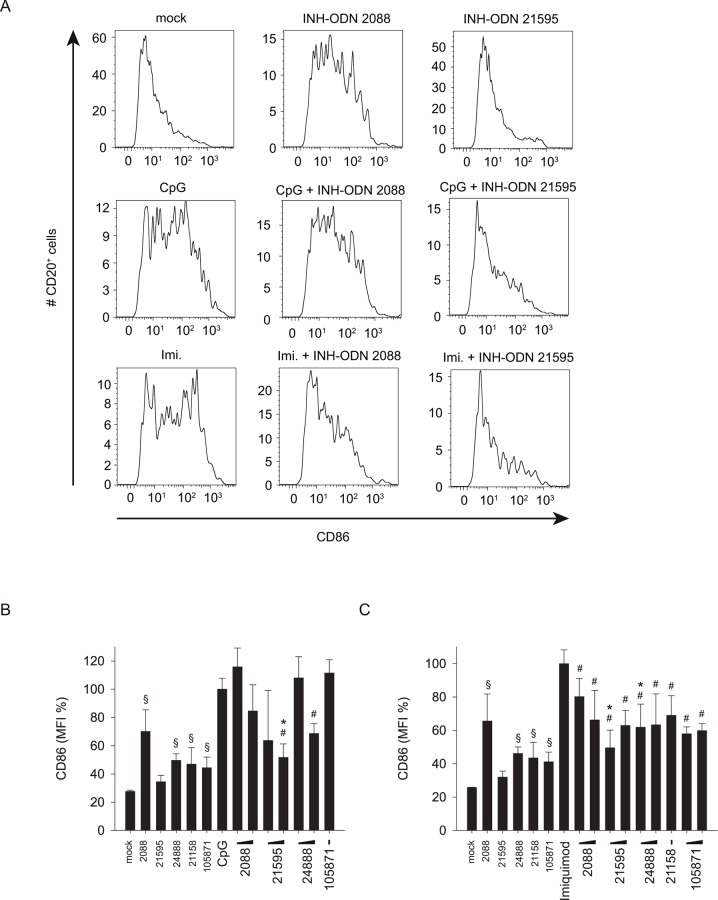
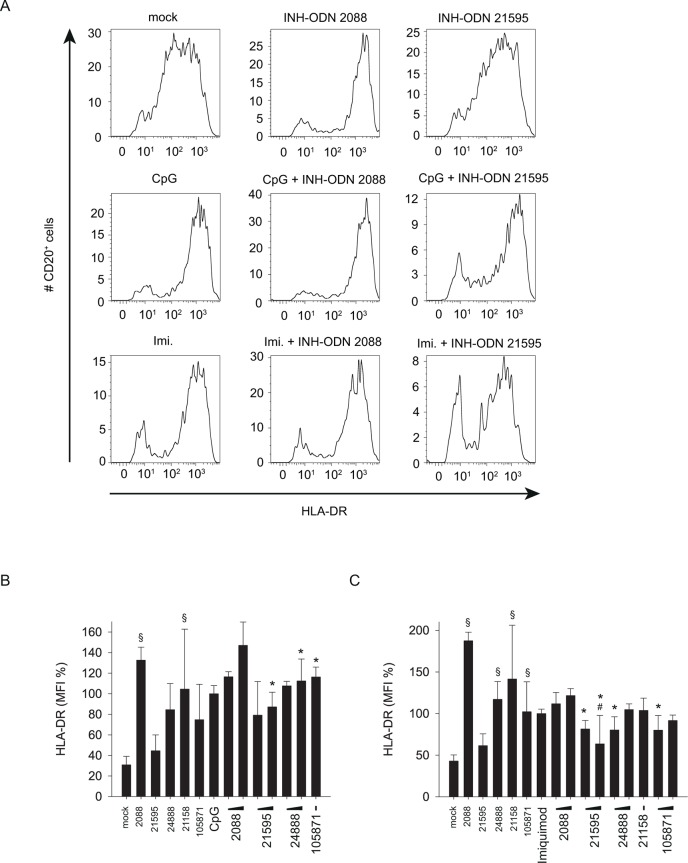
Activation of TLR7 and TLR9 by endogenous RNA- or DNA-containing ligands, respectively, is thought to contribute to the complicated pathophysiology of systemic lupus erythematosus (SLE). These ligands induce the release of type-I interferons by plasmacytoid dendritic cells and autoreactive antibodies by B-cells, both responses being key events in perpetuating SLE. We recently described the development of inhibitory oligonucleotides (INH-ODN), which are characterized by a phosphorothioate backbone, a CC(T)XXX3-5GGG motif and a chemical modification of the G-quartet to avoid the formation of higher order structures via intermolecular G-tetrads. These INH-ODNs were equally or significantly more efficient to impair TLR7- and TLR9-stimulated murine B-cells, macrophages, conventional and plasmacytoid dendritic cells than the parent INH-ODN 2088, which lacks G-modification. Here, we evaluate the inhibitory/therapeutic potential of our set of G-modified INH-ODN on human immune cells. We report the novel finding that G-modified INH-ODNs efficiently inhibited the release of IFN-α by PBMC stimulated either with the TLR7-ligand oligoribonucleotide (ORN) 22075 or the TLR9-ligand CpG-ODN 2216. G-modification of INH-ODNs significantly improved inhibition of IL-6 release by PBMCs and purified human B-cells stimulated with the TLR7-ligand imiquimod or the TLR9-ligand CpG-ODN 2006. Furthermore, inhibition of B-cell activation analyzed by expression of activation markers and intracellular ATP content was significantly improved by G-modification. As observed with murine B-cells, high concentrations of INH-ODN 2088 but not of G-modified INH-ODNs stimulated IL-6 secretion by PBMCs in the absence of TLR-ligands thus limiting its blocking efficacy. In summary, G-modification of INH-ODNs improved their ability to impair TLR7- and TLR9-mediated signaling in those human immune cells which are considered as crucial in the pathophysiology of SLE.


Conflict of interest statement

Competing Interests: This study was funded in part by Coley Pharmaceutical GmbH. Coley Pharmaceutical GmbH was closed down in 2011. Co-author Marion Jurk is employed by Miltenyi Biotec GmbH. Co-author Eugen Uhlmann is employed by Adiutide Pharmaceuticals GmbH and co-author Jörg Vollmer is employed by Nexigen GmbH. There are no patents, products in development or marketed products to declare. This does not alter the authors' adherence to all the PLOS ONE policies on sharing data and materials.

Figures

Fig 1
Fig 1. Dose response relationship of TLR7- and TLR9-ligands.
(A) Human PBMCs (2x10⁵ cells/well) were stimulated with the TLR9-ligands CpG-ODN 2006 (1, 5, 10 μM) or CpG-ODN 2216 (0.5, 1, 5, 10 μM) or with the TLR7-ligands imiquimod (0.5, 1, 5, 10 μM) or R848 (0.5, 1, 5, 10 μM). After a culture period of 4 days IL-6 was quantified in the culture supernatant by ELISA. (B) The intracellular ATP content of the cells stimulated in (A) was analyzed. Error bars represent SD of three individual cultures from one donor.
Fig 2
Fig 2. INH-ODNs are not toxic for human PBMCs.
(A) PBMCs (4x10⁵ cells/well) were cultured with INH-ODNs alone (10 μM) or with a combination of CpG-DNA 2006 (100 nM) and titrated amounts of INH-ODNs (0.01, 0.1, 1, 10 μM). Medium in the absence of cells (medium) and cells cultured in the absence of CpG-DNA 2006 or INH-ODNs (mock) served as negative controls. Bovine LDH was used as positive control (pos. contr.). The extracellular LDH-content was determined after 48h of culture. Error bars represent SD of three individual cultures. The experiment was repeated with imiquimod (5 μg/ml) using cells from a different donor (data not shown). INH-ODNs were again not toxic. (B) PBMCs (4x10⁵ cells/well) were not stimulated (mock) or stimulated with CpG-ODN 2006 (100 nM) or a combination of CpG-ODN 2006 (100 nM) and titrated amounts of INH-ODNs (0.01, 0.1, 1, 10 μM) as indicated. The intracellular ATP-content was determined after 48h of culture. Error bars represent SD of three individual cultures. The experiment was repeated twice with cells from another donor with similar results.
Fig 3
Fig 3. INH-ODNs impair efficiently TLR9-mediated release of IFN-α by PBMCs.
(A) Human PBMCs (5–6x10⁵ cells/well) were stimulated with CpG-ODN 2216 (3 μM) in the absence (CpG) or presence of titrated amounts of INH-ODNs (0.01, 0.1, 1, 10 μM) for 24h. IFN-α was determined in the culture supernatant by ELISA. To determine whether INH-ODNs influence IFN-α release per se, the highest dose (10 μM) of each INH-ODN was also evaluated without TLR-mediated stimulation. Data represent mean and SD of three independent experiments, each experiment was performed with cells from a different donor (each bar represents n = 6–9 cultures). #p<0.05, ANOVA compared to CpG-ODN 2216; *p<0.05, ANOVA compared to INH-ODN 2088 for G-modified INH-ODNs 21595, 20844 and 24888 and compared to INH-ODN 21158 for G-modified INH-ODN 24987 and 24991. (B) For comparison bone marrow-derived pDCs (2x10⁵ cells/well) from lupus-prone MRL/Mp-lpr/lpr mice were treated as described in (A) with the exception that instead of INH-ODN 20959 G-modified INH-ODN 105870 was used. INH-ODN were used at a concentration of 0.1, 1, 10 μM. Data represent mean and SD of two separate experiments (each bar represents n = 2–6 cultures). #p<0.05, ANOVA compared to CpG-ODN 2216; *p<0.05, ANOVA compared to INH-ODN 2088 for G-modified INH-ODNs 21595, 20844 and 24888.
Fig 4
Fig 4. IFN-α release triggered via TLR7 is also efficiently impaired by INH-ODNs.
The experiment was performed as described in Fig. 3A with the exception that PBMCs were stimulated with the TLR7-ligand RNA-ORN 22075 (5 μM). Data represent mean and SD of three independent experiments, each experiment was performed with cells from a different donor (each bar represents n = 9 cultures). #p<0.05, ANOVA compared to RNA-ORN; *p<0.05, ANOVA compared to INH-ODN 20959 for G-modified INH-ODN 105871.
Fig 5
Fig 5. G-modified INH-ODNs were significantly more effective in preventing IL-6 release by CpG-ODN-stimulated human PBMCs.
PBMCs (3–4x10⁵ cells/well) were stimulated with CpG-ODN 2006 (100 nM) in the absence (CpG) or presence of titrated amounts of INH-ODNs (0.01, 0.1, 1, 10 μM) for 48h. IL-6 was determined in the culture supernatant by ELISA. To determine whether INH-ODNs influence IL-6 release per se, the highest dose (10 μM) of each INH-ODN was also evaluated without TLR-mediated stimulation. Data represent mean and SD of three independent experiments, each experiment was performed with cells from a different donor (each bar represents n = 8–9 cultures). #p<0.05, ANOVA compared to CpG-ODN 2006; *p<0.05, ANOVA compared to INH-ODN 2088 for G-modified INH-ODNs 21595, 20844 and 24888; §p<0.05, ANOVA compared to mock in the absence of a TLR-stimulus.
Fig 6
Fig 6. G-modification significantly improves the ability of INH-ODNs to impair imiquimod-induced IL-6 release by human PBMCs.
PBMCs (4x10⁵ cells/well) were stimulated with imiquimod (5 μg/ml) in the absence (imiquimod) or presence of titrated amounts of INH-ODNs (0.01, 0.1, 1, 10 μM) for 48h. IL-6 was determined in the culture supernatant by ELISA. To determine whether INH-ODNs influence IL-6 release per se, the highest dose (10 μM) of each INH-ODN was also evaluated without TLR-mediated stimulation. Data represent mean and SD of two independent experiments, each experiment was performed with cells from a different donor (each bar represents n = 6 cultures). #p<0.05, ANOVA compared to imiquimod; *p<0.05, ANOVA compared to INH-ODN 2088 for G-modified INH-ODNs 21595, 20844 and 24888 or compared to INH-ODN 21158 for G-modified INH-ODN 24987 and 24991 or compared to INH-ODN 20959 in case of G-modified INH-ODN 105871.
Fig 7
Fig 7. IL-6 release by CpG-ODN-activated human B-cells is significantly more prevented by G-modified INH-ODNs.
(A) B-cells (5–10x104 cells/well) were stimulated with CpG-ODN 2006 (100 nM) in the absence (CpG) or presence of titrated amounts of INH-ODNs (0.1, 1, 10 μM) for 24h. IL-6 was determined in the culture supernatant by ELISA. To determine whether INH-ODNs influence IL-6 release per se, the highest dose (10 μM) of each INH-ODN was also evaluated without TLR-mediated stimulation. Data represent mean and SD of three independent experiments, each experiment was performed with cells from a different donor (each bar represents n = 4–9 cultures). (B) IL-6 content of the culture supernatants of the experiment described in (A) was additionally determined after 5 days of culture. (C) depicts the intracellular ATP-content of the cells described in (B). Data represent mean and SD of three independent experiments, each experiment was performed with cells from a different donor (each bar represents n = 4–9 cultures). #p<0.05, ANOVA compared to CpG-ODN 2006; *p<0.05, ANOVA compared to INH-ODN 2088 for G-modified INH-ODNs 21595, 20844 and 24888 or compared to INH-ODN 21158 for G-modified INH-ODN 24987 and 24991; §p<0.05, ANOVA compared to mock in the absence of a TLR-stimulus.
Fig 8
Fig 8. G-modified INH-ODNs are significantly more effective to inhibit IL-6 release by imiquimod-stimulated human B-cells.
(A) B-cells (1x10⁵ cells/well) were stimulated with imiquimod (5 μg/ml) in the absence (imiquimod) or presence of titrated amounts of INH-ODNs (0.1, 1, 10 μM) for 24h. IL-6 was determined in the culture supernatant by ELISA. To determine whether INH-ODNs influence IL-6 release per se, the highest dose (10 μM) of each INH-ODN was also evaluated without TLR-mediated stimulation. Data represent mean and SD from two independent experiments, each experiment was performed with cells from a different donor (each bar represents n = 3–6 cultures). (B) IL-6 content of the culture supernatants of the experiment described in (A) was additionally determined after 6 days of culture. #p<0.05, ANOVA compared to imiquimod; *p<0.05, ANOVA compared to INH-ODN 2088 for G-modified INH-ODNs 21595, 20844 and 24888 or compared to INH-ODN 21158 for G-modified INH-ODN 24987 and 24991 or compared to INH-ODN 20959 in case of G-modified INH-ODN 105871; §p<0.05, ANOVA compared to mock in the absence of a TLR-stimulus.
Fig 9
Fig 9. G-modified INH-ODNs prevent CpG-ODN or imiquimod induced CD86 expression by CD20+ B-cells.
PBMCs (4x10⁵ cells/well) were stimulated with CpG-ODN 2006 (100 nM) or imiquimod (5 μg/ml) in the absence or presence of INH-ODNs (1, 10 μM). After 48h cells were harvested, stained with CD20 and CD86 antibodies and CD20+ cells were analyzed by flow cytometry for CD86 expression. (A) shows CD86 expression profiles upon treatment with individual stimulator/inhibitor combinations as indicated. (B) and (C) depict CD86 expression post stimulation with CpG-ODN 2006 (B) or imiquimod (C) from two independent experiments. Data represent mean and SD of these two experiments, each experiment was performed with cells from a different donor (each bar represents n = 4 cultures). #p<0.05, ANOVA compared to CpG-ODN 2006; *p<0.05, ANOVA compared to INH-ODN 2088 for G-modified INH-ODNs 21595 and 24888 §p<0.05, ANOVA compared to mock in the absence of a TLR-stimulus.
Fig 10
Fig 10. G-modified INH-ODNs partially prevent CpG-ODN or imiquimod induced HLA-DR expression by CD20+ B-cells.
The cells used in Fig. 9 were also stained with an HLA-DR antibody and analyzed by flow cytometry for HLA-DR expression. (A) shows HLA-DR expression profiles upon treatment with individual stimulator/inhibitor combinations as indicated. (B) and (C) depict HLA-DR expression post stimulation with CpG-ODN 2006 (B) or imiquimod (C) from two independent experiments. Data represent mean and SD of these two experiments, each experiment was performed with cells from a different donor (each bar represents n = 4 cultures). #p<0.05, ANOVA compared to CpG-ODN 2006; *p<0.05, ANOVA compared to INH-ODN 2088 for G-modified INH-ODNs 21595 and 24888 §p<0.05, ANOVA compared to mock in the absence of a TLR-stimulus.

Similar articles

Cited by

References

    1. Baccala R, Hoebe K, Kono DH, Beutler B, Theofilopoulos AN (2007) TLR-dependent and TLR-independent pathways of type I interferon induction in systemic autoimmunity. Nat Med 13: 543–551. - PubMed
    1. Yoshida H, Okabe Y, Kawane K, Fukuyama H, Nagata S (2005) Lethal anemia caused by interferon-beta produced in mouse embryos carrying undigested DNA. Nat Immunol 6: 49–56. - PubMed
    1. Kono DH, Baccala R, Theofilopoulos AN (2013) TLRs and interferons: a central paradigm in autoimmunity. Curr Opin Immunol 25: 720–727. 10.1016/j.coi.2013.10.006 - DOI - PMC - PubMed
    1. Barrat FJ, Meeker T, Gregorio J, Chan JH, Uematsu S, et al. (2005) Nucleic acids of mammalian origin can act as endogenous ligands for Toll-like receptors and may promote systemic lupus erythematosus. J Exp Med 202: 1131–1139. - PMC - PubMed
    1. Leadbetter EA, Rifkin IR, Hohlbaum AM, Beaudette BC, Shlomchik MJ, et al. (2002) Chromatin-IgG complexes activate B cells by dual engagement of IgM and Toll-like receptors. Nature 416: 603–607. - PubMed

Publication types

MeSH terms